Search Knowledge Base by Keyword
How To Trade Symmetrical Triangle Pattern? | Crypto Chart Pattern
What is Symmetrical Triangle Pattern?
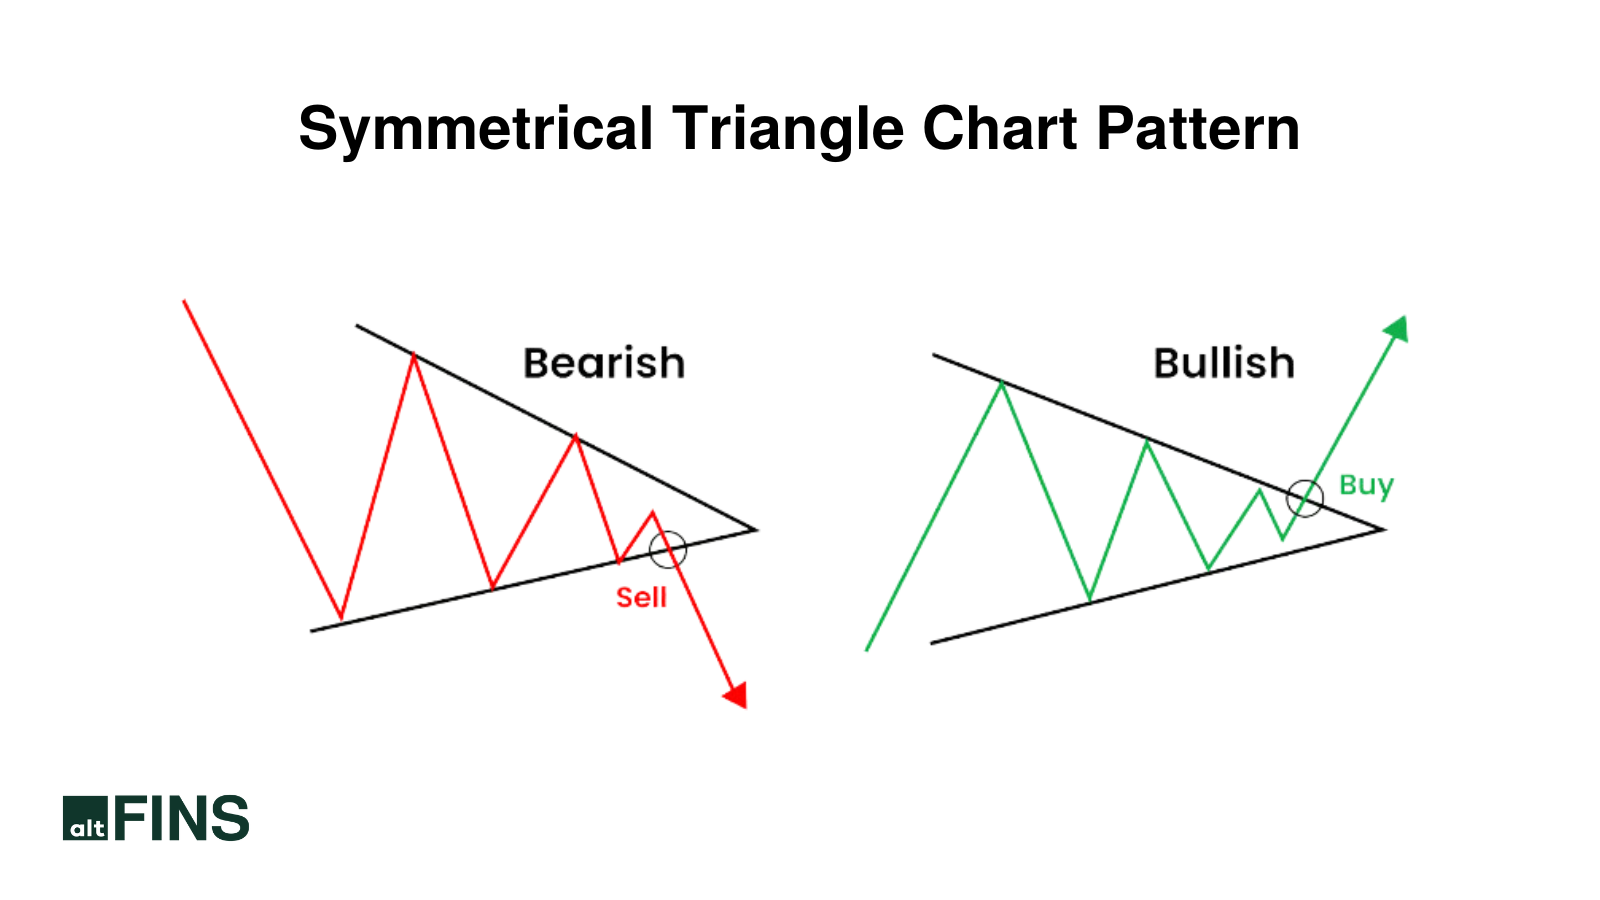
The symmetrical triangle pattern is a continuation formation in technical analysis. It features two converging trendlines, one sloping upward and the other downward, signaling a contraction in price range and decreasing volatility.
A breakout above or below the trendlines, often with increased volume, marks the pattern’s completion. Traders may use the triangle’s height to estimate a potential price target for the breakout. While the symmetrical triangle often indicates a continuation of the prevailing trend, it’s essential to consider other technical indicators for a comprehensive analysis.
Bullish Symmetrical Triangle Pattern
A bullish symmetrical triangle pattern typically occurs in an uptrend.
- Characteristics: It is characterized by two converging trendlines—one sloping downward from the highs and one sloping upward from the lows. The upper trendline represents resistance, connecting lower highs, while the lower trendline represents support, connecting higher lows.
- Volume: During the formation of a bullish symmetrical triangle, trading volume often decreases, which is a key feature of the pattern. Volume reduction indicates a consolidation phase in the market.
- Breakout: The anticipated signal is a breakout above the upper trendline. This breakout is considered bullish and may signal the continuation of the previous uptrend. Traders may interpret this as a potential continuation of the prevailing trend or the beginning of a new upward move.
- Target: The target for a bullish symmetrical triangle is often calculated by measuring the height of the triangle at its widest point and projecting that distance upward from the breakout point.
Bearish Symmetrical Triangle Pattern
A bearish symmetrical triangle pattern typically occurs in a downtrend.
- Characteristics: Similar to the bullish symmetrical triangle, a bearish symmetrical triangle has two converging trendlines but develops during a downtrend. The upper trendline represents resistance, connecting lower highs, while the lower trendline represents support, connecting higher lows.
- Volume: During the formation of a bearish symmetrical triangle, trading volume often decreases, indicating a consolidation phase before the next move.
- Breakout: The anticipated signal is a breakdown below the lower trendline. This breakout is considered bearish and may signal the continuation of the previous downtrend. Traders may interpret this as a potential continuation of the prevailing trend or the beginning of a new downward move.
- Target: The target for a bearish symmetrical triangle is often calculated by measuring the height of the triangle at its widest point and projecting that distance downward from the breakout point.
Symmetrical Triangle Patterns Trade Setup
In layman’s terms, a symmetrical triangle chart patterns indicates that neither buyers nor sellers have a clear advantage, resulting in a market stalemate. Price moves within the narrowing range until a breakout occurs, favoring one side. The breakout direction usually aligns with the prevailing trend, continuing the established price movement.
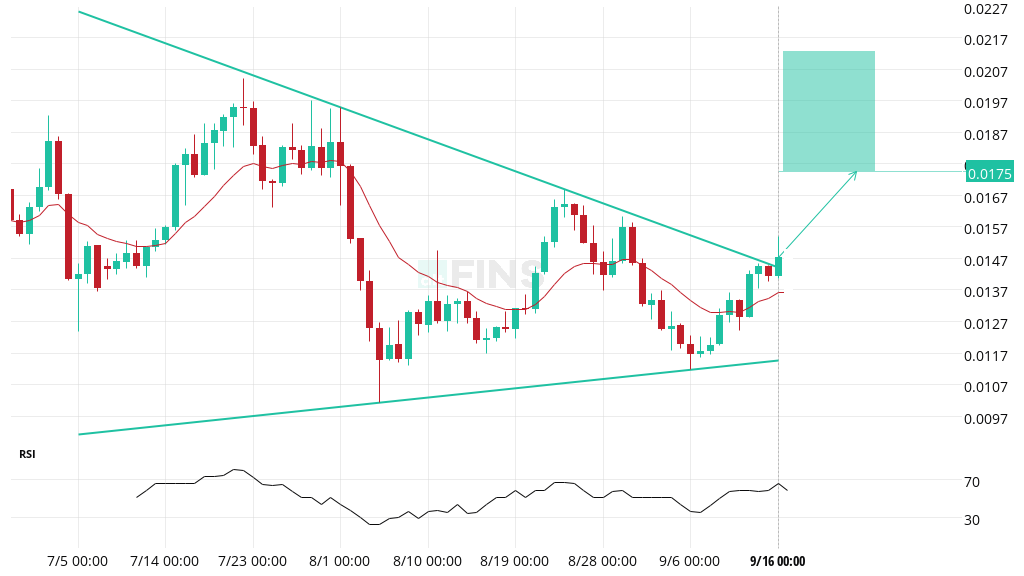
Example – Fantom (FTM) – Symmetrical Triangle Breakout – Bullish
Learn more about Symmetrical Triangle in this trading video.
How to Trade Symmetrical Triangle Chart Patterns?
When price breaks either the upper or lower trendline, the price is expected to move in the breakout direction. Emerging patterns (before a breakout) can be traded by swing traders between the trendlines, but most traders wait for a completed breakout before entering a trade.
Steps to Trade a Symmetrical Triangle Pattern:
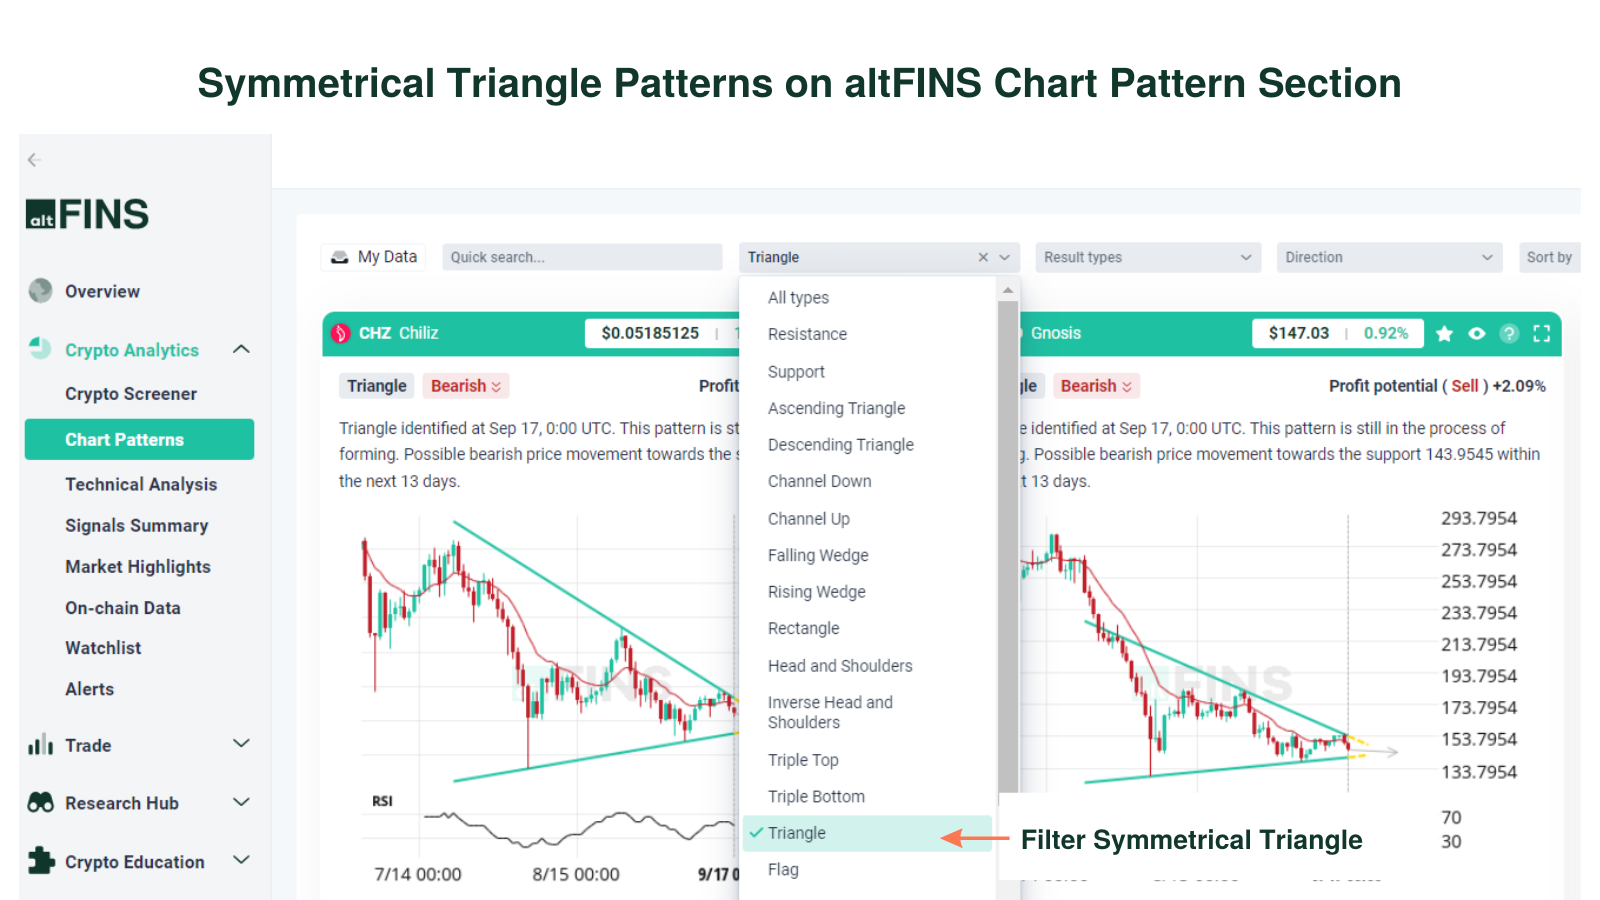
Identify the Symmetrical Triangle: Look for two converging trendlines with one sloping upward and the other downward, containing price movements within their boundaries. Or got o altFINS and filter Triangle on Crypto Screener, Signals Summary, Technical Analysis and Chart Patterns section.
Confirm the Pattern: Ensure that the triangle is well-formed, with at least two touches on both the upper and lower trendlines. The more touches, the stronger the pattern.
Volume Analysis: Monitor trading volume, which typically diminishes as the pattern forms, signaling a consolidation phase.
Wait for Breakout: A breakout above the upper trendline signals a bullish move, while a breakdown below the lower trendline signals a bearish move. This breakout often aligns with the prevailing trend direction.
Confirmation of Breakout: Look for a significant increase in trading volume upon breakout, confirming the pattern and signaling a potential continuation of the trend.
Set Stop-Loss and Take-Profit Levels: Place a stop-loss order outside the opposite side of the breakout to protect against false moves. Set a target price based on the height of the triangle, projected from the breakout point. Learn Risk Management in altFINS Crypto Trading Course.
How To Identify Symmetrical Triangle Pattern on altFINS?
To identify cryptocurrencies with symmetrical triangle patterns, visit the following altFINS sections:
- Chart Patterns Section: altFINS’ AI chart pattern recognition engine identifies 26 trading patterns across multiple time intervals (15 min, 1h, 4h, 1d), saving traders time.
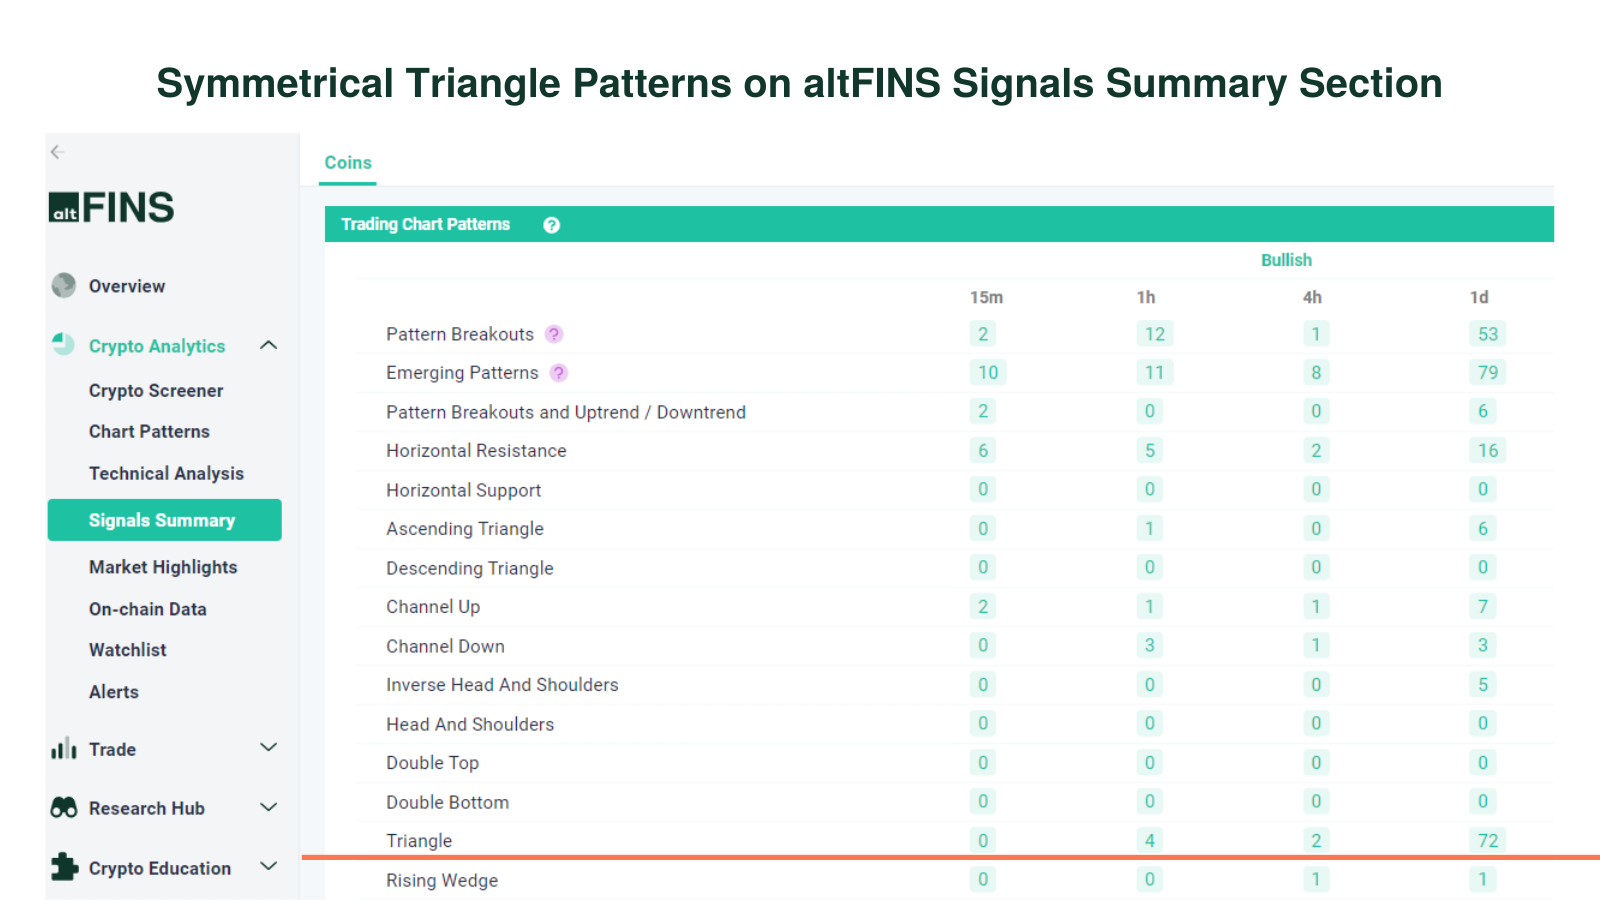
- Signals Summary: Crypto signals summarize predefined and custom filters for trading strategies. Symmetrical triangle patterns can be found under the Trading Patterns category.
- Crypto Screener – Pre-set Filters: Use pre-set filters to find the best crypto investments based on specific trading strategies.
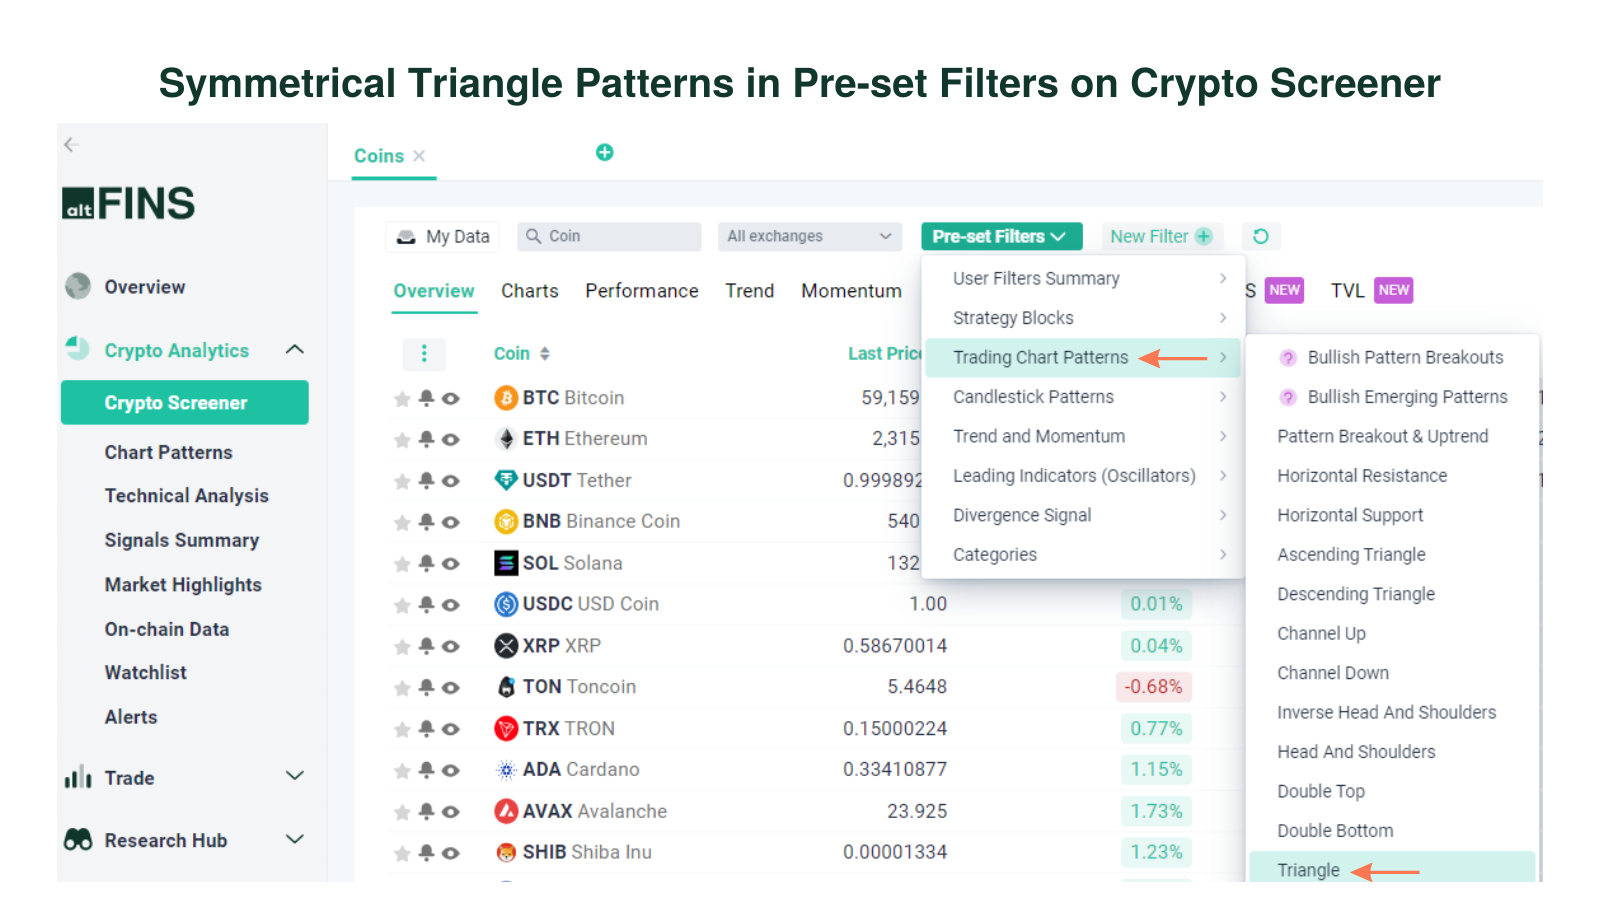
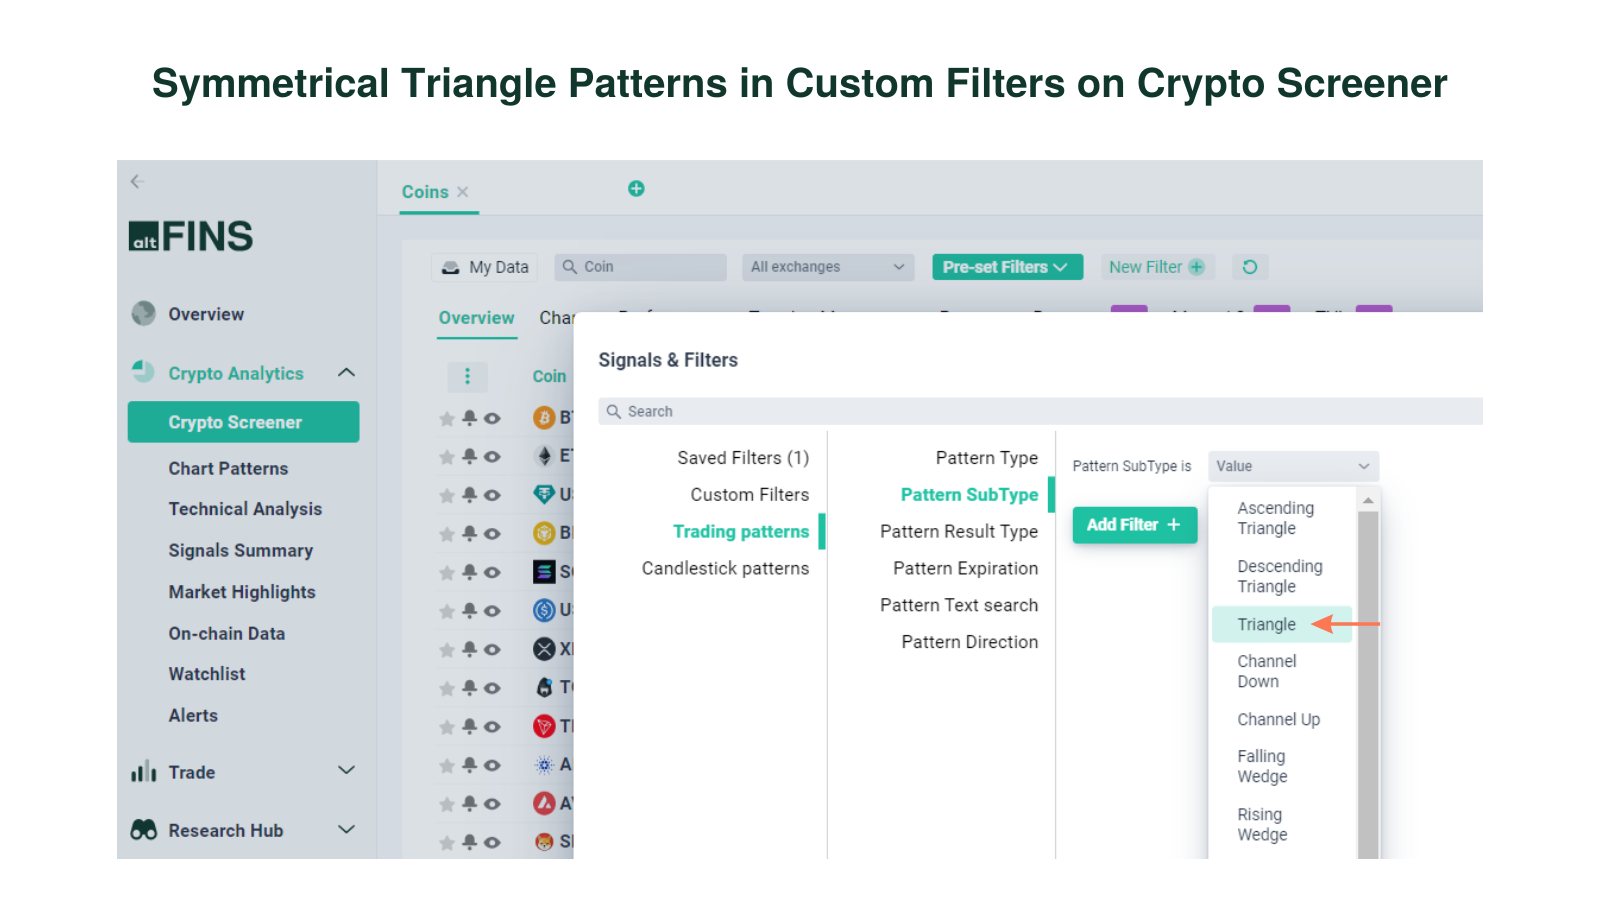
Crypto Screener – Custom Filters: Create custom screens using technical indicators (SMA, EMA, RSI, MACD), market cap, volume, and price performance. Set price alerts for your scans.
- Technical Analysis: altFINS’ analysts conduct technical analysis of the top 60 coins, focusing on trend, momentum, volume, chart patterns, and support and resistance.
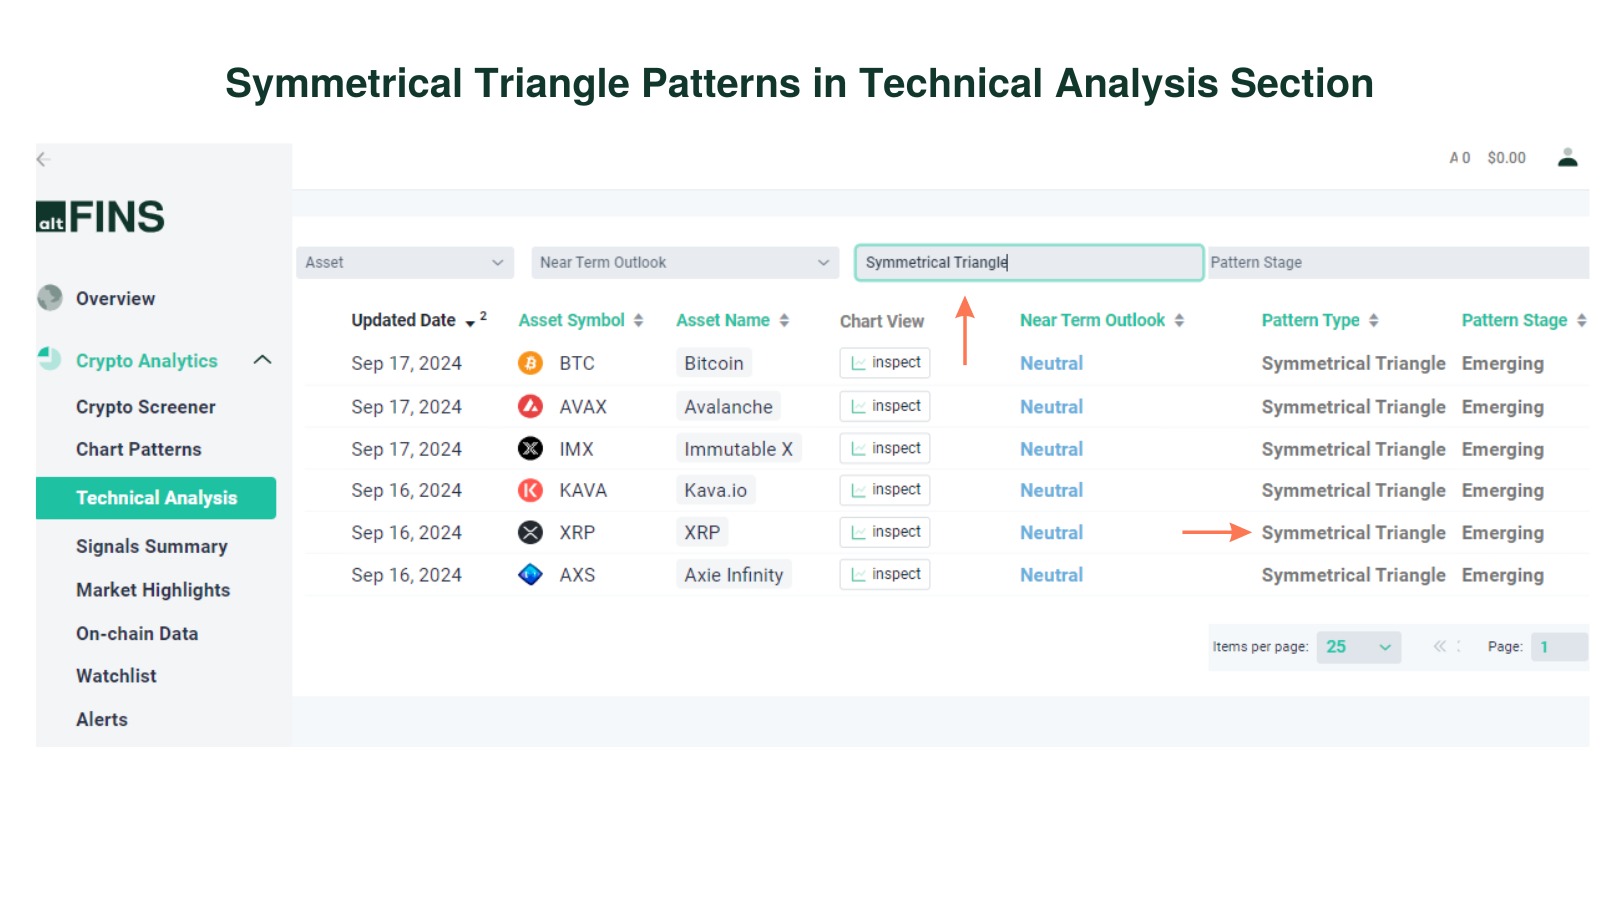
Go to Technical Analysis section
For a deeper understanding, explore these sections on the altFINS platform to refine your trading strategy with symmetrical triangle patterns.
More tips:
- Lean how to trade Chart Patterns?
- What are Crypto Chart Patterns?
- How to Trade Channel Down Pattern?
- How to Trade Channel Up Pattern?
- How to Set up Chart Pattern Alerts?
- How To Trade Rising Wedge pattern?
