

Search Knowledge Base by Keyword
SMA vs EMA: Which Moving Average Is Better for Crypto Trading?
A simple moving average (SMA) gives every recent price the same weight, so it is smoother and slower. An exponential moving average (EMA) gives the most recent prices more weight, so it turns faster and hugs price more closely. Neither is “better” in every case: EMA suits fast crypto markets and short term trading, while SMA suits higher time frames and long term trend and support work.
This guide shows exactly how each average is built, why EMA reacts quicker, and which one to use for scalping, day trading, swing trading and long term investing in crypto. It also lists the moving average settings most crypto traders actually use, and explains the golden cross and death cross.
It is written for crypto traders who want a straight answer plus the reasoning behind it. If you are still learning chart basics, read the altFINS guide to support and resistance alongside this one.
Quick answer: Use an EMA when you need speed: intraday charts, fast trending coins, and crossover signals where an early entry matters. Use an SMA when you need stability: the daily and weekly charts, long term trend direction, and key levels like the 200 day average that the whole market watches. Many crypto traders run both, for example a 21 EMA for momentum and a 200 SMA for the big picture.
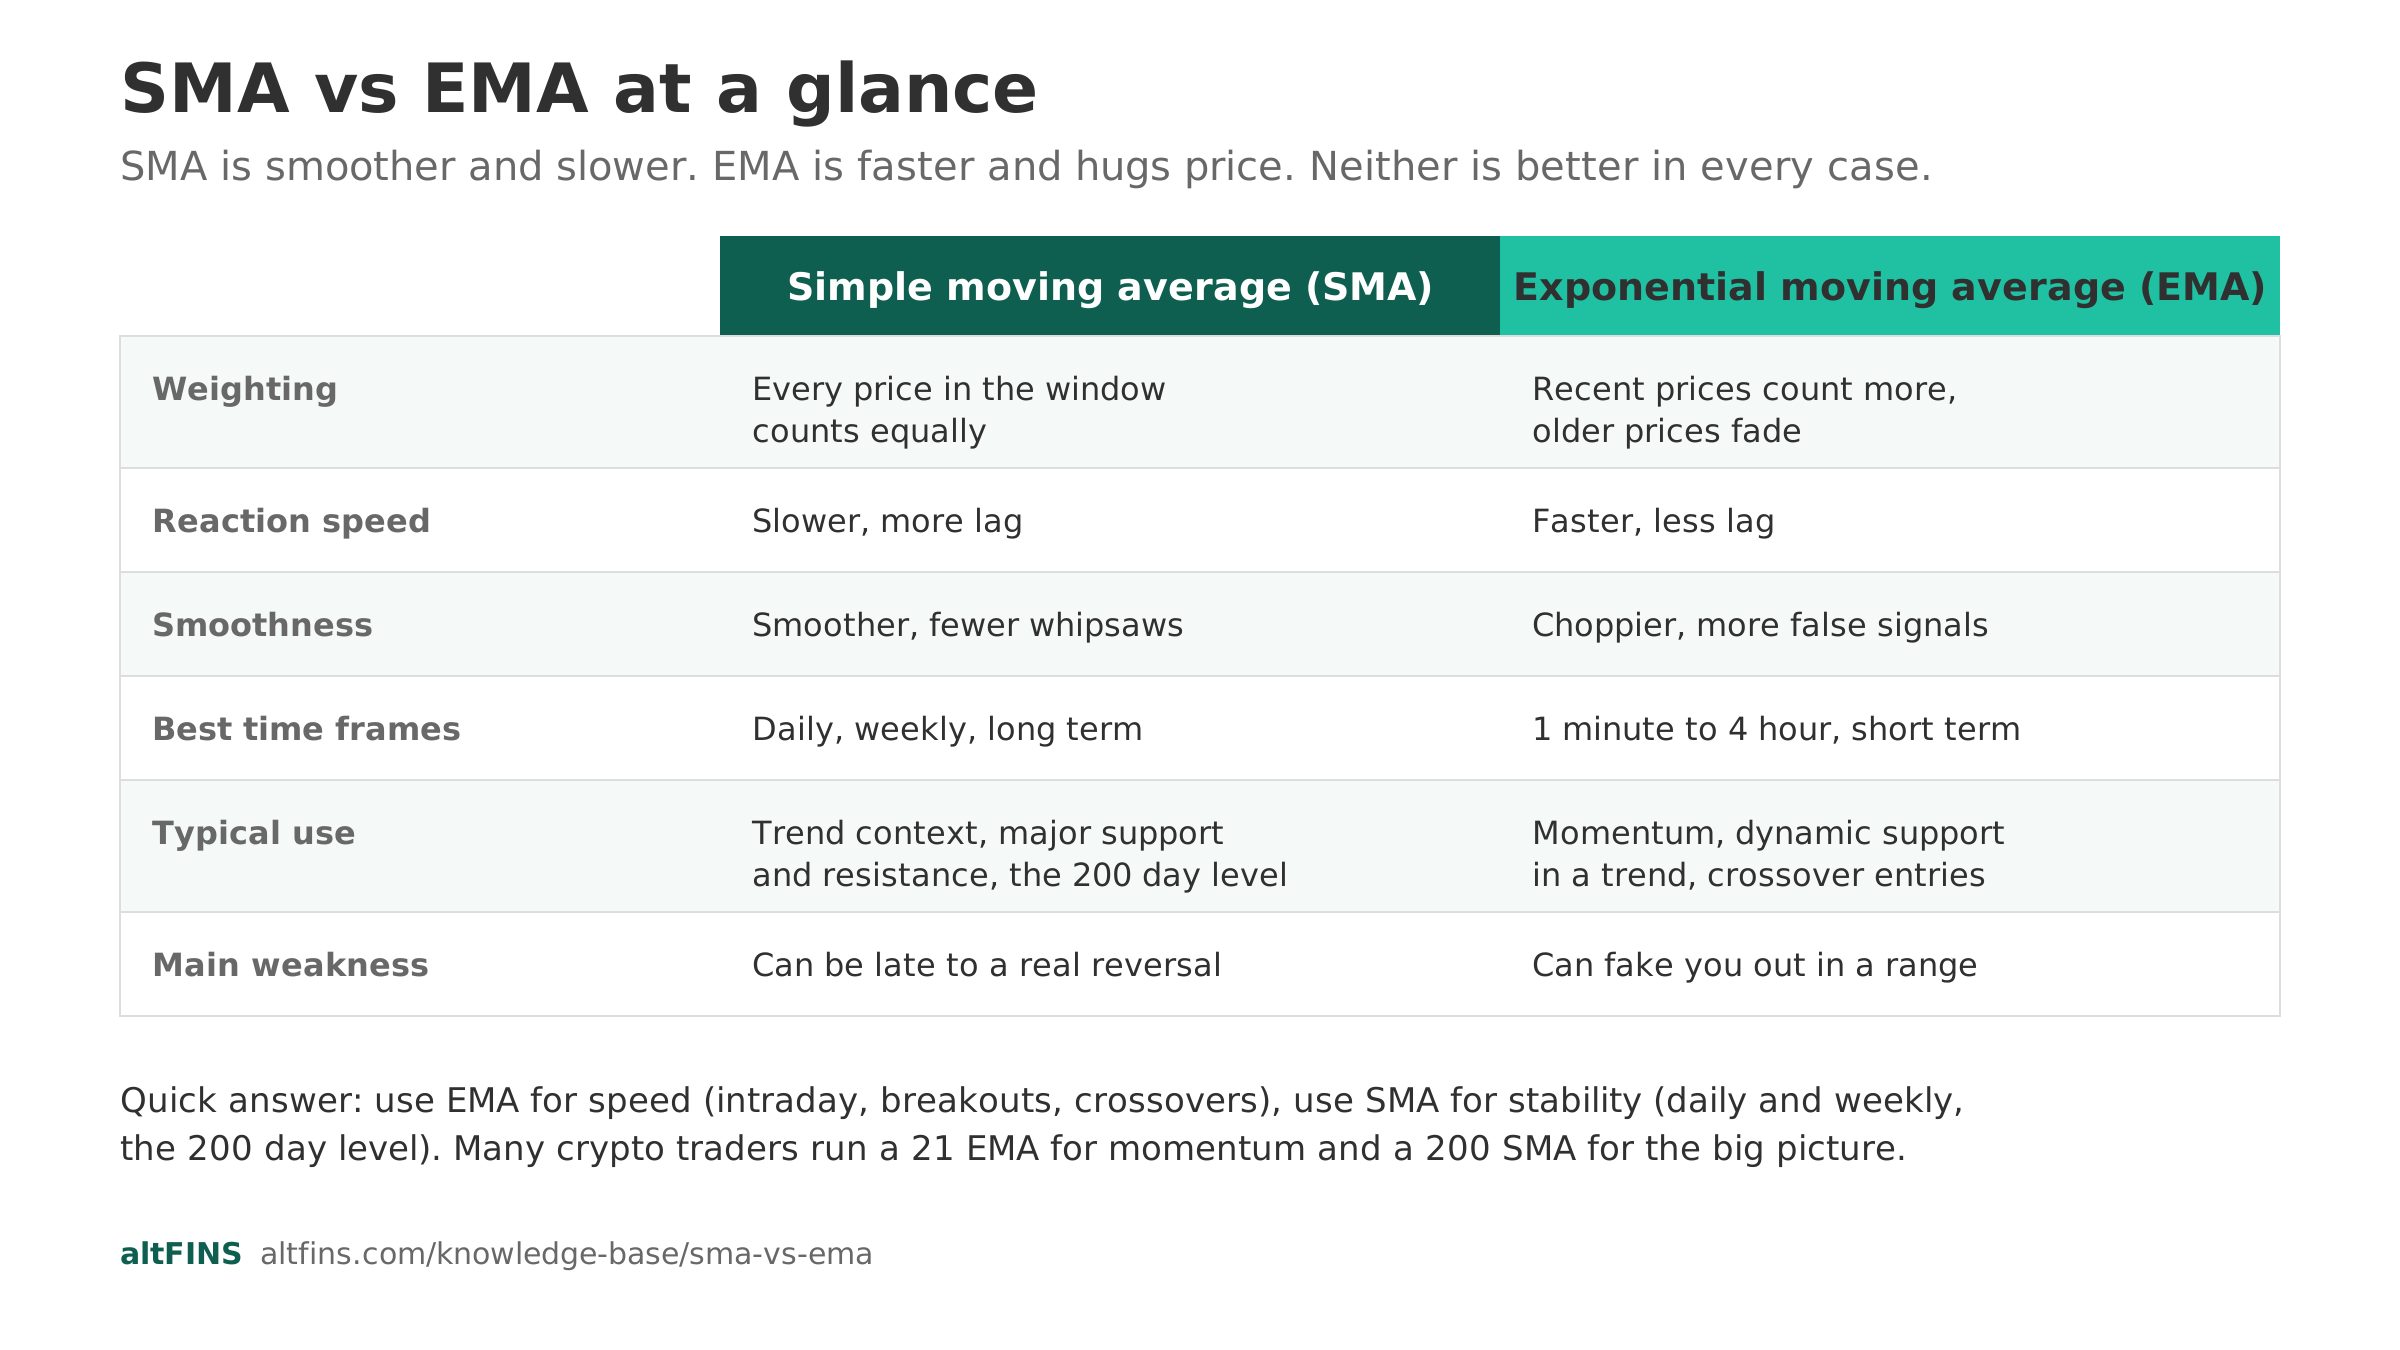
SMA vs EMA at a glance
| Factor | Simple moving average (SMA) | Exponential moving average (EMA) |
|---|---|---|
| Weighting | Every price in the window counts equally | Recent prices count more, older prices fade |
| Reaction speed | Slower, more lag | Faster, less lag |
| Smoothness | Smoother line, fewer whipsaws | Choppier line, more false signals |
| Best time frames | Daily, weekly, long term | 1 minute to 4 hour, short term |
| Typical use | Trend context, major support and resistance, the 200 day level | Momentum, dynamic support in a trend, crossover entries |
| Main weakness | Can be late to a real reversal | Can fake you out in a choppy range |
What is a simple moving average (SMA)?
A simple moving average is the average closing price over a set number of candles. A 50 day SMA on the daily chart adds up the last 50 daily closes and divides by 50. Each new candle drops the oldest price and adds the newest, so the line “moves” forward one step at a time. The takeaway: an SMA is a plain average that treats a price from 50 candles ago exactly like today’s price.
Because every value carries equal weight, one sharp spike has only a small effect, and the line stays smooth. That makes the SMA good for reading the underlying trend and for marking levels the whole market respects, such as the 200 day moving average.
How SMA is calculated
SMA = (sum of the last N closing prices) divided by N.
Example: if Bitcoin’s last five daily closes were 74,000, 75,000, 77,000, 76,000 and 78,000, the 5 day SMA is 380,000 divided by 5, which is 76,000.
What is an exponential moving average (EMA)?
An exponential moving average is a weighted average that gives the newest candle the most influence and lets older candles fade away smoothly. A 21 EMA still looks back over roughly 21 candles of information, but today’s price might drive close to 10 percent of the line’s value while a price from 20 candles ago barely registers. The takeaway: an EMA reacts to what price is doing now, not to what it did three weeks ago.
That responsiveness is why short term crypto traders lean on EMAs. When a coin breaks out, the EMA follows it up quickly and can act as dynamic support on pullbacks. The cost is more noise: in a sideways market the EMA wobbles and generates more false crossovers than an SMA.
How EMA is calculated
EMA today = (Close today times k) + (EMA yesterday times (1 minus k)), where the smoothing factor k = 2 divided by (N plus 1).
For a 10 period EMA, k = 2 divided by 11, which is about 0.18. So each new close pulls the line about 18 percent of the way toward itself. A shorter EMA has a larger k and reacts faster, a longer EMA has a smaller k and reacts slower. The first EMA value is usually seeded with a simple average.
The core difference: lag vs noise
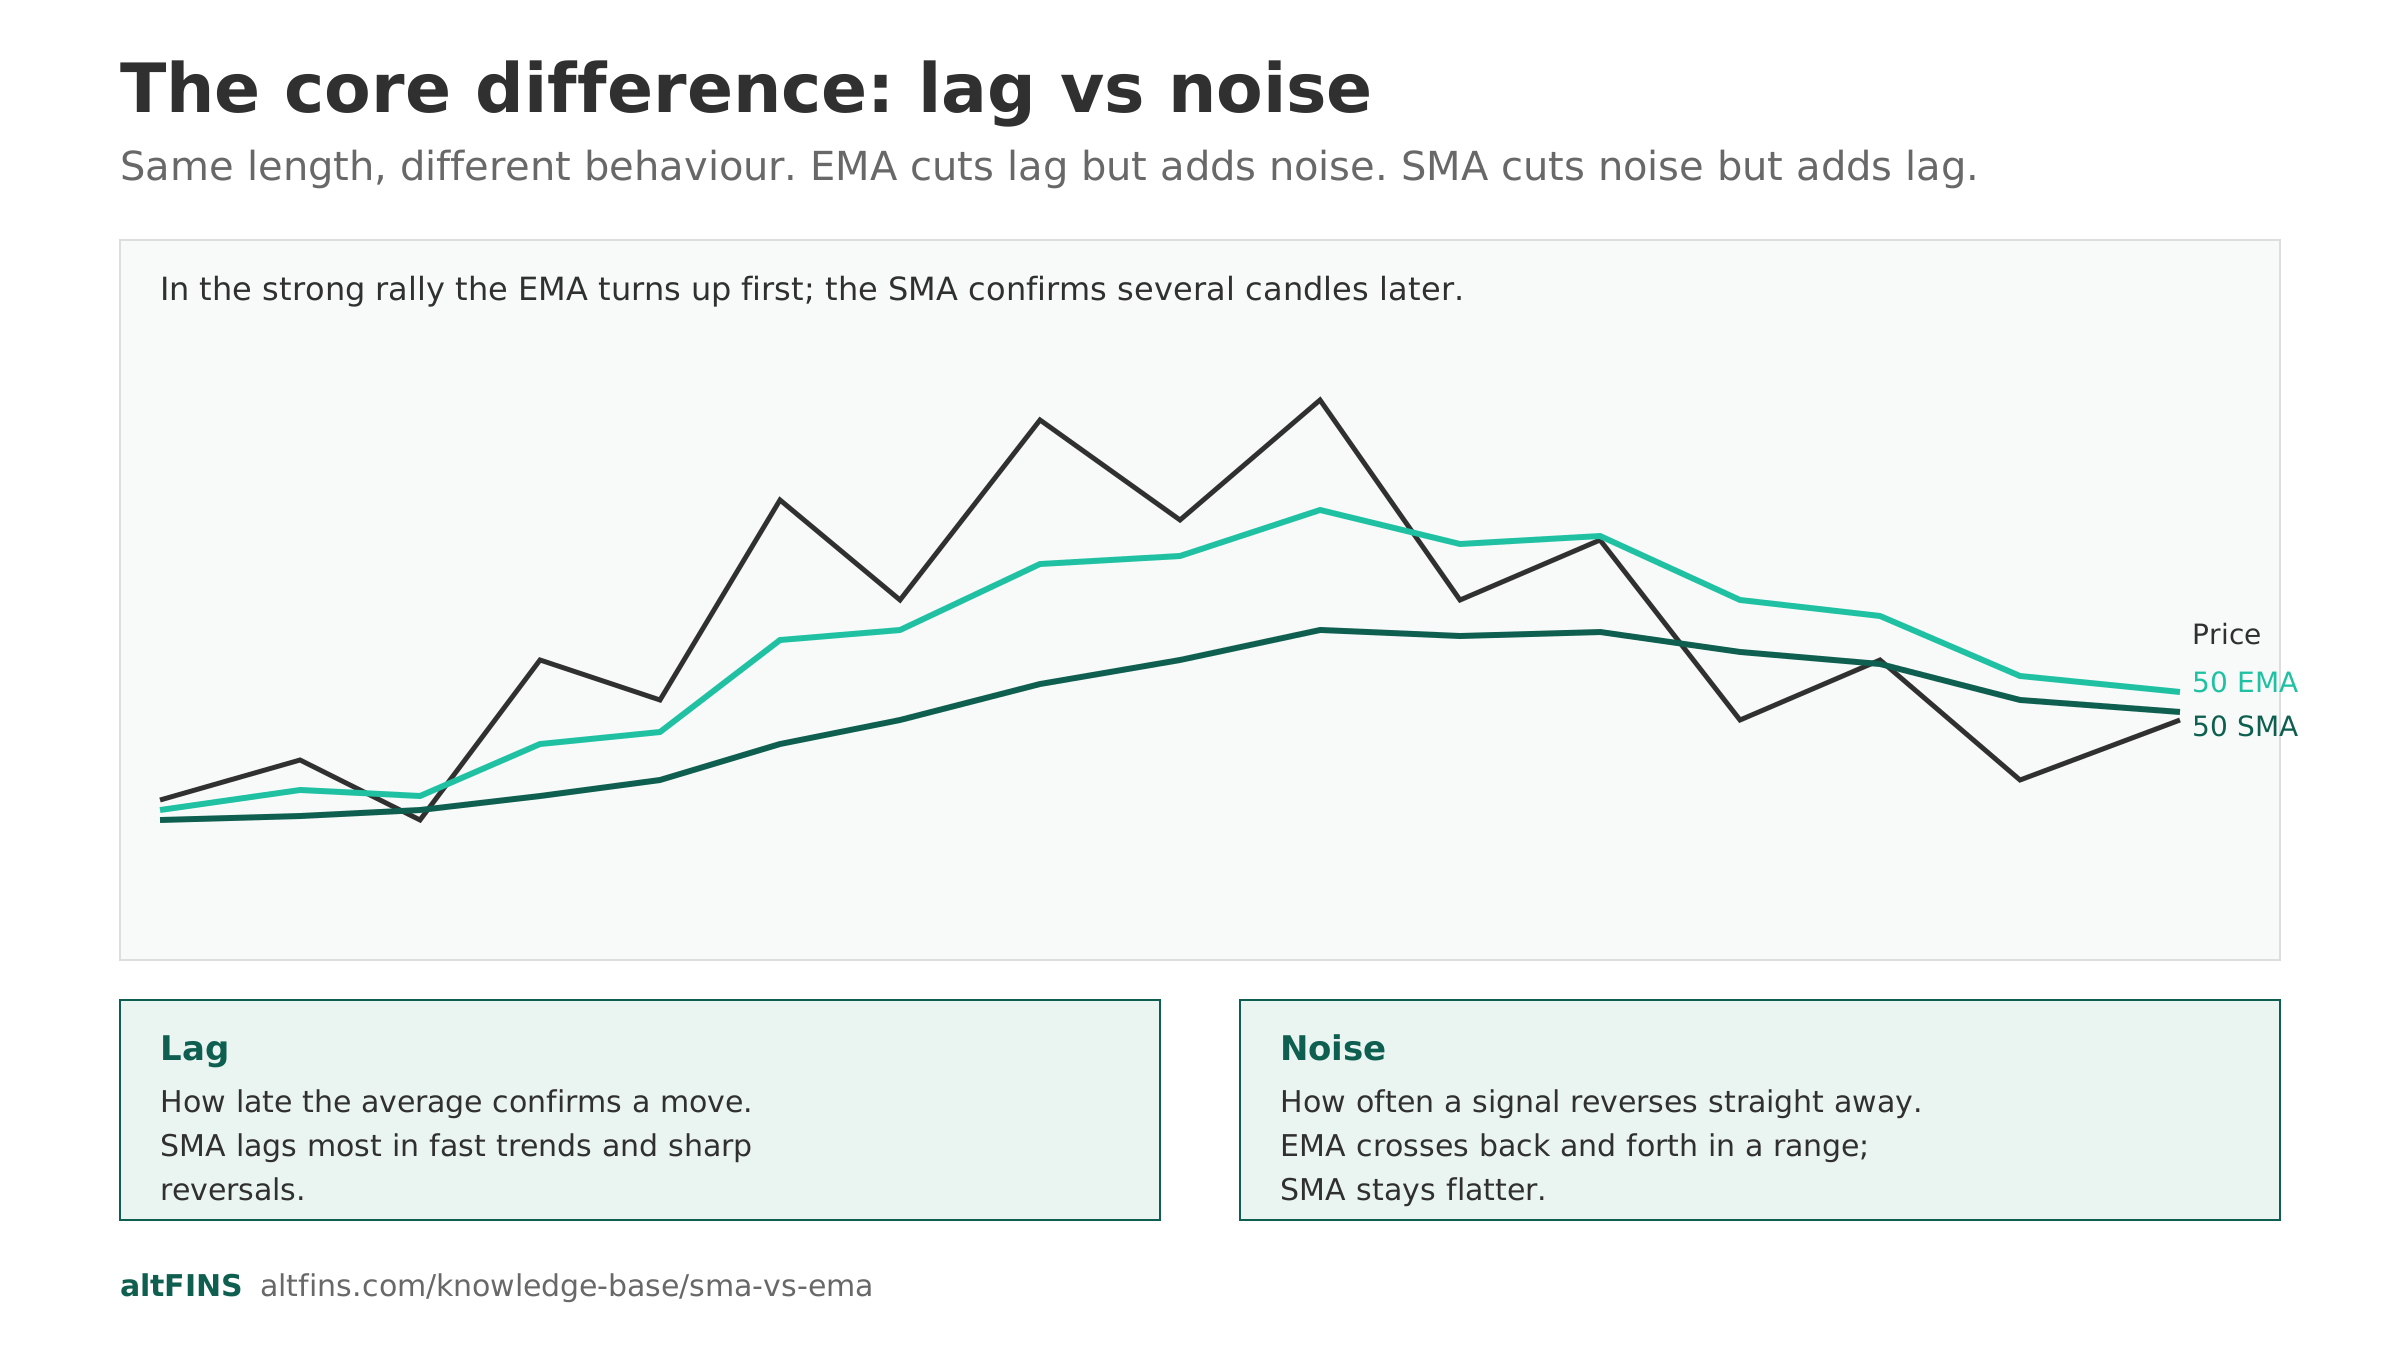
Every moving average is a trade off between lag and noise, and SMA and EMA sit at different points on that trade off. The takeaway: EMA cuts lag but adds noise, SMA cuts noise but adds lag.
- Lag is how late the average confirms a move. In a fast crypto rally the EMA turns up first and the SMA turns up several candles later.
- Noise is how often the average sends a signal that reverses straight away. In a range the EMA crosses back and forth while the SMA stays flatter.
- Same length, different behaviour: a 50 EMA and a 50 SMA drawn on the same chart will separate most during strong trends and sharp reversals, and overlap during quiet periods.
SMA vs EMA: which should crypto traders use?
Match the average to your holding period and to the job you need it to do.
| Trader type | Better fit | Why |
|---|---|---|
| Scalper (1 to 15 minute) | EMA | Needs the earliest possible read on momentum; accepts more false signals |
| Day trader (15 minute to 4 hour) | EMA, with an SMA for context | EMA for entries, a higher time frame SMA to check the wider trend |
| Swing trader (daily) | Either, often SMA for the trend and EMA for timing | Daily noise is lower, so SMA lag is less of a problem |
| Long term investor (weekly) | SMA | The 200 week and 200 day SMA are widely watched reference levels |
When SMA works better
- Reading the primary trend on the daily or weekly chart.
- Marking the 50, 100 and 200 day levels that funds and algorithms react to.
- Filtering out crypto’s frequent single candle spikes and wicks.
- Backtests where you want fewer, cleaner signals.
When EMA works better
- Trading breakouts and strong trends where a few candles of lag costs real money.
- Using the average as trailing or dynamic support, for example price riding the 21 EMA.
- Fast crossover systems such as the 12 and 26 EMA or the 9 and 21 EMA.
- Lower time frames where you need to be early, not right in hindsight.
Common SMA and EMA settings for crypto
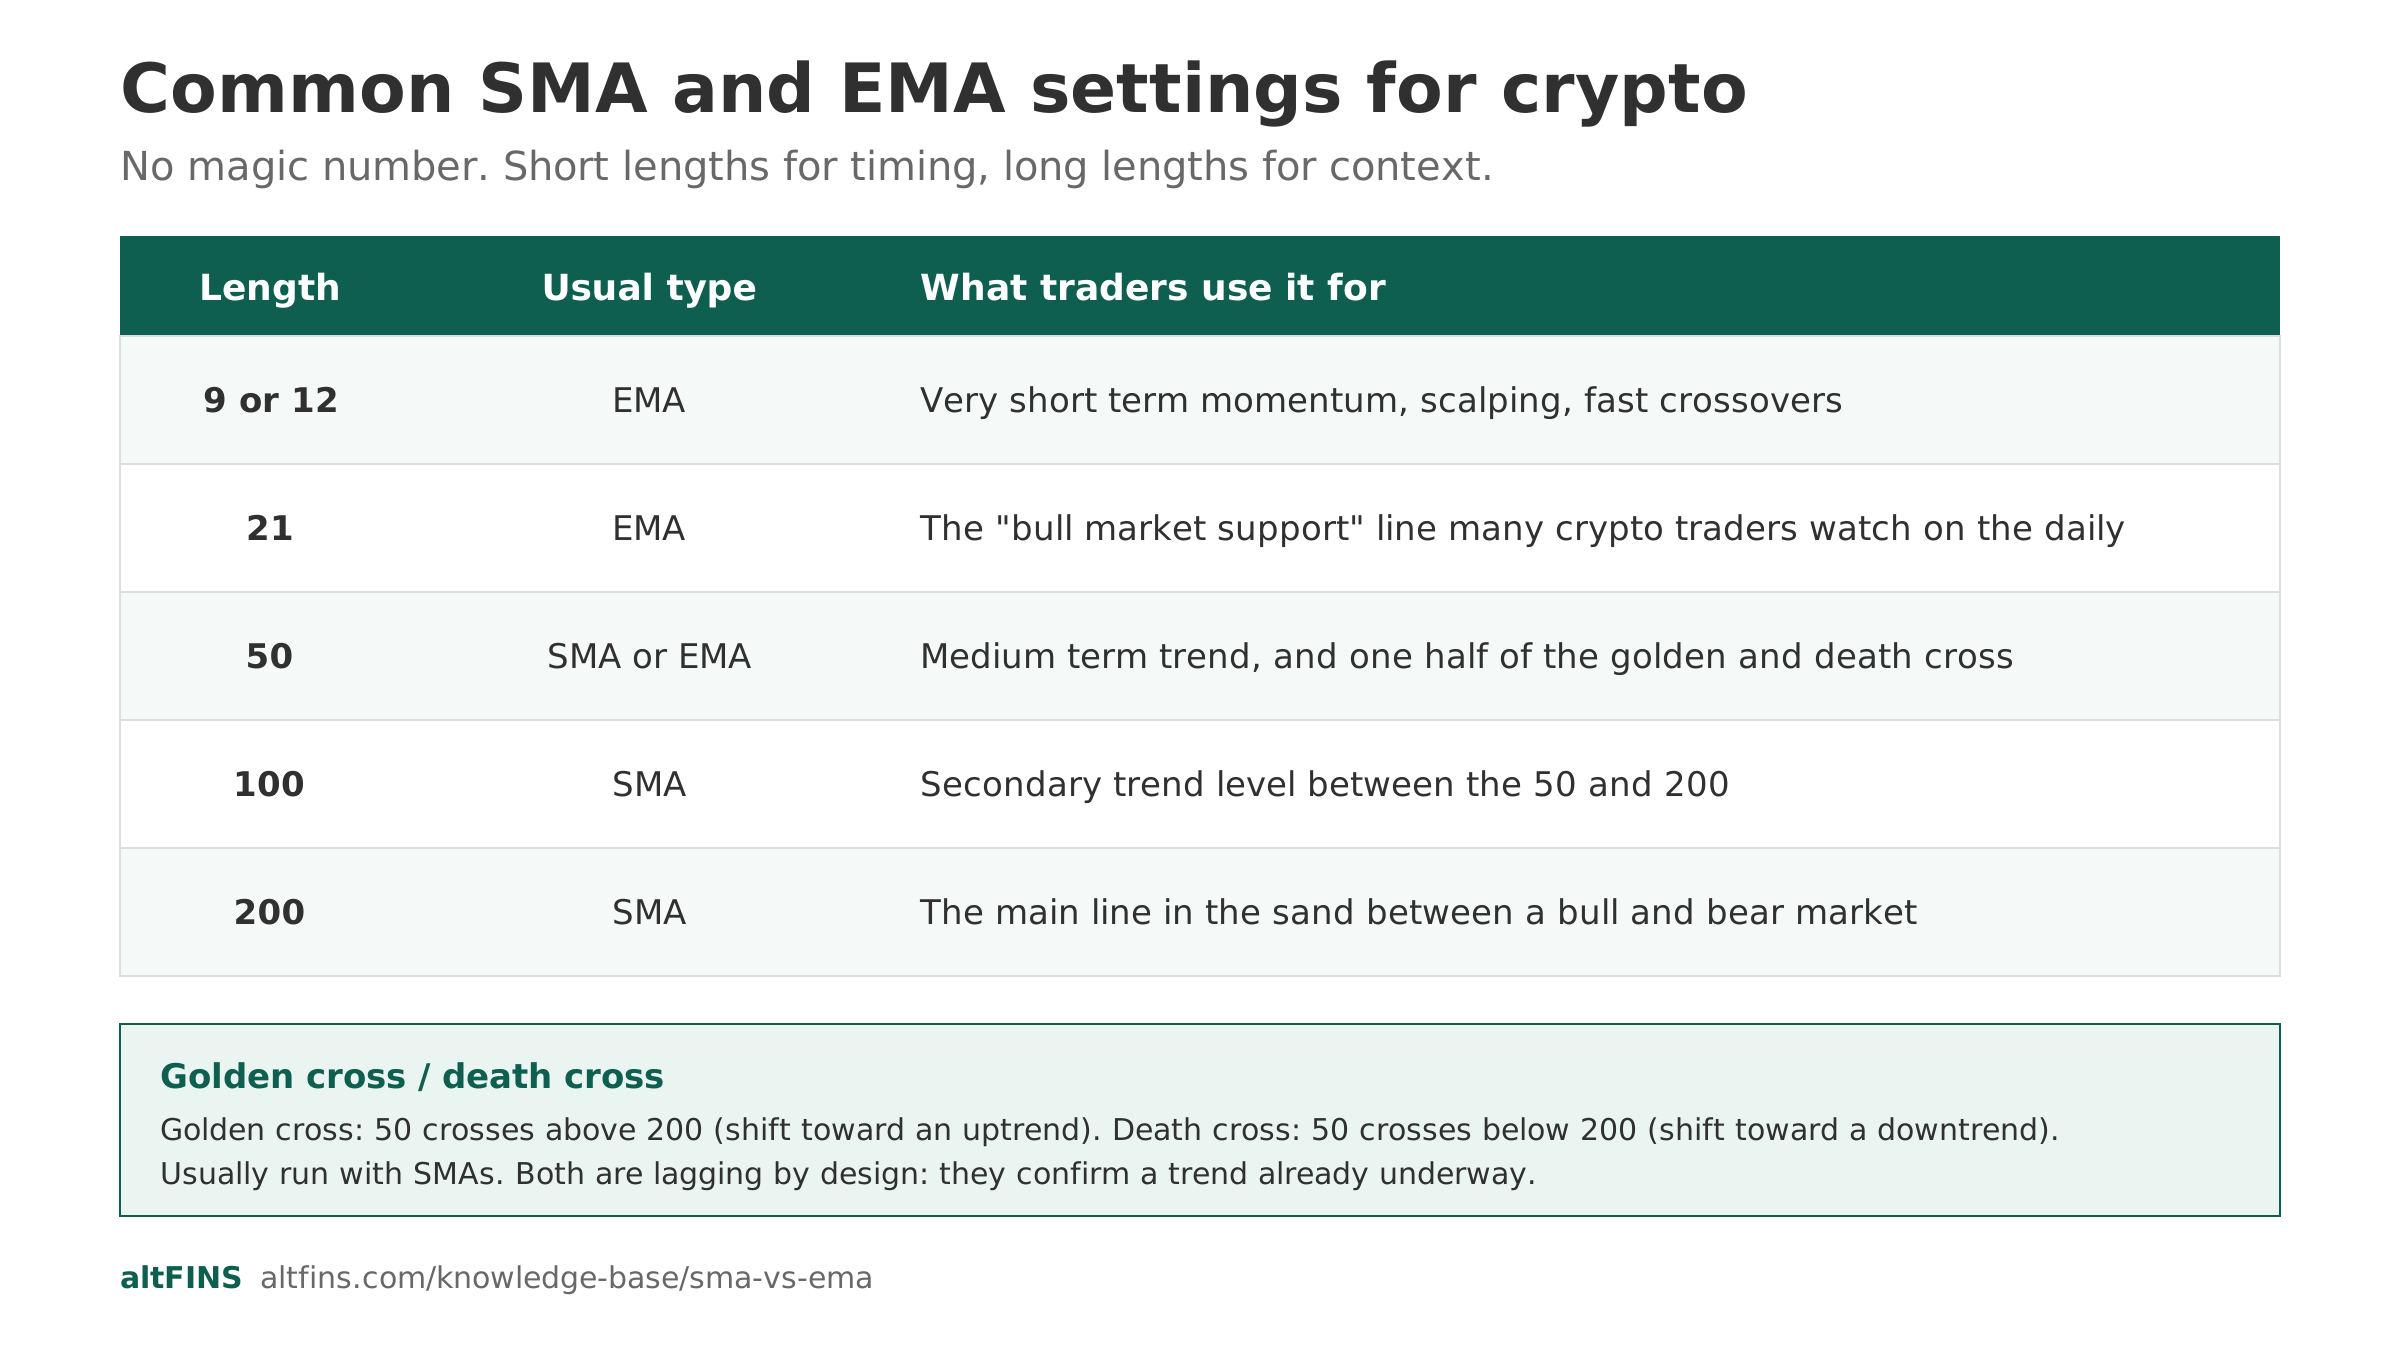
There is no magic number, but these lengths are the ones most crypto traders and charting platforms default to. The takeaway: short lengths for timing, long lengths for context.
| Length | Usual type | What traders use it for |
|---|---|---|
| 9 or 12 | EMA | Very short term momentum, scalping, fast crossovers |
| 21 | EMA | The “bull market support” line many crypto traders watch on the daily |
| 50 | SMA or EMA | Medium term trend, and one half of the golden and death cross |
| 100 | SMA | Secondary trend level between the 50 and 200 |
| 200 | SMA | The main line in the sand between a bull and bear market |
For a deeper look at the widely watched long term level, see the altFINS guide to the 200 day simple moving average, and for stacking several EMAs together see moving average ribbons.
Golden cross and death cross
The best known moving average signal uses two lengths, usually the 50 and the 200.
- Golden cross: the 50 crosses above the 200. Often read as a shift to a longer term uptrend.
- Death cross: the 50 crosses below the 200. Often read as a shift to a longer term downtrend.
Traders usually run this signal with SMAs because the 200 SMA is the market standard, and because on the daily chart the extra EMA speed is not worth the extra false crosses. Both crosses are lagging by design: they confirm a trend that is already underway rather than predict a new one. For shorter term crossover strategies, altFINS covers the EMA 12 and 50 crossover and price to SMA crossovers.
Do’s and don’ts
| Do | Don’t |
|---|---|
| Pick the type based on your time frame and goal | Assume EMA is always better because it is faster |
| Use a moving average with trend structure and volume | Trade a crossover on its own in a sideways market |
| Keep settings consistent so you can judge them over time | Curve fit the length to whatever looks best on past data |
| Combine a fast EMA for timing with a slow SMA for context | Cover the chart with five or more averages at once |
How altFINS helps you use moving averages
altFINS builds SMA and EMA logic into both research and charting so you do not have to eyeball every coin.
- Screen the whole market with the crypto screener for coins trading above or below the 50 and 200 day averages, or for a recent golden cross.
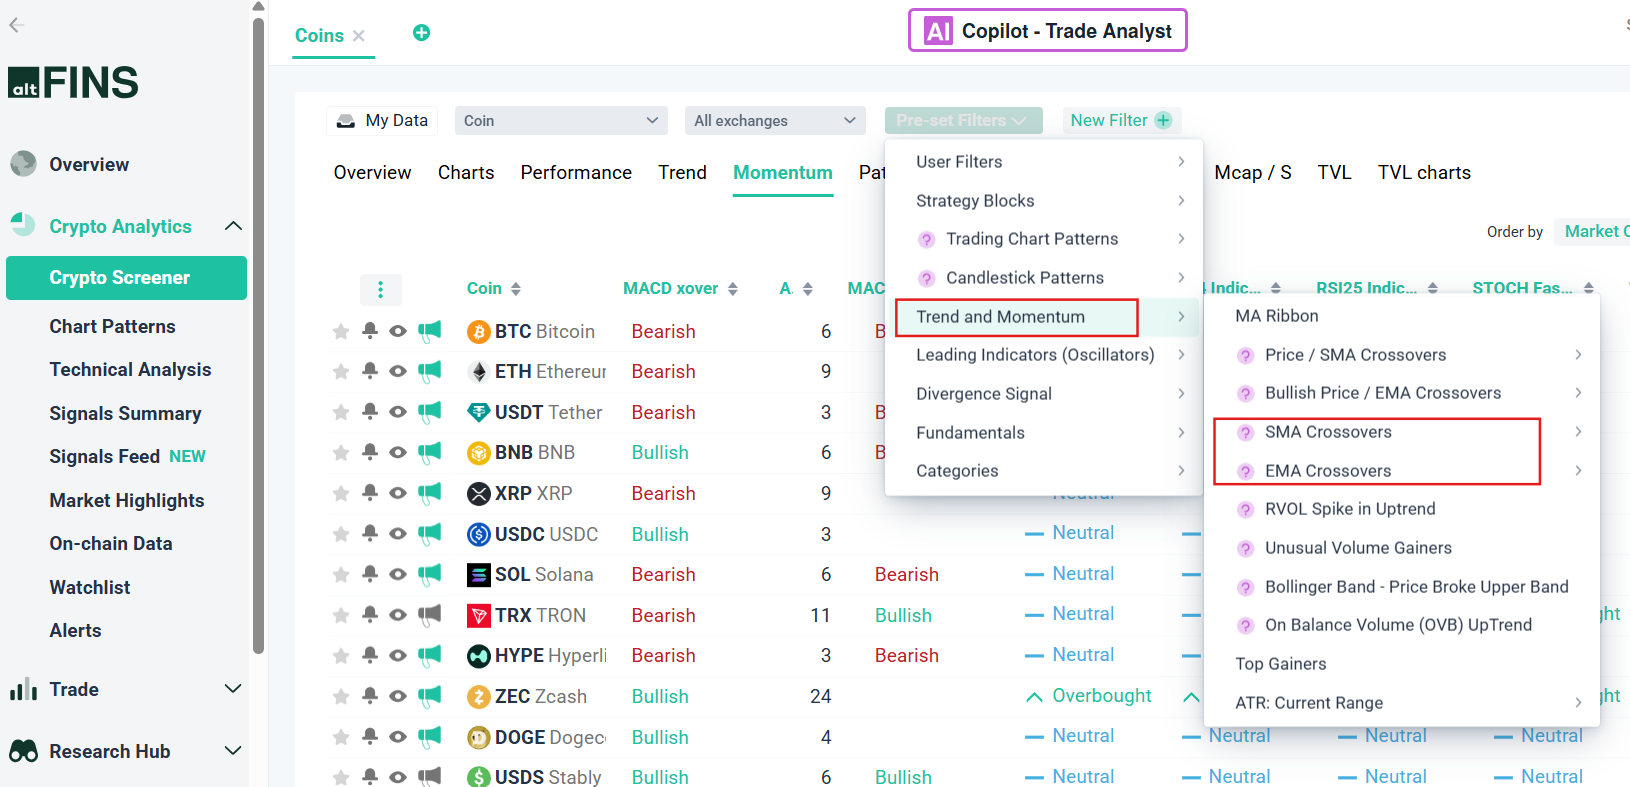
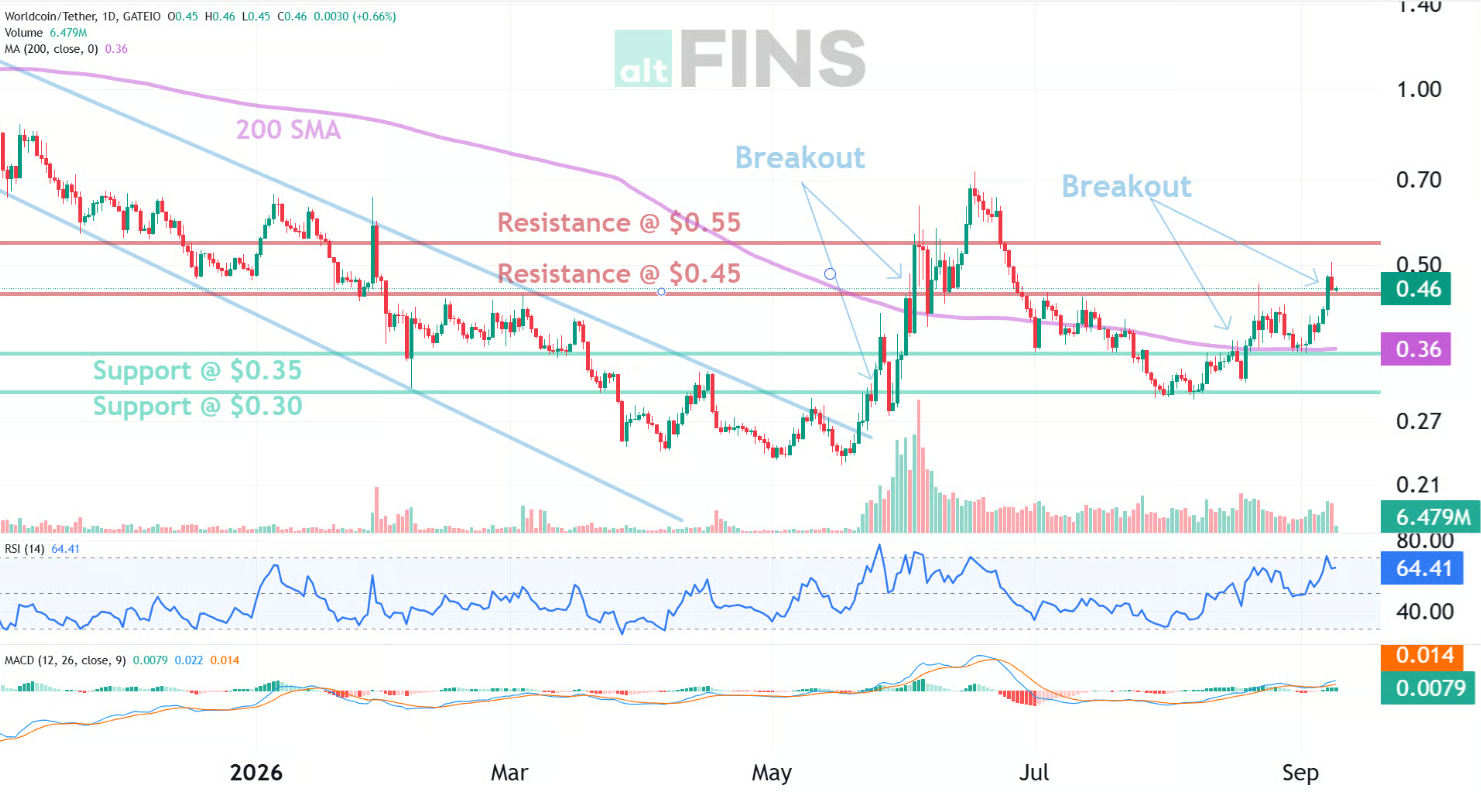
- Add SMAs and EMAs to any chart in the technical analysis view and compare the two on the same coin.
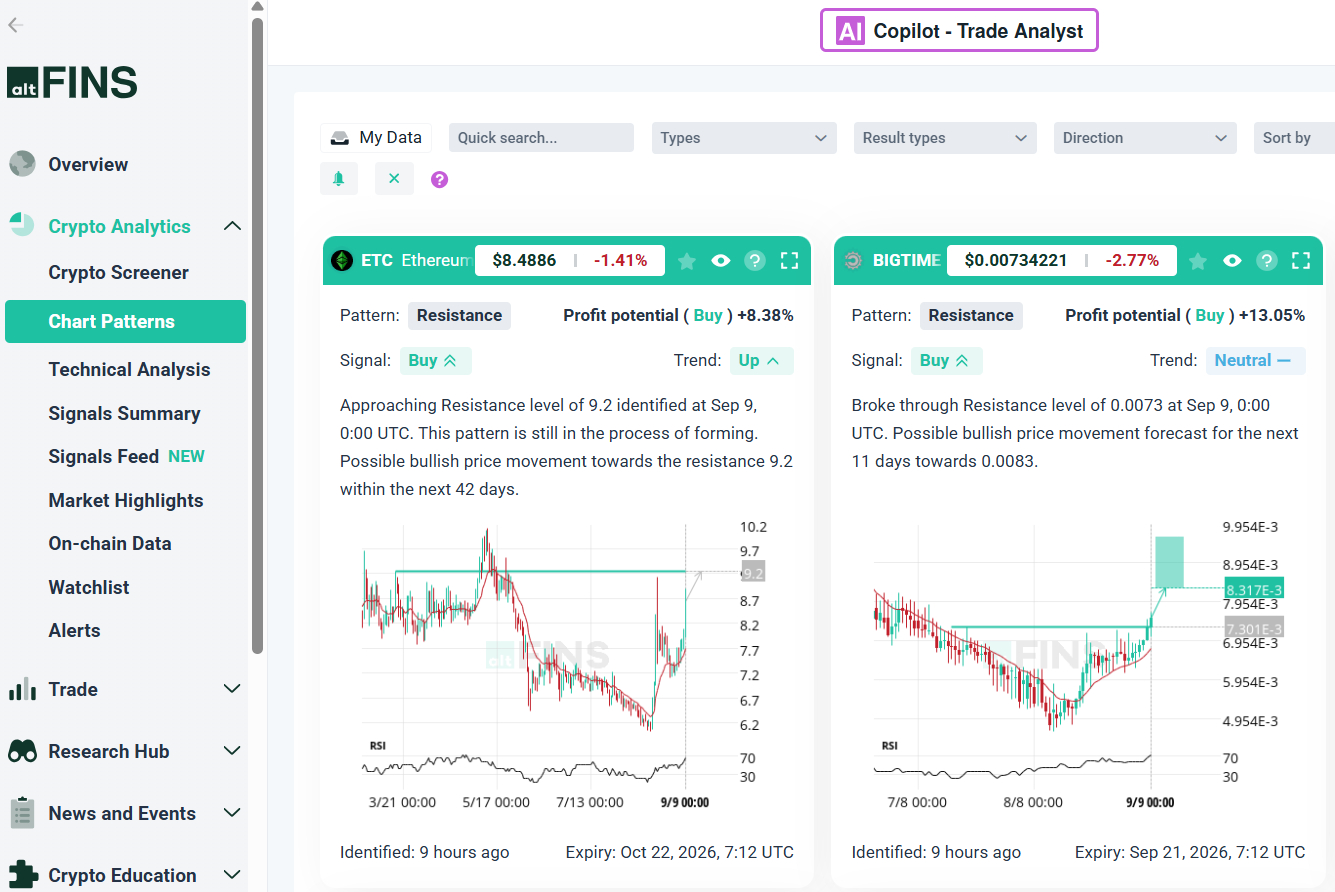
- Combine moving average context with momentum tools like RSI and RSI divergence and with automatically detected chart patterns.
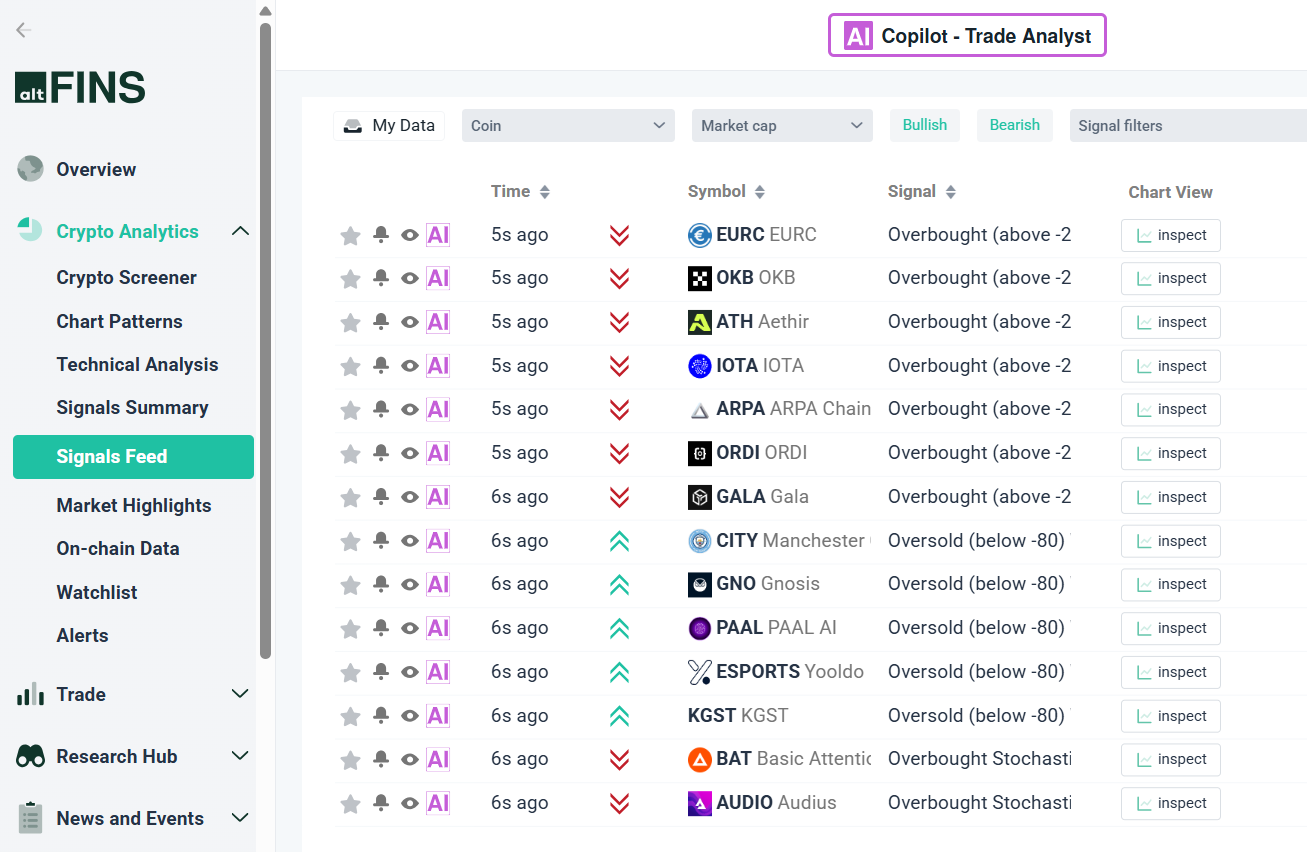
- See how altFINS defines its moving average based buy and sell trading signals.
Frequently asked questions
Is EMA better than SMA?
Not universally. EMA is better when you need speed, such as short term trading and crossover entries, because it reacts to recent prices faster. SMA is better when you need stability, such as long term trend reading and widely watched levels like the 200 day. The right choice depends on your time frame and what you need the average to do.
Which moving average is best for crypto?
For most crypto traders a 21 EMA for momentum plus a 200 SMA for the big picture covers both jobs. Scalpers often use 9 and 21 EMAs, swing traders the 50 and 200. Test a setup on your own market and time frame rather than copying a single number.
What is the difference between SMA and EMA?
An SMA gives every price in its window equal weight, so it is smoother and slower. An EMA gives more weight to recent prices through a smoothing factor, so it turns faster and stays closer to current price. On the same chart with the same length, the EMA leads and the SMA lags.
Do professional traders use SMA or EMA?
Both, and usually together. Shorter term desks favour EMAs for entries and trade management. Longer term and institutional analysis leans on the 50, 100 and 200 day SMAs because those are the reference levels the wider market and many algorithms use.
What EMA is best for day trading crypto?
On 15 minute to 1 hour charts, a 9 EMA and 21 EMA pair is a common day trading choice, sometimes with a 50 EMA as a trend filter and a higher time frame 200 SMA for context. Treat these as starting points to test, not fixed rules.
Why does EMA react faster than SMA?
Because of its weighting. The EMA formula multiplies the latest close by a smoothing factor k = 2 divided by (N plus 1), so recent candles move the line more than old ones. An SMA has no such weighting, so a new price only changes it by 1 over N and old prices keep dragging on it until they drop out of the window.
Verdict
SMA vs EMA is not a contest with one winner. The EMA is the better tool for speed, so it belongs on lower time frames and in crossover and momentum systems. The SMA is the better tool for stability, so it belongs on the daily and weekly charts and on the key 50, 100 and 200 levels. The practical setup for most crypto traders is one fast EMA for timing and one slow SMA for context, read together with trend structure, volume and a momentum indicator rather than in isolation.
Try it now: Open the altFINS crypto screener, filter for coins trading above their 200 day SMA, then add a 21 EMA on the daily chart to time your entries on pullbacks.
This article is for educational purposes only and is not financial, investment or trading advice. Moving averages are lagging indicators and do not predict future prices. Crypto trading carries a high risk of loss. Always do your own research and never trade with money you cannot afford to lose.
