Search Knowledge Base by Keyword
MACD Line and MACD Signal Line
Updated January 2026
he Moving Average Convergence/Divergence (MACD) is one of the most widely used and effective momentum indicators in crypto trading. It helps traders identify when trends are strengthening, weakening, or about to reverse.
MACD combines trend-following and momentum into a single oscillator, offering the best of both worlds for crypto traders.
What Is the MACD Indicator in Crypto?
The MACD measures the difference between two exponential moving averages (EMAs) — typically the 12-day EMA and 26-day EMA.
-
MACD Line = 12-day EMA − 26-day EMA
-
Signal Line = 9-day EMA of the MACD Line
-
Histogram = MACD Line − Signal Line
The MACD fluctuates above and below the zero line as these moving averages converge, cross, and diverge — helping traders visualize shifts in market momentum.
MACD turns two trend-following indicators, moving averages (12 and 26 days), into a momentum oscillator by subtracting the longer moving average from the shorter moving average. As a result, the MACD offers the best of both worlds: trend following and momentum.
MACD fluctuates above and below the zero line as the moving averages converge, cross and diverge.
It calculates the difference between a 12 day and 26 day EMA using closing prices. A 9-day EMA of the MACD Line is plotted with the indicator to act as a Signal Line and identify turns. Also, the difference between MACD Line and Signal Line is called Histogram.
How to trade MACD indicator? To generate signals, crypto traders can look for:
1) Signal line crossovers – most used
2) Slope of MACD histogram – earliest signal, most underrated – be sure to use it!!
3) Divergences – good to spot potential reversals
4) Centerline crossovers – least used (belated)
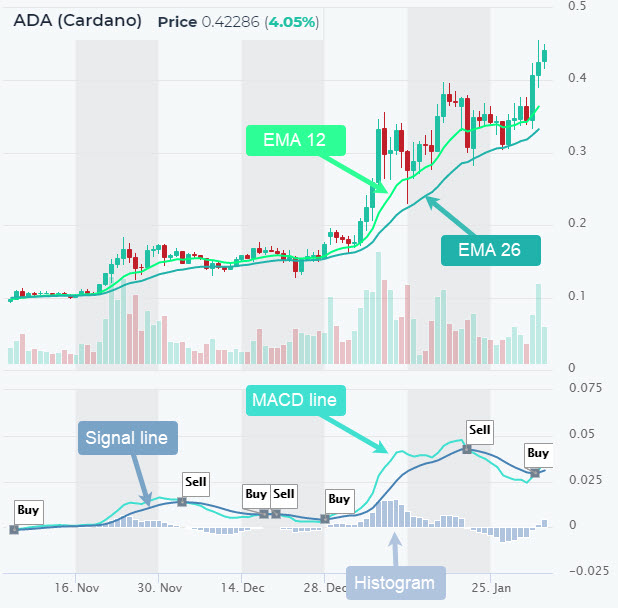
1️⃣ MACD Signal Line Crossovers (Most Used)
The signal line is a 9-day EMA of the MACD Line. It smooths the indicator and helps spot turning points.
-
Bullish crossover: MACD Line turns up and crosses above the signal line → potential buy signal.
-
Bearish crossover: MACD Line turns down and crosses below the signal line → potential sell signal.
For example, when the MACD line crosses above the signal line on ADA (Cardano), altFINS marks it as a Buy flag, and vice versa for Sell.
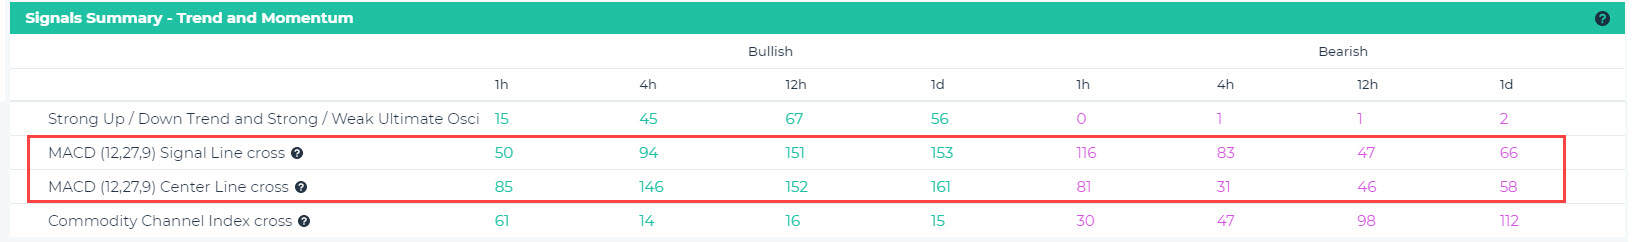
👉 You can easily find cryptocurrencies with bullish or bearish MACD crossovers on the altFINS Signal Summary page.
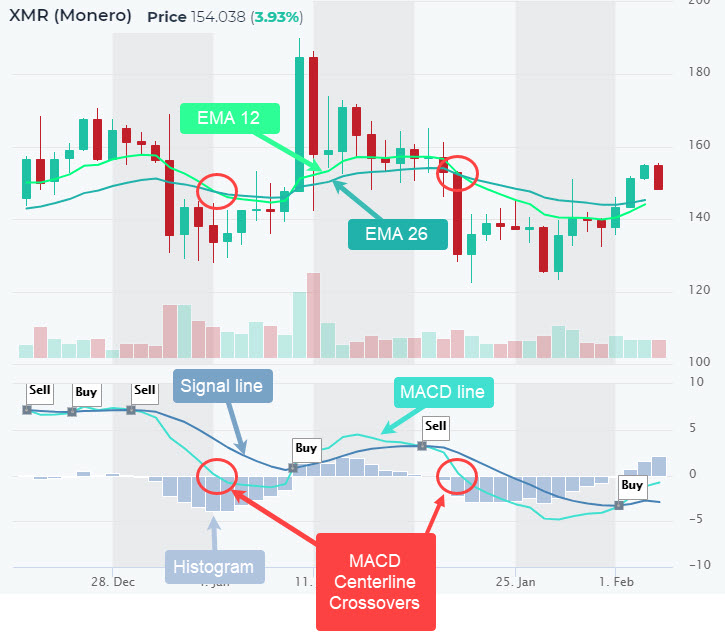
2️⃣ MACD Centerline Crossovers (Least Used, Lagging)
When the MACD crosses above zero, it suggests an uptrend. When it crosses below zero, it signals a downtrend.
-
MACD > 0 → Uptrend / Buy bias
-
MACD < 0 → Downtrend / Sell bias
Centerline crossovers occur when the 12-day EMA crosses the 26-day EMA. While this method helps identify trend direction, it lags compared to signal line crossovers, making it less useful for timing trades.
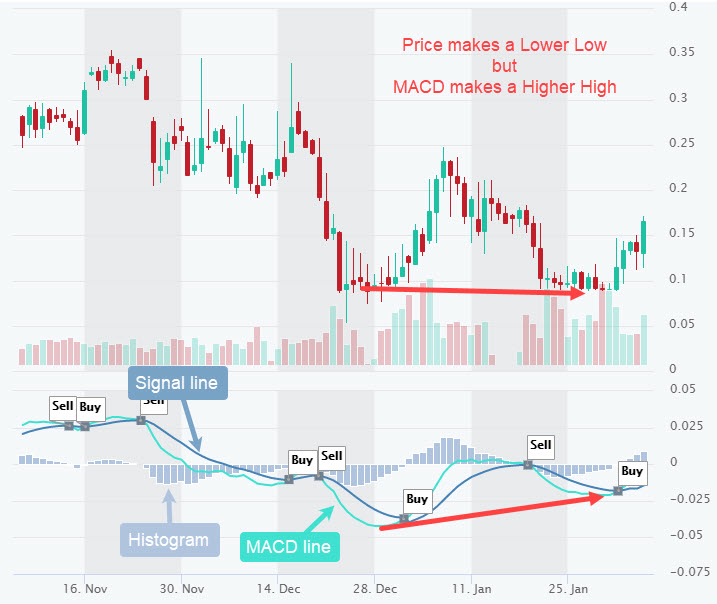
3️⃣ MACD Divergences (Spotting Reversals)
Divergences occur when the MACD trend differs from the price trend — a powerful clue that momentum is shifting.
-
Bullish divergence: Price makes a lower low, but MACD makes a higher low → selling pressure is fading.
-
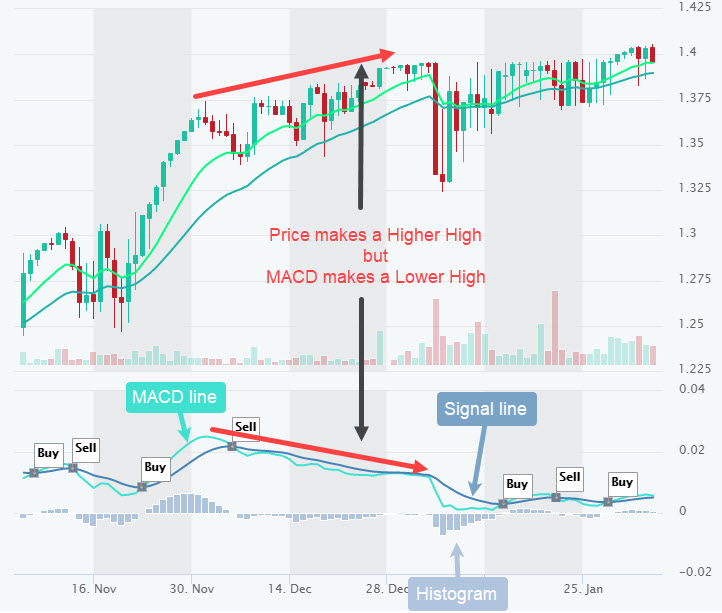
Bearish divergence: Price makes a higher high, but MACD makes a lower high → buying momentum is weakening.
Spotting divergences manually can be time-consuming, but altFINS simplifies this by allowing you to view up to 24 charts in one grid.
Just open the Screener → Charts tab → Show 6, 12, or 24 charts per page.
Bullish MACD Divergence
Bearish MACD Divergence
4️⃣ Slope of MACD Histogram (Earliest Signal)
This is one of the most underrated MACD techniques and often gives earlier trade signals than crossovers.
The MACD Histogram shows the difference between the MACD Line and the Signal Line.
When the histogram peaks and starts to decline — it’s a potential sell signal.
When it bottoms and begins to rise — it’s a potential buy signal.
📺 Watch the video tutorial on how to detect early MACD momentum shifts to learn this technique.
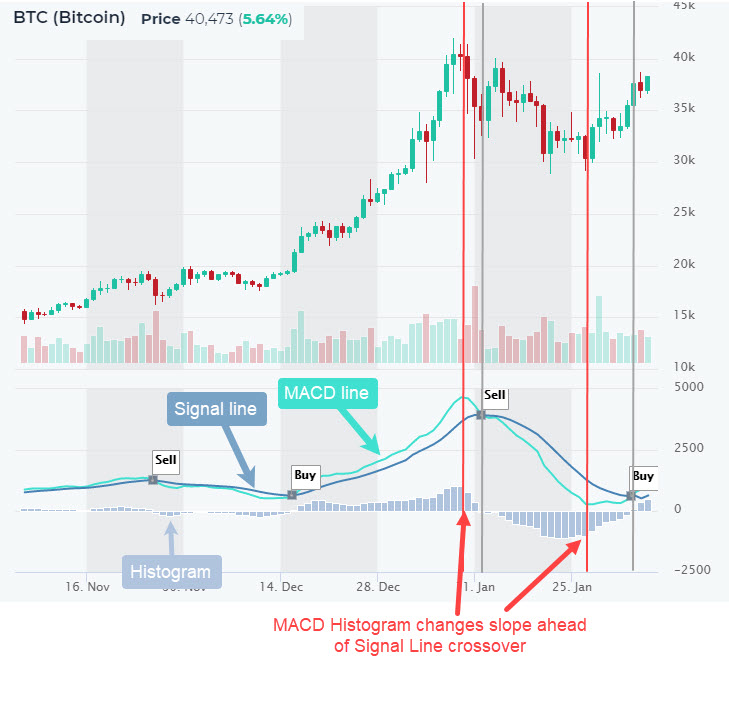
Traders can use MACD Histogram to help anticipate such signals. Recall that a Signal Line crossover happens when a MACD Line crosses over a Signal Line (see “buy” and “sell” flags in Bitcoin chart below). The difference between MACD Line and Signal Line is captured by MACD Histogram bars. In essence, MACD Histogram is an indicator of indicators, and it is a step ahead of Signal Line crossover!
When the slope of the MACD Histogram changes, traders should take notice. When MACD Histogram peaks and begins to decline (blue bars), that’s a potential sell signal to a trader and it would occur sooner than the “Sell” Signal Line crossover (see Bitcoin chart below). And when MACD Histogram troughs and begins to rise (blue bars), that’s a potential buy signal.
In the Bitcoin chart below, notice how the change in the slope (red vertical lines) would give traders an earlier trade signal than a MACD Signal Line crossover (grey vertical lines).
That slight difference in timing could make a huge difference in profits! Try to implement MACD Histogram in your crypto trading strategy.
MACD (12,27,9) Signal Line cross
MACD Signal line is the 9-day EMA of the MACD indicator and is used to identify turns. Signal line crossovers are the most common MACD signals. A bullish crossover occurs when the MACD turns up and crosses above the signal line. A bearish crossover occurs when the MACD turns down and crosses below the signal line.
MACD is a trend following and momentum indicator, calculated by subtracting a longer moving average (26 day EMA) from a shorter moving average (12 day EMA). MACD fluctuates above and below the zero line as the moving averages converge, cross and diverge. A 9-day EMA of the MACD Line is plotted with the indicator to act as a signal line and identify turns. Traders can look for signal line crossovers, centerline crossovers and divergences to generate crypto signals. Potential buy signals occur when the MACD moves above zero (center line) or above the signal line, and potential sell signals when it crosses below zero or below the signal line.
MACD (12,27,9) Center Line cross
Centerline crossovers – MACD above zero for a sustained period of time indicates an uptrend, and below zero, a downtrend. Potential buy signals occur when the MACD moves above zero, and potential sell signals when it crosses below zero.
MACD is a trend following and momentum indicator, calculated by subtracting a longer moving average (26 day EMA) from a shorter moving average (12 day EMA). MACD fluctuates above and below the zero line as the moving averages converge, cross and diverge. A 9-day EMA of the MACD Line is plotted with the indicator to act as a signal line and identify turns. Traders can look for signal line crossovers, centerline crossovers and divergences to generate crypto signals. Potential buy signals occur when the MACD moves above zero (center line) or above the signal line, and potential sell signals when it crosses below zero or below the signal line.
FAQ
