Search Knowledge Base by Keyword
How To Trade Inverse Head and Shoulders pattern? | Crypto Chart Pattern
TL;DR — Inverse Head & Shoulders (Crypto Trading)
A highly reliable bullish reversal pattern that appears after a downtrend
Consists of three lows: left shoulder, deeper head, higher right shoulder
Breakout above the neckline + volume spike = confirmation
Typical trade plan:
- Entry: Breakout (or neckline retest)
- Stop-loss: Below right shoulder or neckline
- Target: Distance from head to neckline, projected upward
- Rare but powerful — altFINS backtests show ~86% hit rate
- Especially useful in volatile crypto markets to spot early trend reversals
- altFINS automatically detects Inverse Head & Shoulders across multiple timeframes and sends alerts
What Is Inverse Head & Shoulders Patterns
The Inverse Head and Shoulders is one of the most powerful and reliable bullish reversal chart patterns in crypto trading. It forms after a prolonged downtrend and signals a potential shift in market sentiment from bearish to bullish. When this pattern appears, it often marks the beginning of a trend reversal where buyers regain control and confidently push prices higher.
While the pattern is relatively rare, especially on higher timeframes, its reliability makes it one of the most anticipated setups among technical traders. In fact, according to altFINS’ historical backtests, the Inverse Head and Shoulders pattern achieves an impressive 86% hit rate, outperforming many other popular chart patterns. Because of this high success rate and strong predictive power, traders often view it as one of the most trustworthy signals for timing long entries and spotting early trend reversals.
What makes this pattern especially valuable in crypto is its ability to cut through noise and identify genuine trend shifts in a highly volatile market. Whether you’re analyzing Bitcoin, Ethereum, or smaller altcoins, an Inverse Head and Shoulders breakout — especially supported by volume — can provide a high-probability setup with a clearly defined entry, stop-loss, and price target.
Below, we break down exactly how the pattern forms, why it works, and how traders use altFINS’ automated chart pattern detection to identify Inverse Head and Shoulders setups in real time.
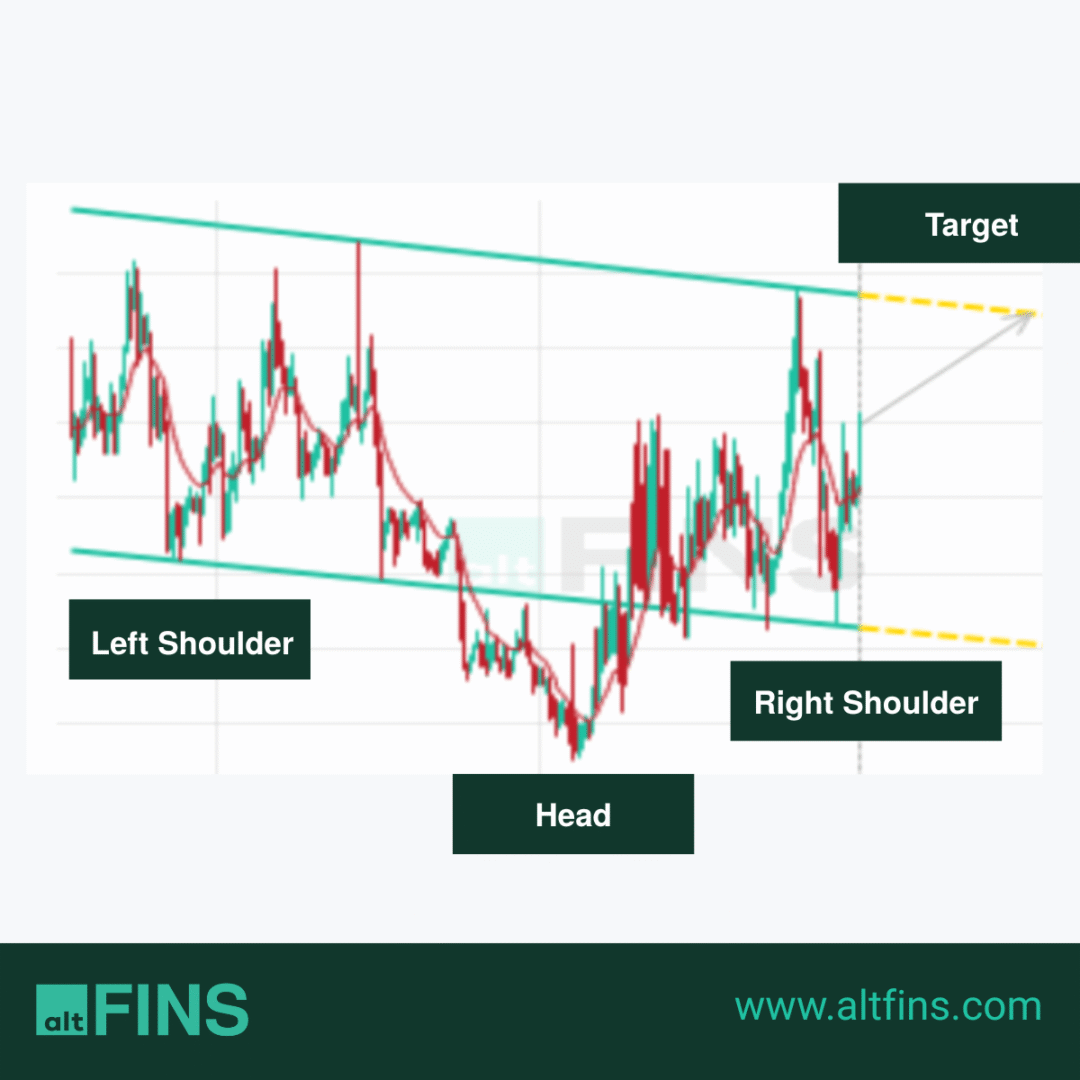
What Is an Inverse Head and Shoulders Pattern?
The pattern is formed by three troughs (lows):
-
Left Shoulder: Price drops and then rallies.
-
Head: A deeper decline forms a lower trough.
-
Right Shoulder: Another decline, but higher than the head, showing weakening selling pressure.
A neckline connects the highs of the two shoulders. When price breaks above the neckline with volume, the pattern is confirmed, and traders expect a bullish reversal.
The breakout above the neckline often signals the beginning of a new uptrend, and the potential upward move is estimated by measuring the distance from the head to the neckline and projecting it upward. Explore live Inverse Head and Shoulder Patterns on altFINS.
Inverse Head and Shoulders Pattern: STG Example
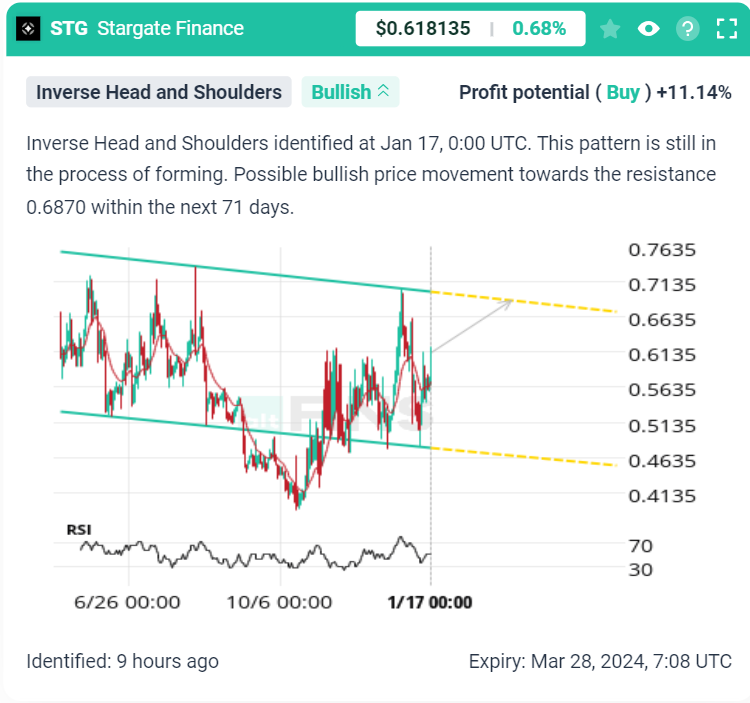
Technical Characteristics
-
Trend Reversal: Appears after a downtrend and signals a potential bullish reversal.
-
Structure: Three troughs – a lower low (head) between two higher lows (shoulders).
-
Neckline: Key resistance level that confirms the breakout.
-
Volume: Volume typically decreases during formation but should rise significantly on breakout.
-
Target Projection: The expected move after breakout is approximately equal to the vertical distance from the head to the neckline.
-
Pattern Statuses: Traders often track patterns in different stages — Awaiting (pattern forming), Formed (price broke neckline), Target Reached (price achieved projection), Failed (price dropped below right shoulder).
-
Alerts: Patterns can be monitored with notifications for new setups, confirmed breakouts, target reached, or failures.
Step-by-Step: How to Trade It
-
Identify the Pattern
-
Look for a downtrend followed by left shoulder, head, and right shoulder formation.
-
-
Wait for Confirmation
-
Enter long only once price closes above the neckline with strong volume.
-
-
Entry Point
-
Buy on breakout, or wait for a retest of the neckline for a safer entry.
-
-
Stop-Loss Placement
-
Place stop-loss just below the right shoulder or neckline.
-
-
Profit Target
-
Measure distance from head to neckline, then project upward to set target.
-
-
Volume Check
-
Ensure breakout is supported by a clear volume spike.
-
-
Risk Management
-
Never risk more than a fixed % of your capital on one trade.
-
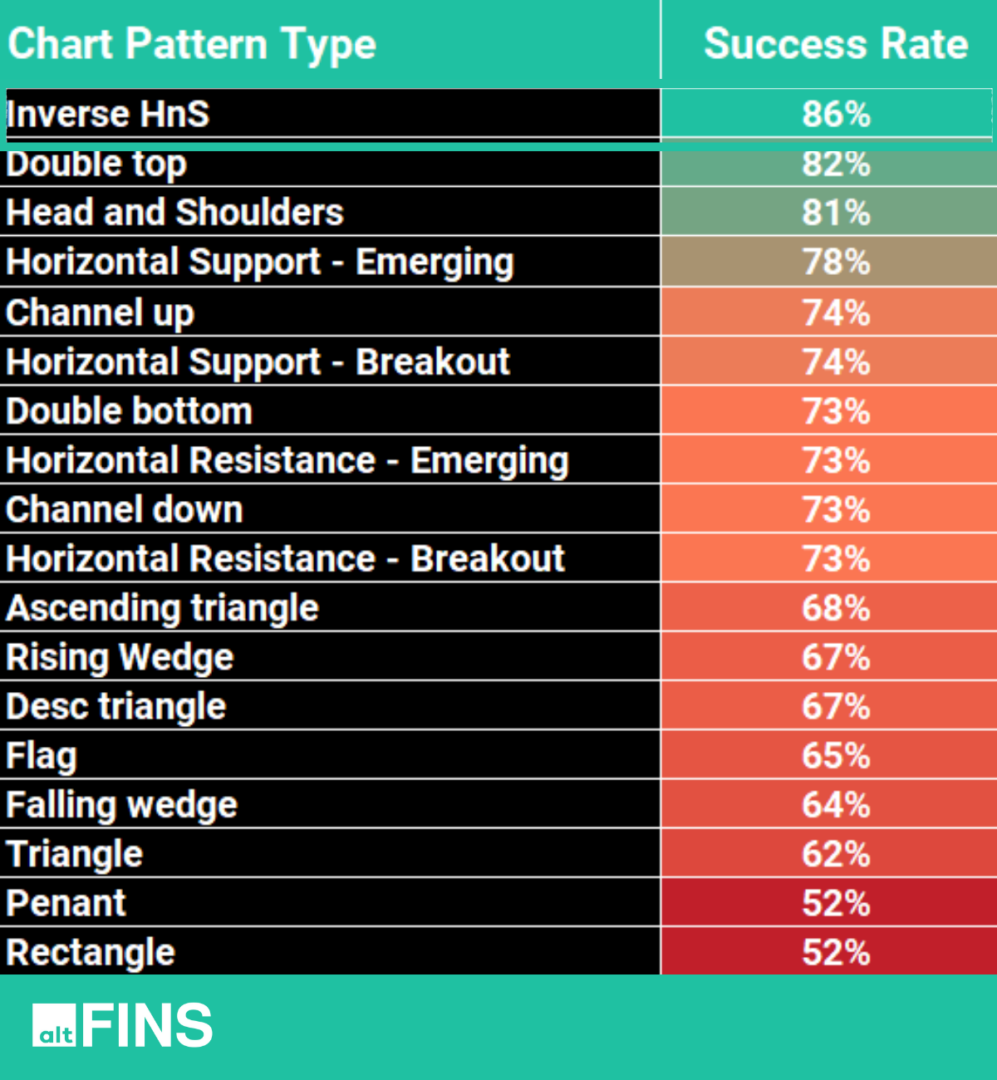
Inverse Head and Shoulders (Bullish) and Head and Shoulders (Bearish) are among patterns with the highest hit rates!
These are also some of the rarest patterns. But they’re well worth waiting for. And waiting is all you need to do because altFINS automatically detects the patterns for you.
Historical backtests conducted on the altFINS platform say that the Inverse Head and Shoulder pattern exhibits an impressive 86%!
According to Investopedia, these are the “Key takeaways:
- An inverse head and shoulders is similar to the standard head and shoulders pattern, but inverted.
- It may be used to predict reversals in downtrends.
- An inverse head and shoulders pattern, upon completion, signals a bull market.
- Investors typically enter into a long position when the price rises above the resistance of the neckline.”
Identify Inverse Head and Shoulders with altFINS
altFINS makes it easy to scan for this pattern automatically:
-
Chart Patterns Section: AI detects 26+ trading patterns across multiple timeframes (15m, 1h, 4h, 1d).
-
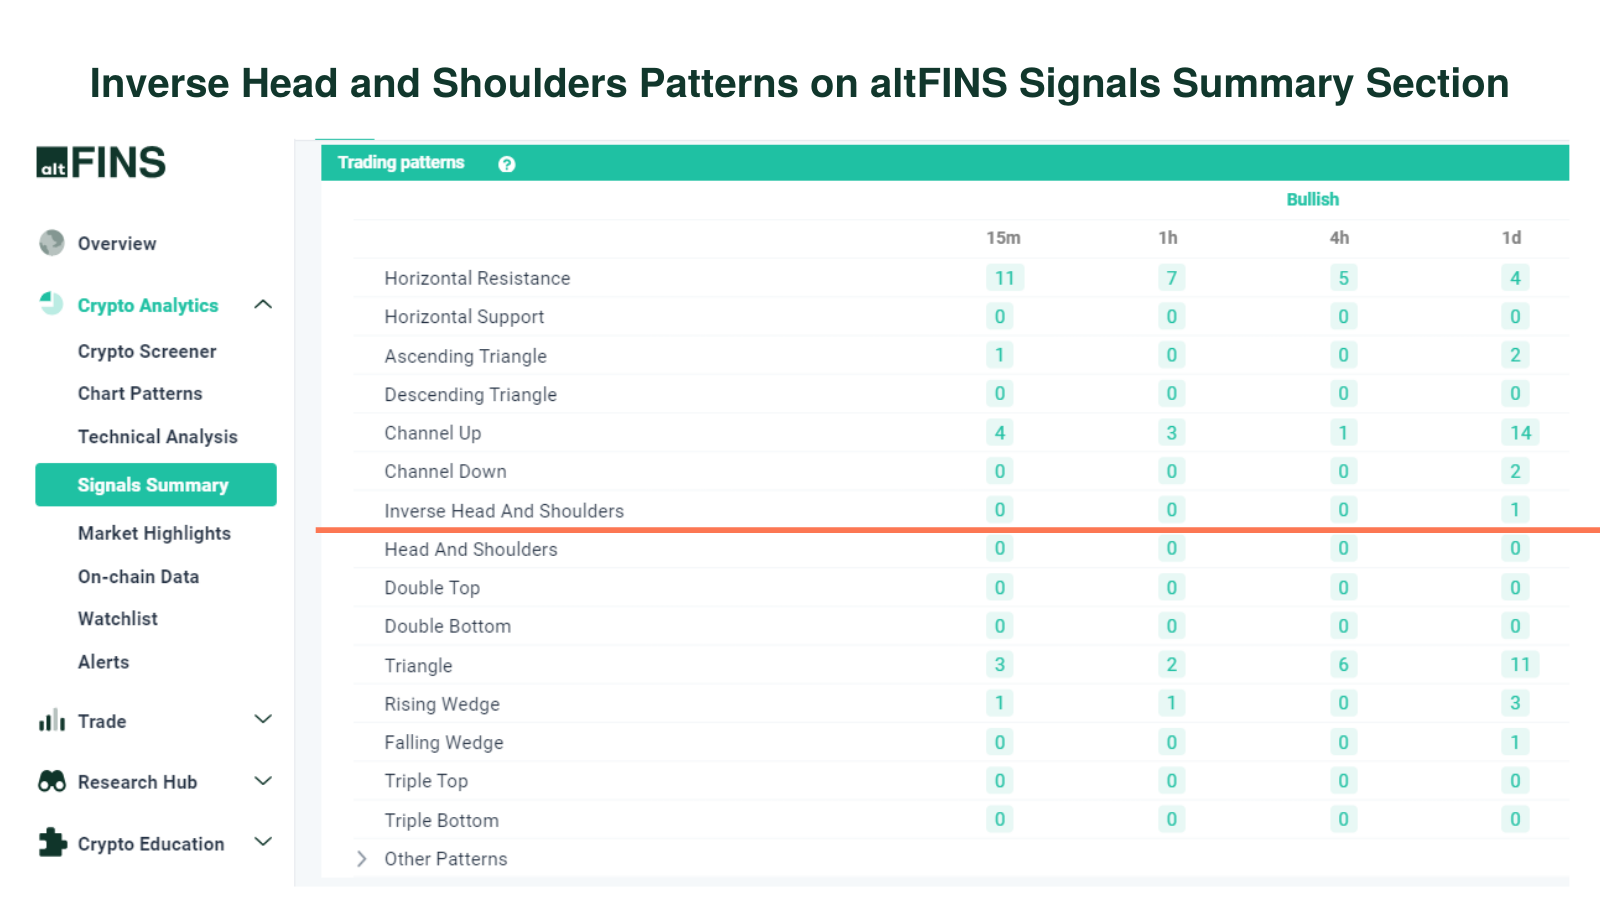
Signals Summary: Shows top trading opportunities including bullish reversal patterns.
-
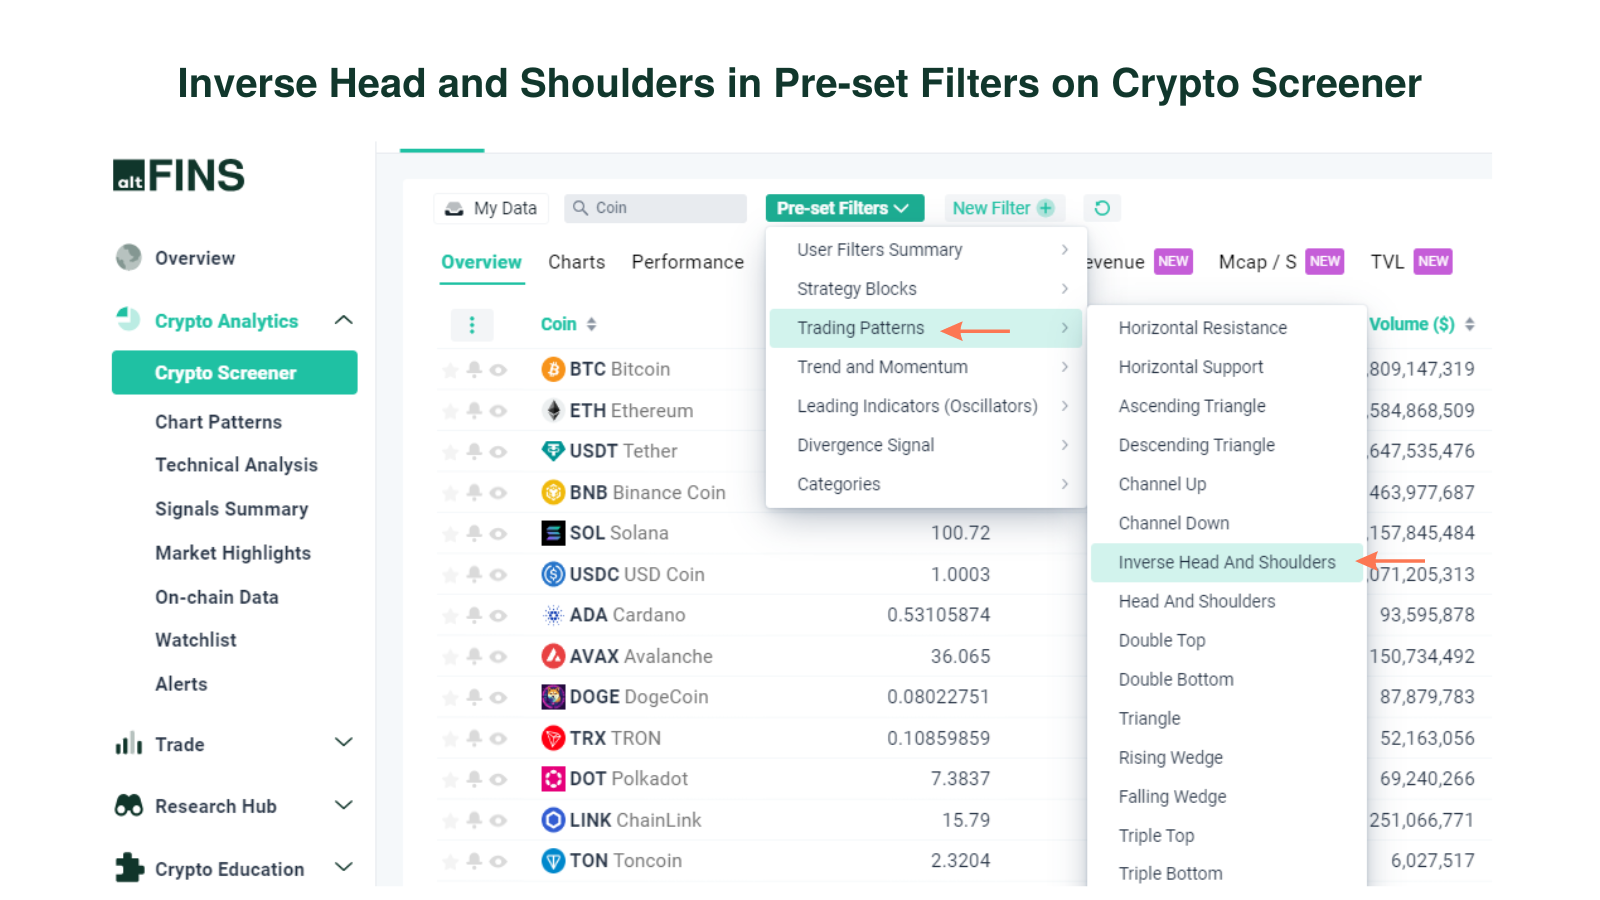
Crypto Screener: Pre-set and custom filters (SMA, EMA, RSI, MACD, volume, etc.) let you refine setups.
-
Technical Analysis: altFINS analysts cover top 60 coins with consistent TA framework.
To identify cryptocurrencies with Inverse Head and Shoulders Pattern, visit these altFINS sections:
-
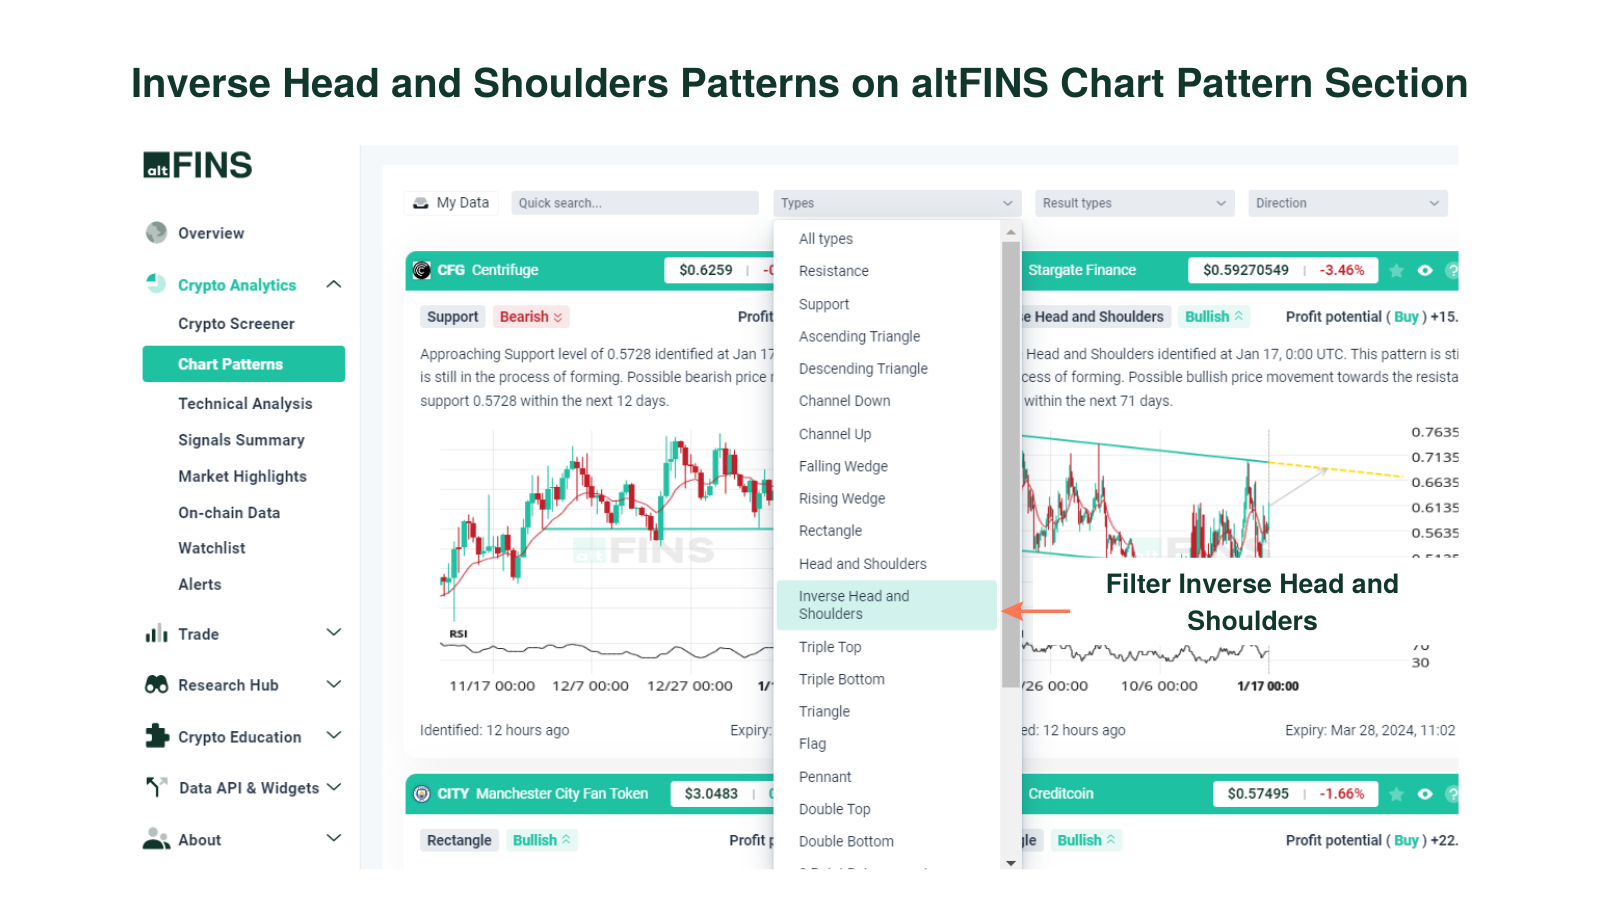
Chart Patterns section:
altFINS’ AI chart pattern recognition engine identifies 26 trading patterns across multiple time intervals (15 min, 1h, 4h, 1d), saving traders a ton of time.
You can filter chart patterns by type, profit potential, success rate, buy or sell direction, exchange, and more.
-
Signals Summary
Crypto signals represent a summary of pre-defined and custom filters for trading strategies. Signals Summary is a great starting point for discovering trading opportunities. Ascending triangle chart patterns can be found in the Trading Patterns category.
-
Crypto Screener – Pre-set filters
altFINS offers the best free crypto screener. It includes a wide range of pre- set filters to help find the best cryptocurrencies to invest in based on your specific crypto trading strategy. Learn how to use crypto screener.
-
Crypto Screener – Custom filters
You can set up your own custom screens using combinations of technical indicators (SMA, EMA, RSI, MACD), variables like market cap, traded volume and price performance. You can also create price alerts for your scans.
-
Technical Analysis
altFINS’ analysts conduct technical analysis of top 60 coins. Thea technical nalysis is simple and consistent. It follows the key concepts of Technical Analysis (TA): 1) Trend 2) Momentum 3) Volume 4) Chart Patterns 5) Support and Resistance.
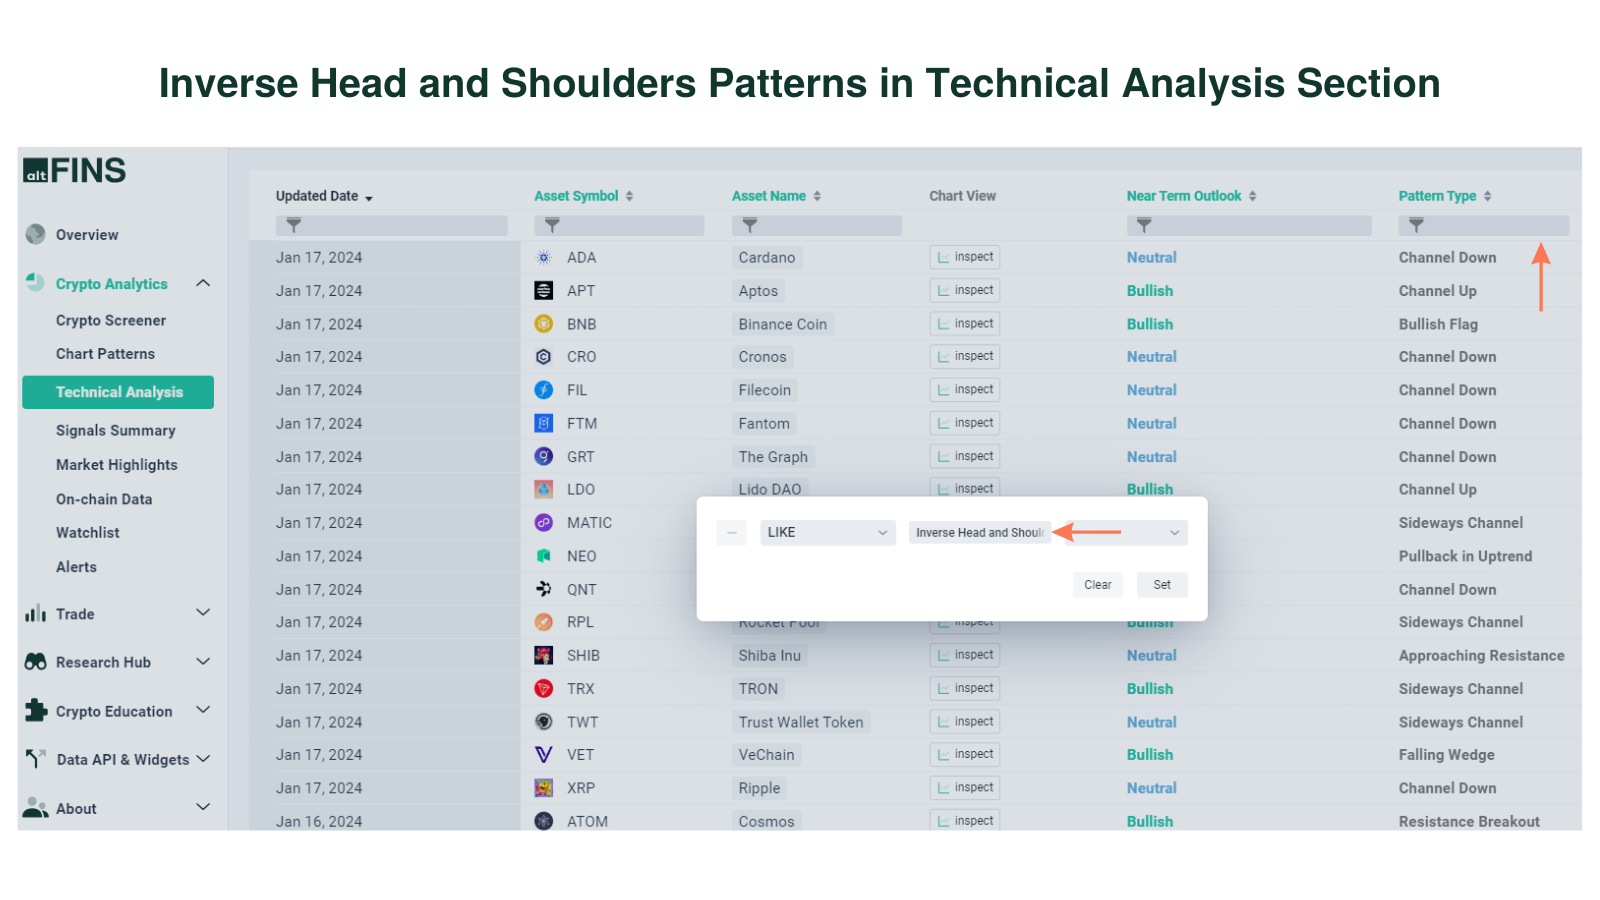
Go to Technical Analysis Section
Final Thoughts
The Inverse Head and Shoulders is a reliable bullish reversal pattern. altFINS helps traders automatically detect, confirm, and act on this setup with advanced tools and alerts.
📌 Tip: Always confirm breakouts with volume, protect positions with stop-loss orders, and align trades with your broader strategy.
FAQs: Inverse Head and Shoulders Pattern
1. What does the inverse head and shoulders pattern mean in crypto?
It signals a potential bullish reversal after a downtrend. The pattern suggests that selling pressure is weakening and buyers may take control, often leading to higher prices.
2. How reliable is the inverse head and shoulders pattern?
It is considered one of the most reliable reversal patterns. Backtests on altFINS show an 86% success rate, making it more dependable than many other chart setups.
3. Where should I enter a trade on an inverse head and shoulders?
Most traders enter a long position when the price closes above the neckline with strong volume. Some wait for a retest of the neckline for a safer entry point.
4. How do I set a price target for this pattern?
Measure the vertical distance between the head and the neckline, then project that distance upward from the breakout point. This gives an approximate price target.
5. Where do I put a stop-loss when trading this pattern?
A common approach is placing a stop-loss just below the neckline or slightly under the right shoulder, depending on your risk tolerance.
6. Does volume matter in an inverse head and shoulders breakout?
Yes. A breakout accompanied by higher-than-average trading volume adds credibility to the pattern and reduces the chance of a false signal.
7. Can the inverse head and shoulders pattern fail?
Yes. Like all chart patterns, it can produce false breakouts. If price falls back below the right shoulder or neckline, the pattern is invalidated.
8. What’s the difference between head and shoulders vs. inverse head and shoulders?
- Head and Shoulders: Bearish reversal pattern that forms after an uptrend.
- Inverse Head and Shoulders: Bullish reversal pattern that forms after a downtrend.

More tips:
- Lean how to trade Chart Patterns?
- What are Crypto Chart Patterns?
- How to Trade Channel Down Pattern?
- How to Trade Channel Up Pattern?
- How to Set up Chart Pattern Alerts?
- How To Trade Rising Wedge pattern?
- How To Trade Falling Wedge pattern?
- What are Inverse Head and Should Patterns?
