Search Knowledge Base by Keyword
How To Trade Descending Triangle pattern? | Crypto Chart Pattern
TL;DR – Descending Triangle Pattern
- What it is: A bearish continuation pattern formed by lower highs and a flat horizontal support.
- Market meaning: Sellers are gaining control; bullish momentum is weakening.
- Typical outcome: Price usually breaks below support, continuing the downtrend.
- Best entry: After a confirmed breakdown below support with increased volume.
- Price target: Measure the widest part of the triangle and project it downward from the breakout.
- Stop-loss: Place above the breakdown level or above the last lower high.
- Volume behavior: Declines during formation, expands on breakout.
- Risk note: False breakouts happen—wait for confirmation and manage risk.
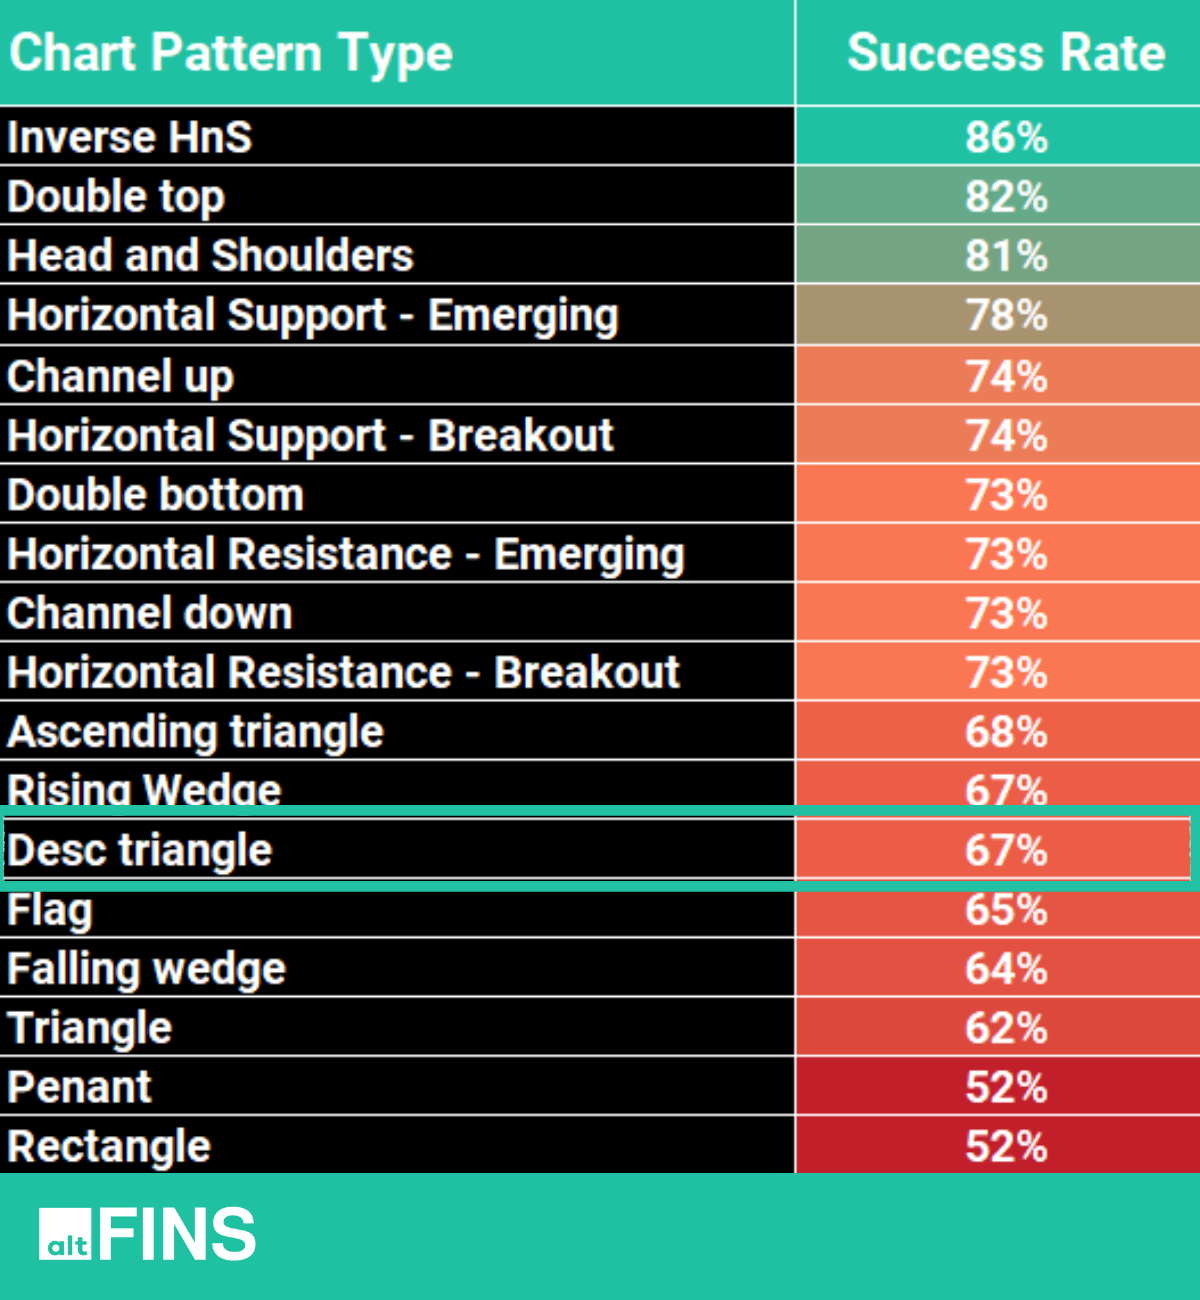
altFINS edge: Backtests show ~67% success rate; pattern is auto-detected across multiple timeframes and filterable in Chart Patterns, Signals Summary, and Crypto Screener.
What Is Descending Triangle Pattern?
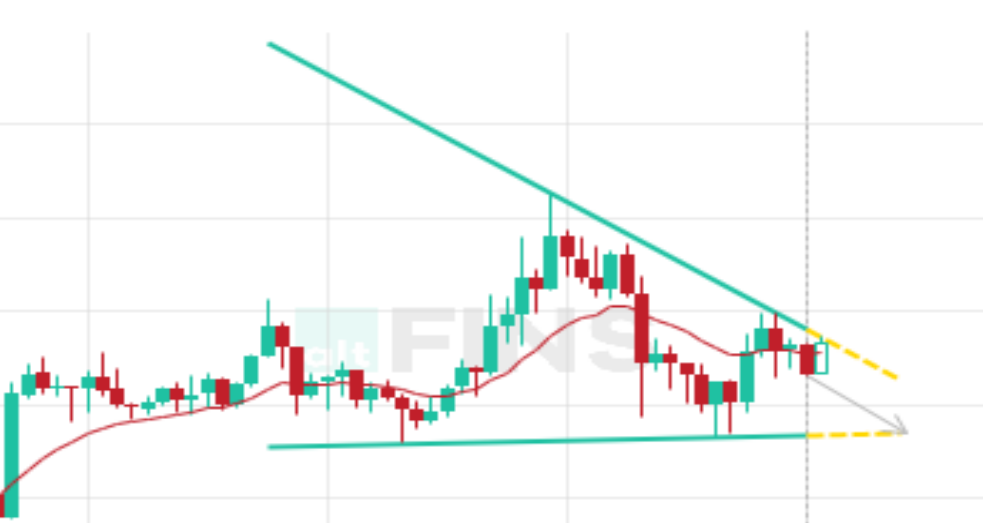
The descending triangle is a technical analysis pattern formed by drawing a horizontal line along the swing lows and connecting a series of lower highs with a descending trendline. This results in a triangular shape with a flat horizontal support and a descending resistance.
Traders interpret the descending triangle as a bearish continuation pattern, suggesting that the existing downtrend is likely to persist. The pattern indicates a struggle between buyers and sellers, with lower highs signaling weakening bullish momentum. If the price breaks below the horizontal support, it may lead to a further downward movement.
Descending Triangle Trade Setup
Typically, a breakout will occur in the direction of the existing trend. Most traders will take a position once the price action breaks through the bottom trendline of the triangle with increased volume, which is when the price should decline an amount equivalent to the widest section of the triangle.
Example: AERGO- Descending Triangle pattern
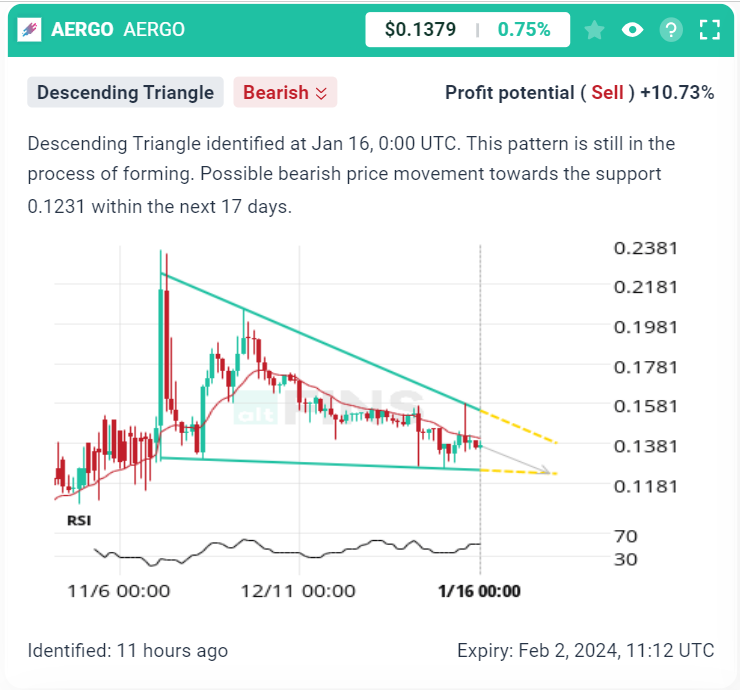

According to historical backtests conducted on the altFINS platform, the Descending Triangle pattern exhibits an impressive 67%!
According to Investopedia , these are the key takeaways:
- A descending triangle signals traders to take a short position to accelerate a breakdown.
- A descending triangle is detectable by trend lines drawn for the highs and lows on a chart.
- A descending triangle is the counterpart of an ascending triangle, another trend line-based chart pattern used by technical analysts.
Characteristics of Descending Triangle chart pattern
The descending triangle is a bearish continuation chart pattern that is formed during a downtrend. It is characterized by a series of lower highs and a horizontal support line. Here are the key characteristics of a descending triangle chart pattern:
-
- Downtrend: The descending triangle typically occurs within a prevailing downtrend, signaling a continuation of the existing bearish trend.
- Lower Highs: The pattern is formed by a series of lower highs. Each rally in the price fails to reach the previous high, creating a descending trendline.
- Horizontal Support Line:There is a horizontal support line at the bottom, connecting the lows of the price movement. This support level represents a significant area where selling pressure is being absorbed.
- Consolidation: The price action within a descending triangle represents a period of consolidation as the market hesitates between the bearish pressure of lower highs and the support level.
- Volume: Volume tends to decline during the formation of the descending triangle. It often picks up when the price breaks below the horizontal support, confirming the bearish signal.
- Breakout Direction: The descending triangle is a continuation pattern, and the expected price movement is a breakout to the downside. The breakout usually occurs before reaching the apex of the triangle.
- Target Measurement: Traders often estimate a potential price target for the downside move by measuring the height of the triangle at its widest point and projecting that distance below the breakout point.
- Confirmation: Confirmation of the descending triangle occurs when the price breaks below the horizontal support level. Traders may wait for the breakout to be accompanied by increased volume to enhance the validity of the pattern.
- False Breakouts: Like any chart pattern, false breakouts can occur. Traders should be cautious and wait for confirmation, especially through increased volume, to reduce the risk of false signals.
How to trade Descending Triangle patterns?
Trading descending triangle patterns involves identifying potential opportunities for profit within the context of a descending triangle formation on a price chart. A descending triangle is a bearish continuation pattern characterized by a series of lower highs and a horizontal support level.
Here are steps you can consider when trading descending triangle patterns:
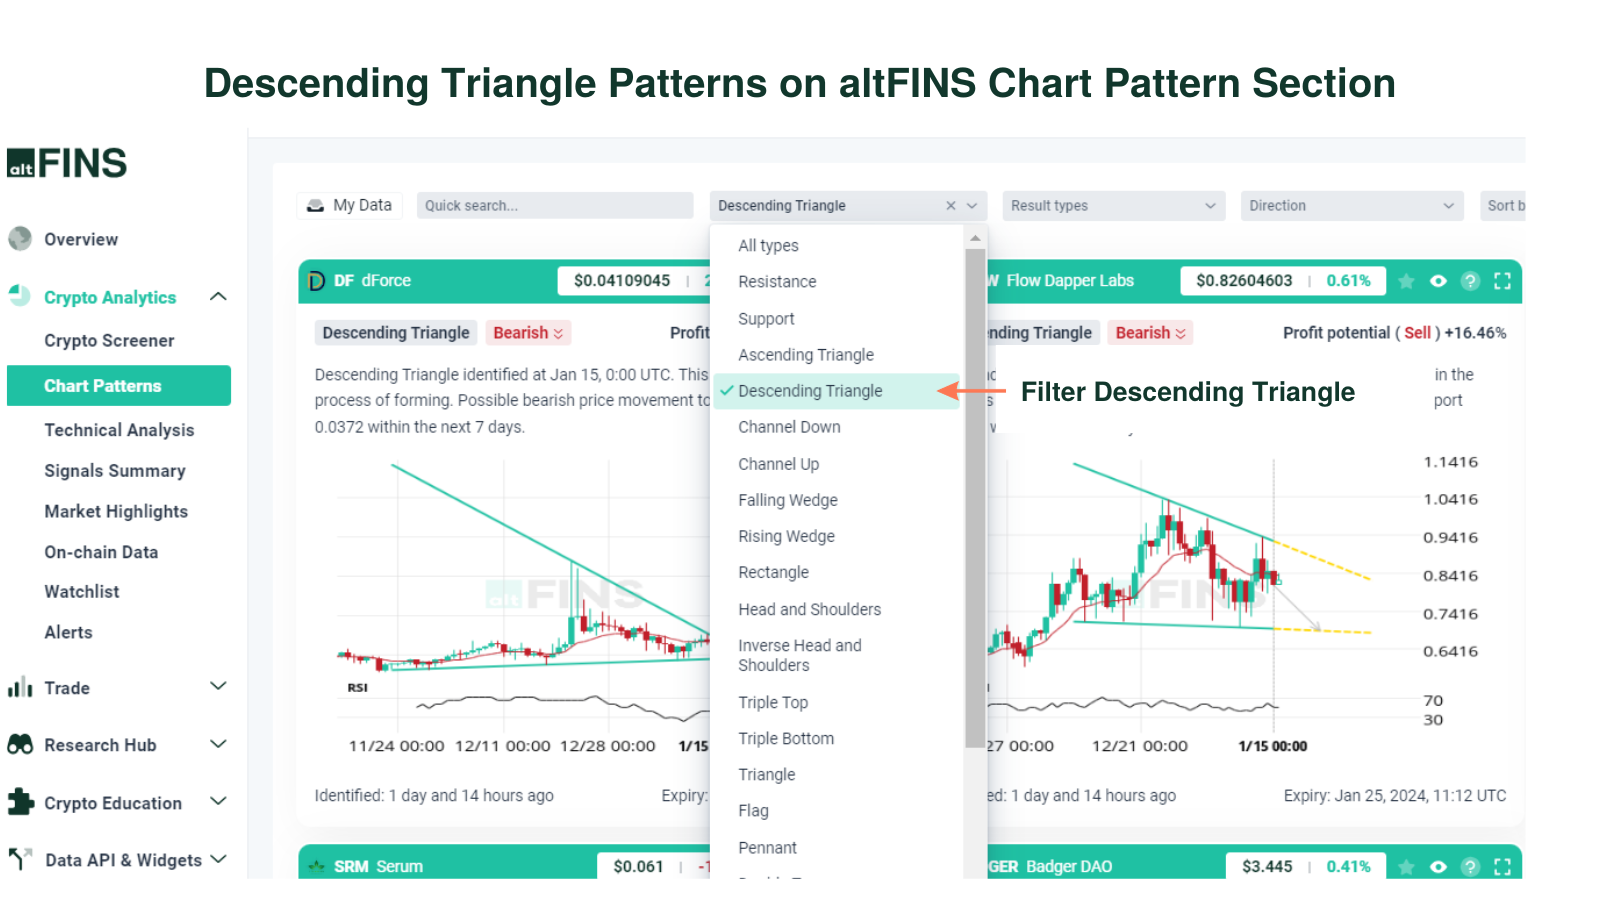
- Identify the Pattern, or filter Descending Triangle pattern on altFINS: Look for a series of lower highs, where the price consistently fails to break above a descending trendline.
Identify a horizontal support level where the price repeatedly bounces. - Confirm the Pattern: Ensure that the descending triangle pattern is well-established with at least two or three points touching the descending trendline and two or more touches on the horizontal support level.
- Wait for Breakout: Descending triangles are typically considered continuation patterns, and traders often wait for a breakout below the horizontal support level. However, some traders may also consider shorting the token near the descending trendline, anticipating a breakdown.
- Confirm Breakout: It’s crucial to wait for a confirmed breakout before taking any trading action. This confirmation can come in the form of a convincing candle close below the support level, accompanied by increased volume.
- Set Stop-Loss and Take-Profit Levels: Place a stop-loss order above the breakout point to limit potential losses in case the trade does not go as expected. Determine a reasonable target for profit, often by measuring the height of the triangle and projecting it downwards from the breakout point. This gives you a potential target level.
- Consider Volume: Analyze volume during the breakout. An increase in volume can add validity to the breakout, indicating stronger selling pressure.
- Risk Management: Only risk a small percentage of your trading capital on any single trade. This helps protect your overall portfolio from significant losses.
How To Identify Descending Triangle Pattern on altFINS?
To identify cryptocurrencies with Descending Triangle patterns, visit these altFINS sections:
-
Chart Patterns section:
altFINS’ AI chart pattern recognition engine identifies 26 trading patterns across multiple time intervals (15 min, 1h, 4h, 1d), saving traders a ton of time.
You can filter chart patterns by type, profit potential, success rate, buy or sell direction, exchange, and more.
-
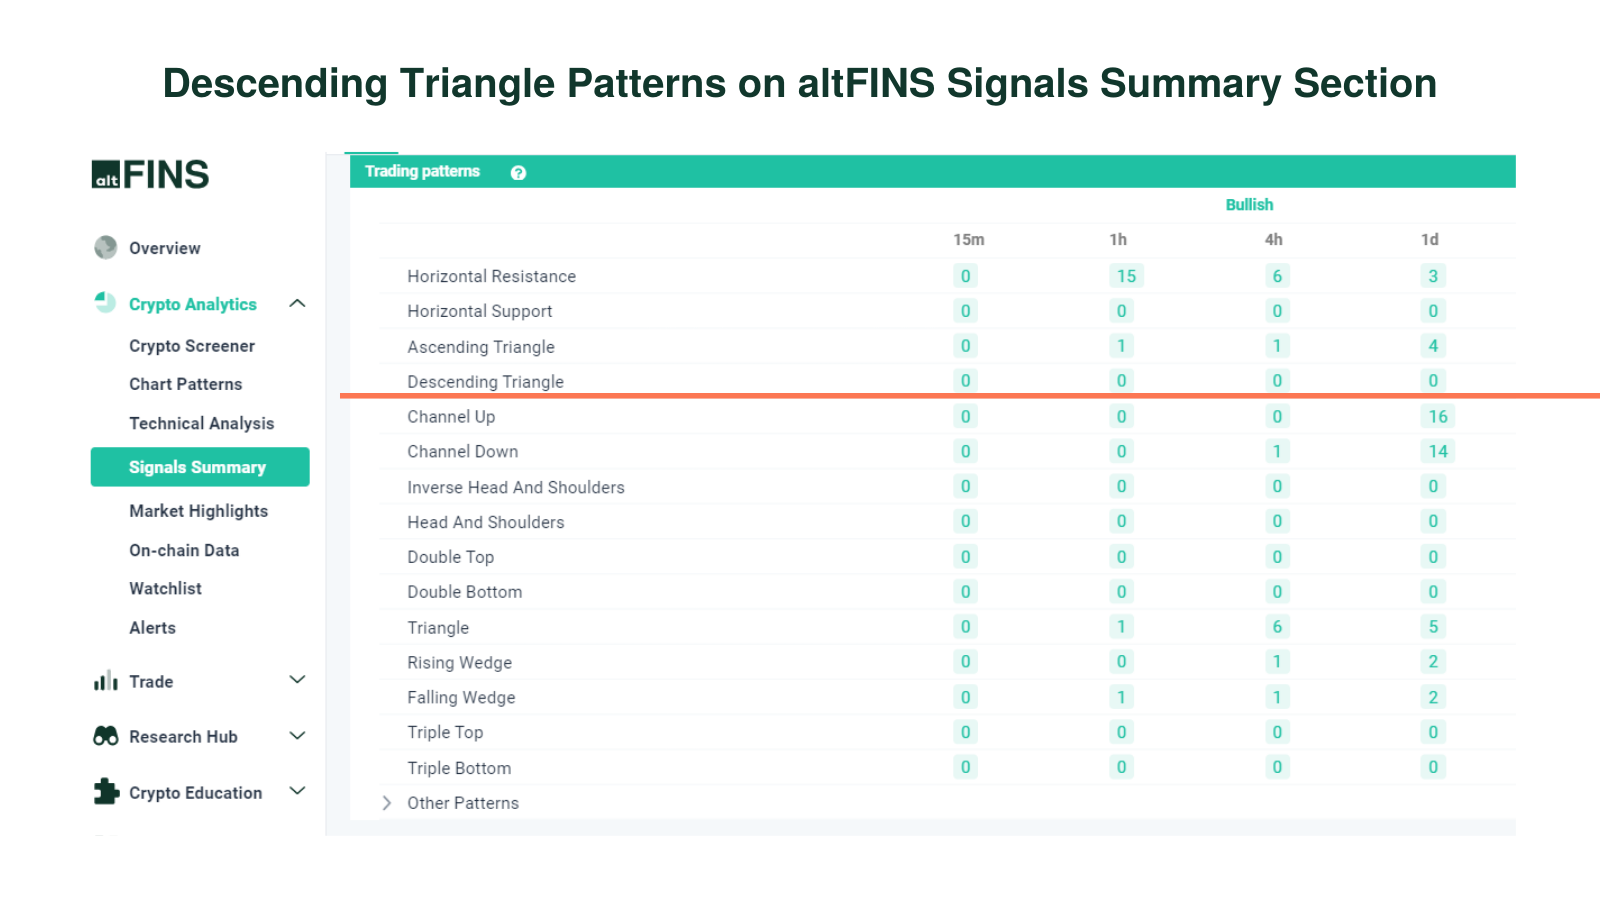
Signals Summary
Crypto signals represent a summary of pre-defined and custom filters for trading strategies. Signals Summary is a great starting point for discovering trading opportunities. Ascending triangle chart patterns can be found in the Trading Patterns category.
-
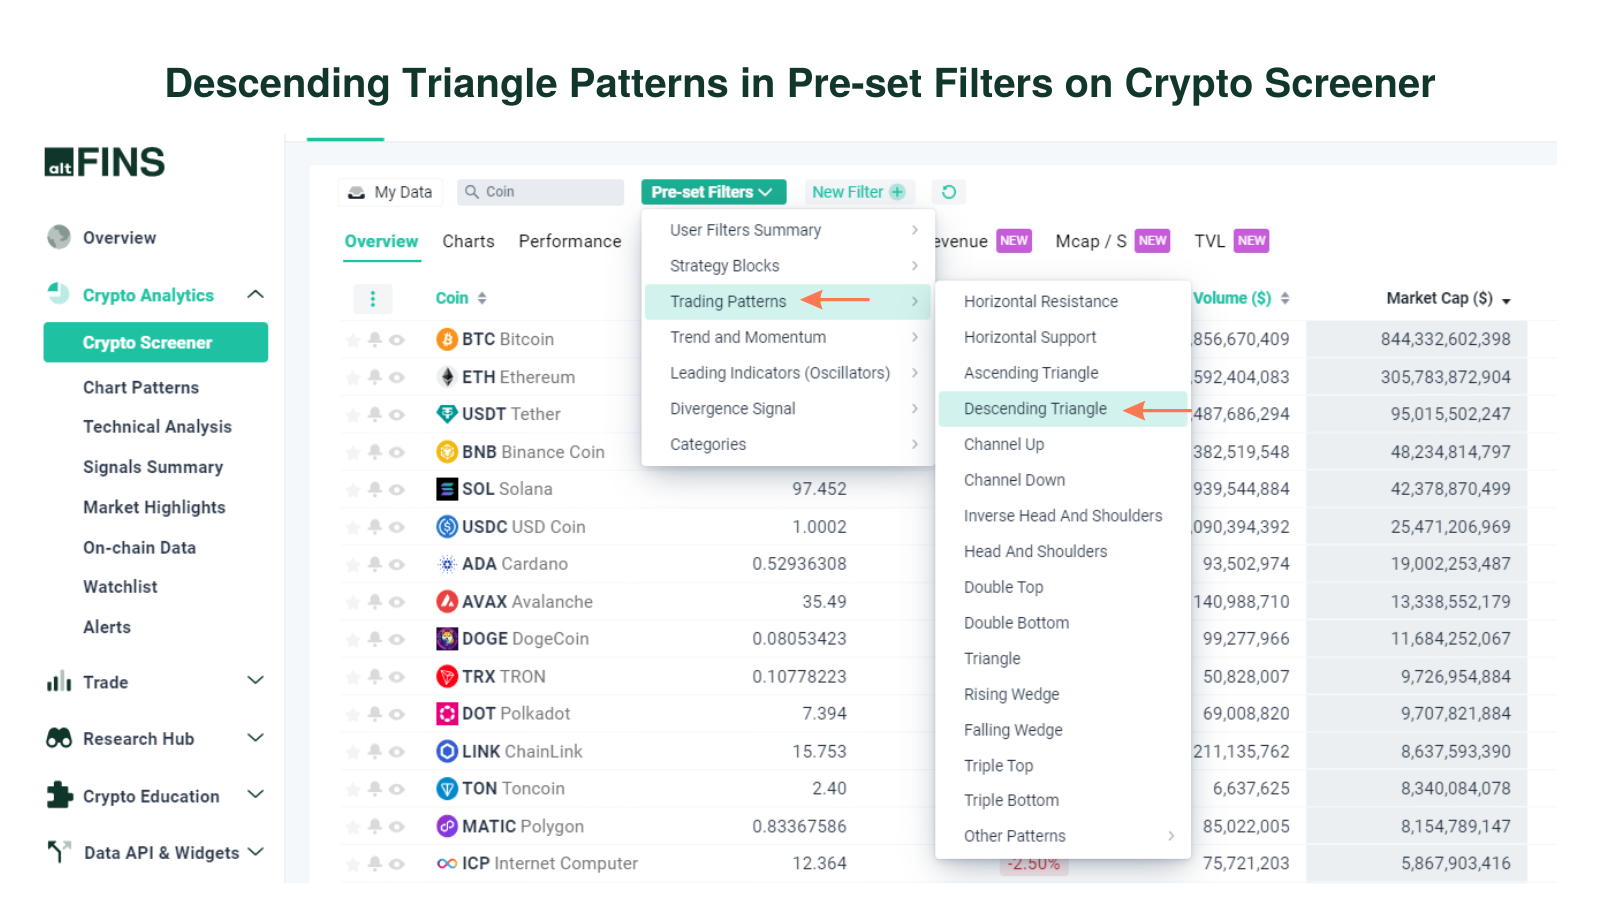
Crypto Screener – Pre-set filters
altFINS offers the best free crypto screener. It includes a wide range of pre- set filters to help find the best cryptocurrencies to invest in based on your specific trading strategy. Learn how to use crypto screener.
-
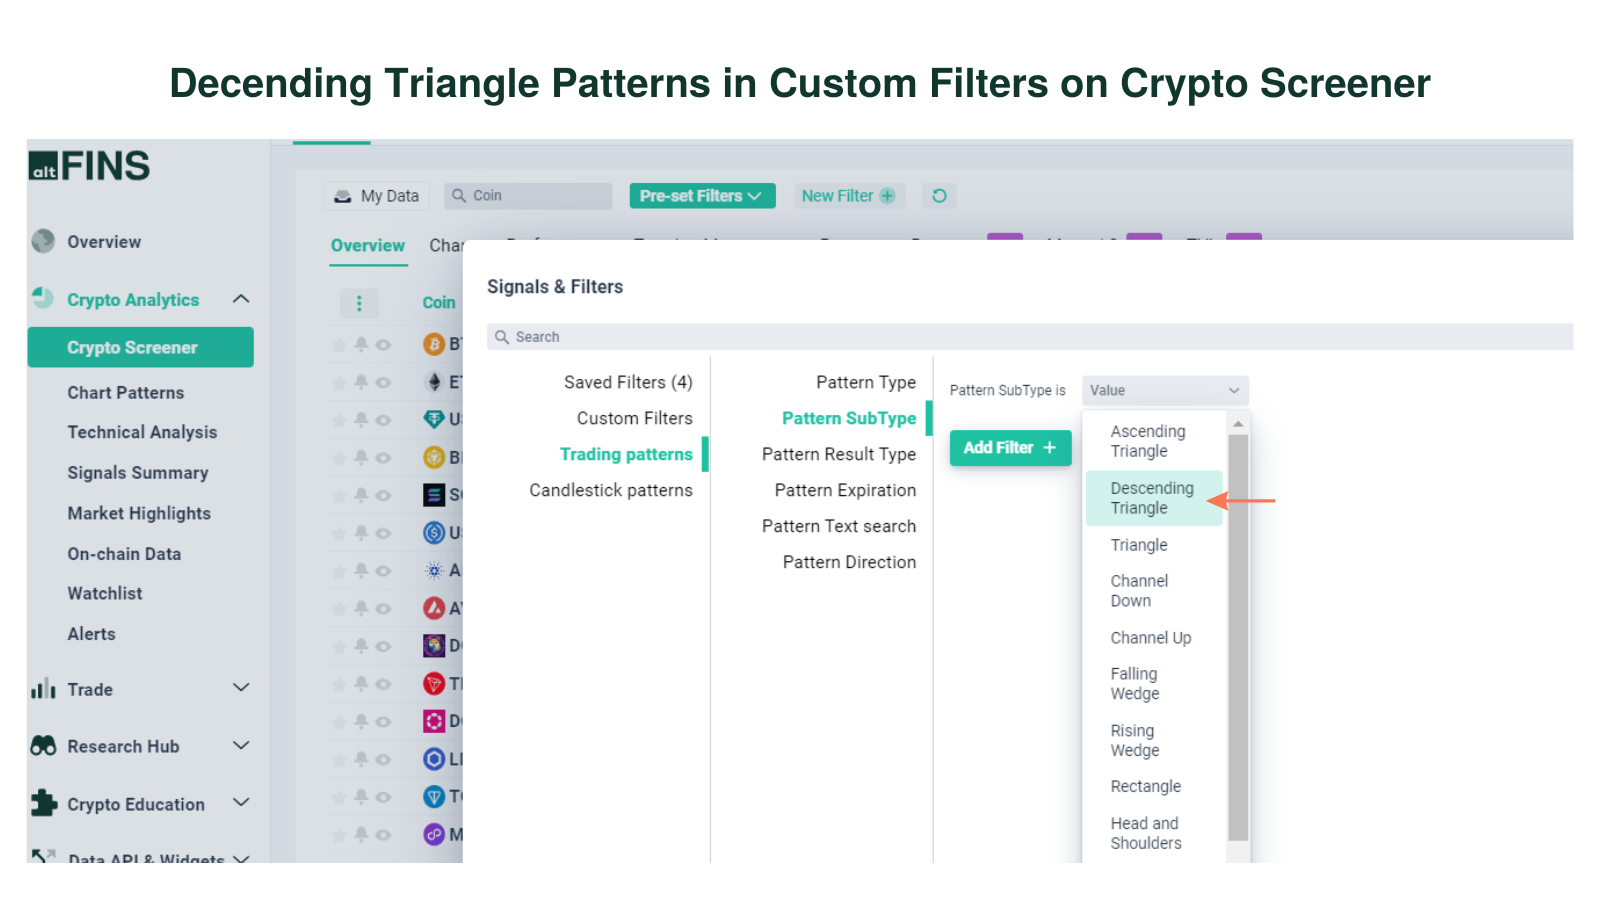
Crypto Screener – Custom filters
You can set up your own custom screens using combinations of technical indicators (SMA, EMA, RSI, MACD), variables like market cap, traded volume and price performance. You can also create price alerts for your scans.
-
Technical Analysis
altFINS’ analysts conduct technical analysis of top 60 coins. The technical analysis is simple and consistent. It follows the key concepts of Technical Analysis (TA): 1) Trend 2) Momentum 3) Volume 4) Chart Patterns 5) Support and Resistance.
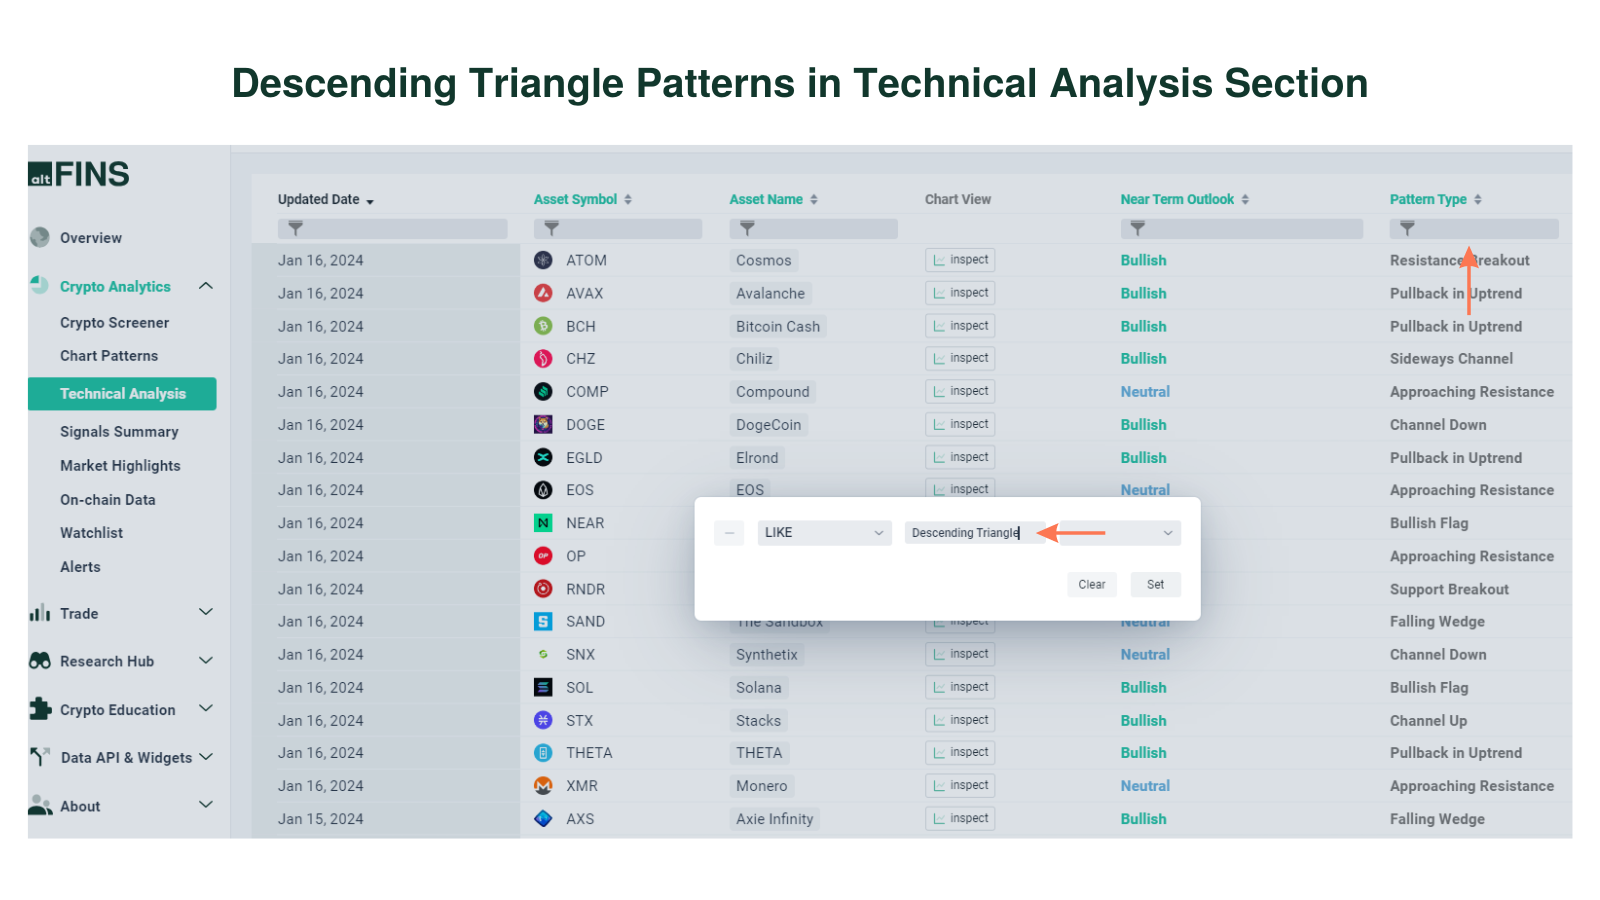
Go to Technical Analysis Section
More tips:
- Lean how to trade Chart Patterns?
- What are Crypto Chart Patterns?
- How to Trade Channel Down Pattern?
- How to Trade Channel Up Pattern?
- How to Set up Chart Pattern Alerts?
- How To Trade Rising Wedge pattern?
- How To Trade Falling Wedge pattern?
FAQ – Descending Triangle Pattern
What is a Descending Triangle pattern?
A Descending Triangle is a bearish continuation chart pattern defined by lower highs and a flat horizontal support level, forming a triangle that slopes downward.
Is the Descending Triangle bullish or bearish?
It is bearish and typically appears during a downtrend, signaling a higher probability of further downside after a breakdown.
How do you confirm a Descending Triangle?
Confirmation occurs when price closes below the horizontal support with increased trading volume. Multiple touches of both the descending trendline and support strengthen the pattern.
When should traders enter a trade?
Most traders enter a short position after a confirmed breakdown below support. Aggressive traders may enter near resistance, but confirmation is safer.
How is the price target calculated?
Measure the height of the triangle at its widest point and project that distance downward from the breakout level.
Where should the stop-loss be placed?
A common stop-loss is set above the breakout level or above the most recent lower high to limit risk.
Does volume matter in a Descending Triangle?
Yes. Volume typically declines during formation and expands on the breakout, validating the bearish move.
Can false breakouts occur?
Yes. False breakdowns are possible, especially in low-volume markets. Waiting for a candle close and volume confirmation reduces risk.
Is the Descending Triangle always a continuation pattern?
Primarily yes, but in rare cases it can act as a reversal pattern if it forms after a prolonged uptrend.
How can I find Descending Triangle patterns on altFINS?
You can detect them using:
- Chart Patterns (AI-recognized across multiple timeframes)
- Signals Summary under Trading Patterns
- Crypto Screener using pre-set or custom filters
What is the historical success rate of the pattern?
Backtests on the altFINS platform show a success rate of around 67%, making it one of the more reliable bearish chart patterns.
