

Search Knowledge Base by Keyword
How To Trade Bullish Flag Pattern? | Crypto Chart Pattern
A bull flag pattern is a bullish continuation chart pattern. Price rallies sharply (the flagpole), then drifts slightly lower or sideways in a small, parallel channel (the flag). A candle close above the flag’s upper line signals that the uptrend is likely to resume.
This guide is for crypto traders who want a clear, repeatable rule set for one of the most common patterns on any chart. You will learn how to tell a real bull flag from a failing rally, where to enter, where to put your stop loss, and how to calculate the price target.
We also break down a real SOL bull flag from September 2026, compare the bull flag with the pennant, the bear flag and the cup and handle, and show how altFINS finds flags across thousands of coins automatically. Updated September 2026.
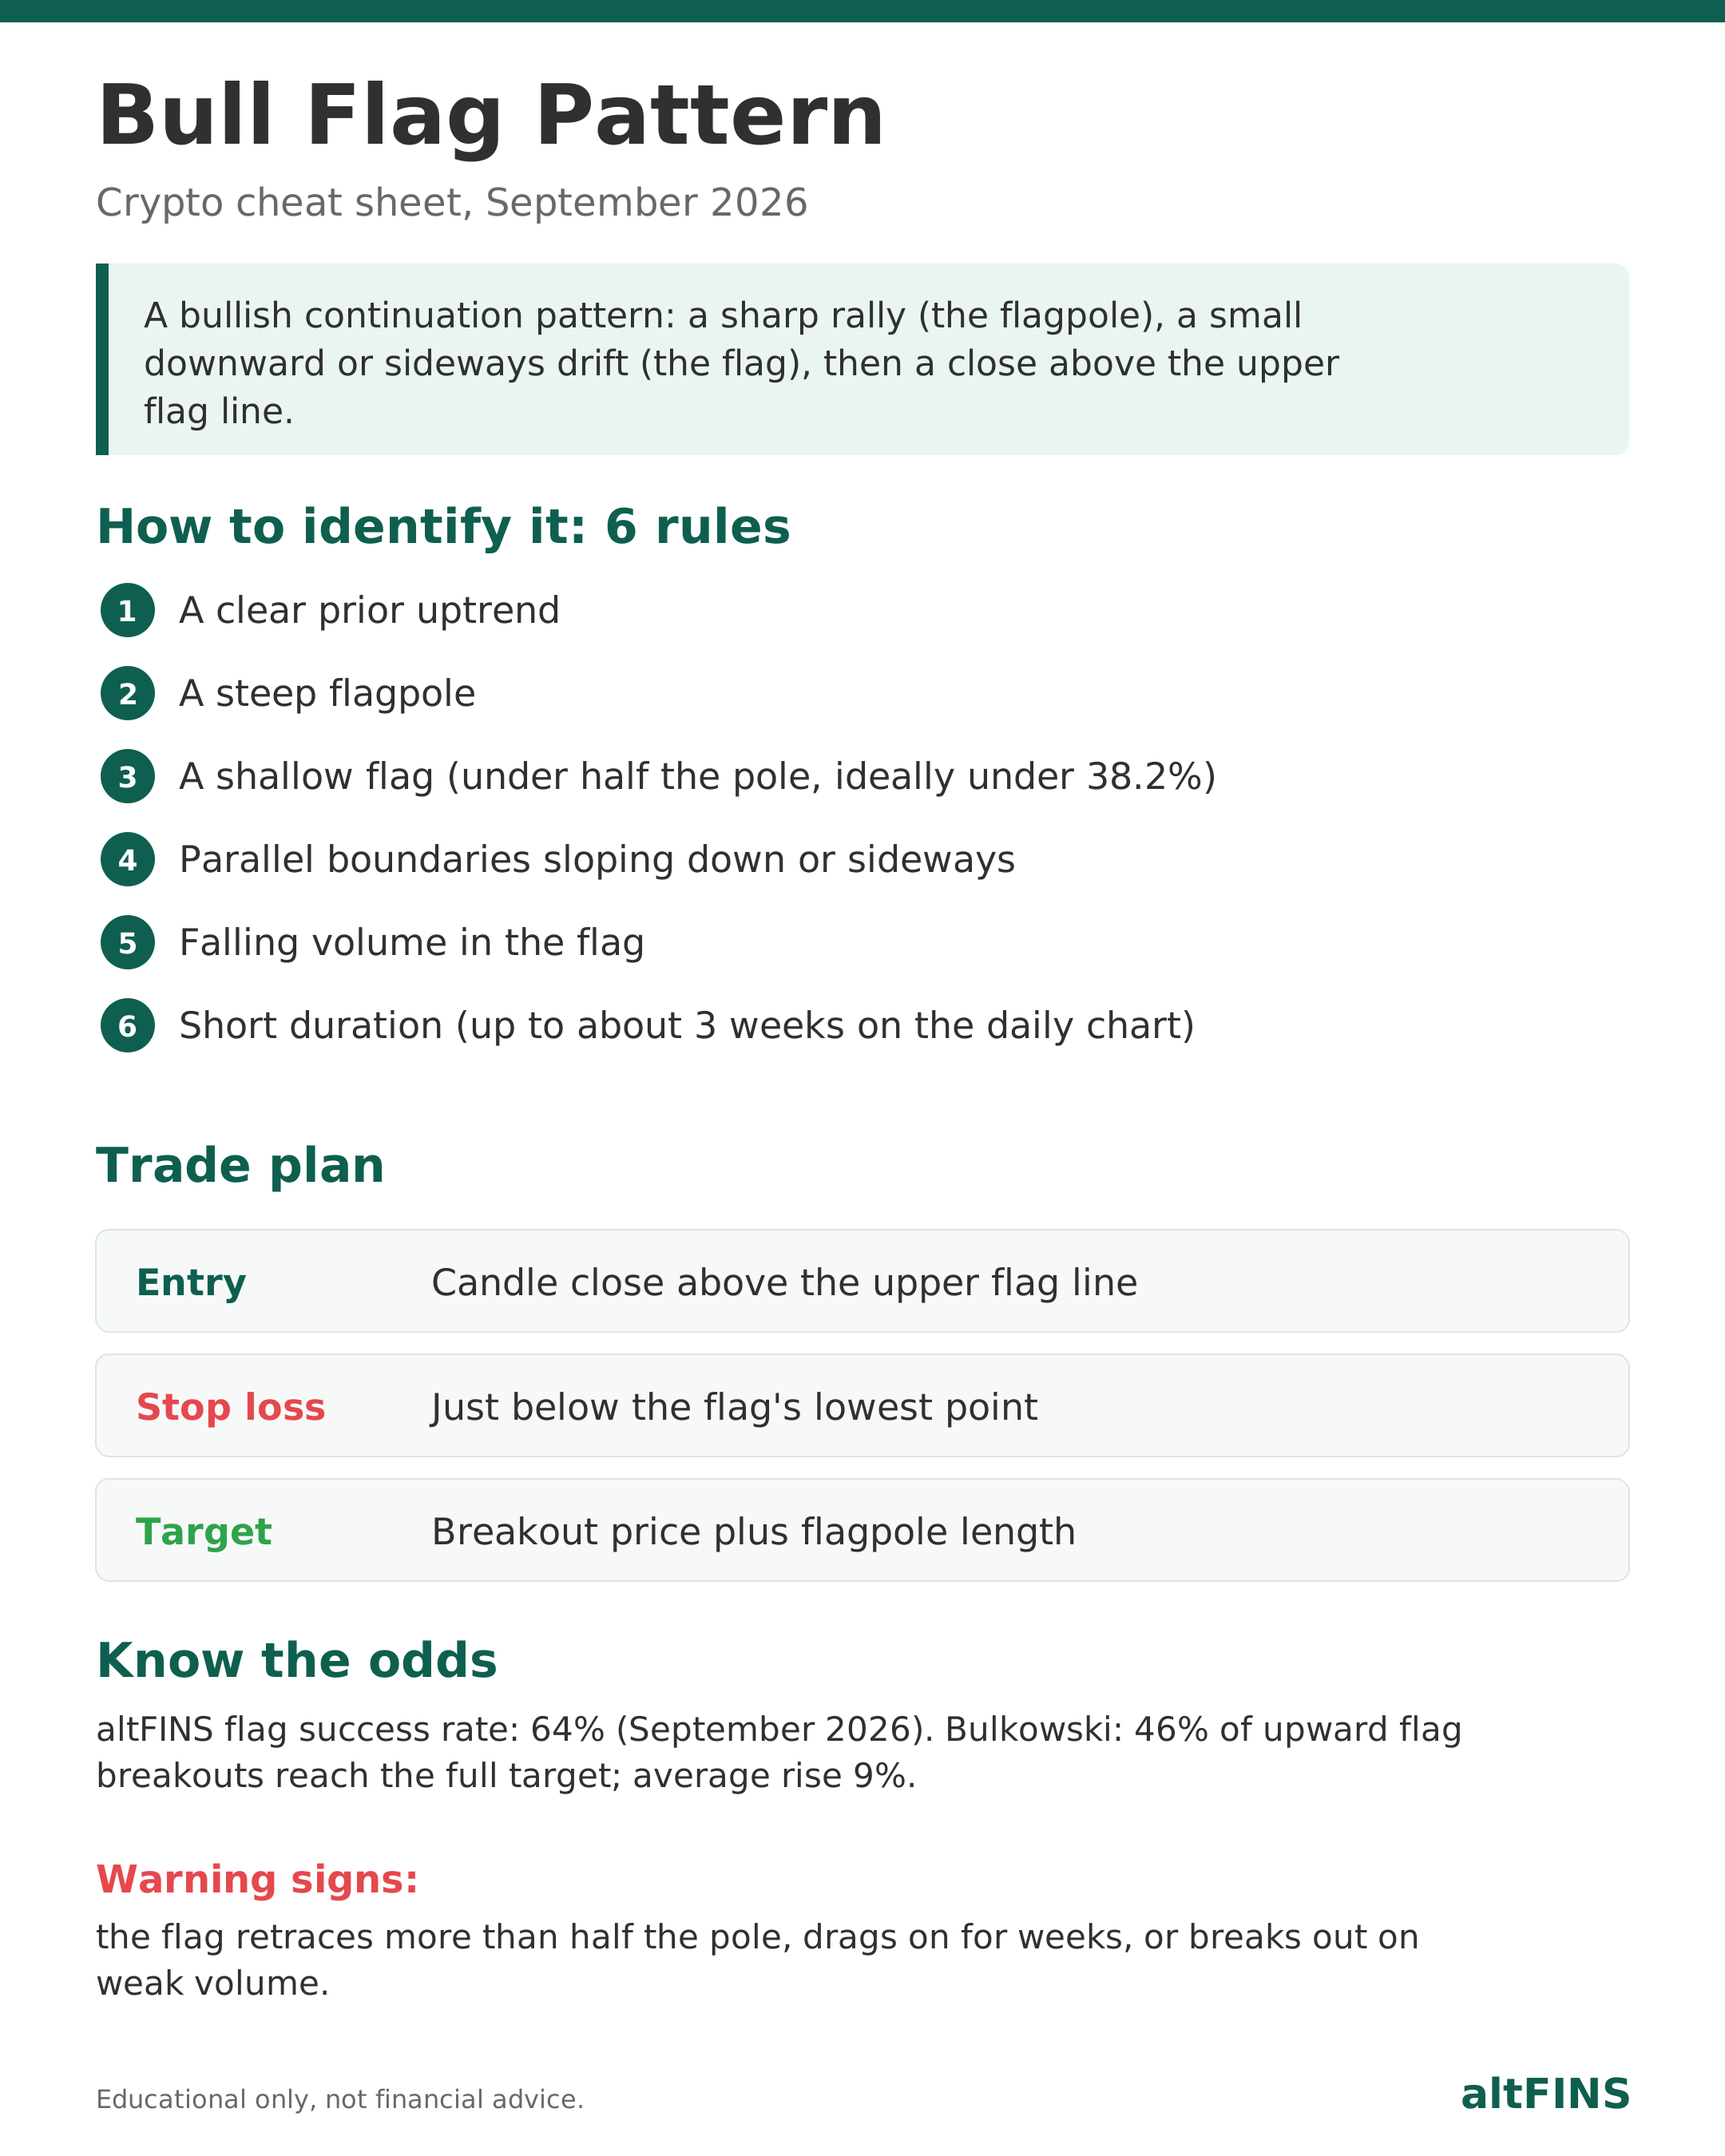
Quick answer: A bull flag is a sharp rally followed by a short, downward sloping or sideways consolidation that ends with a breakout. Traders buy on a candle close above the flag’s upper trendline, place a stop below the flag low, and target the flagpole’s length added to the breakout price. The altFINS pattern engine shows a 64% success rate for flags (September 2026), and Thomas Bulkowski found that 46% of upward flag breakouts reach the full target.
🚩 What is a bull flag pattern?
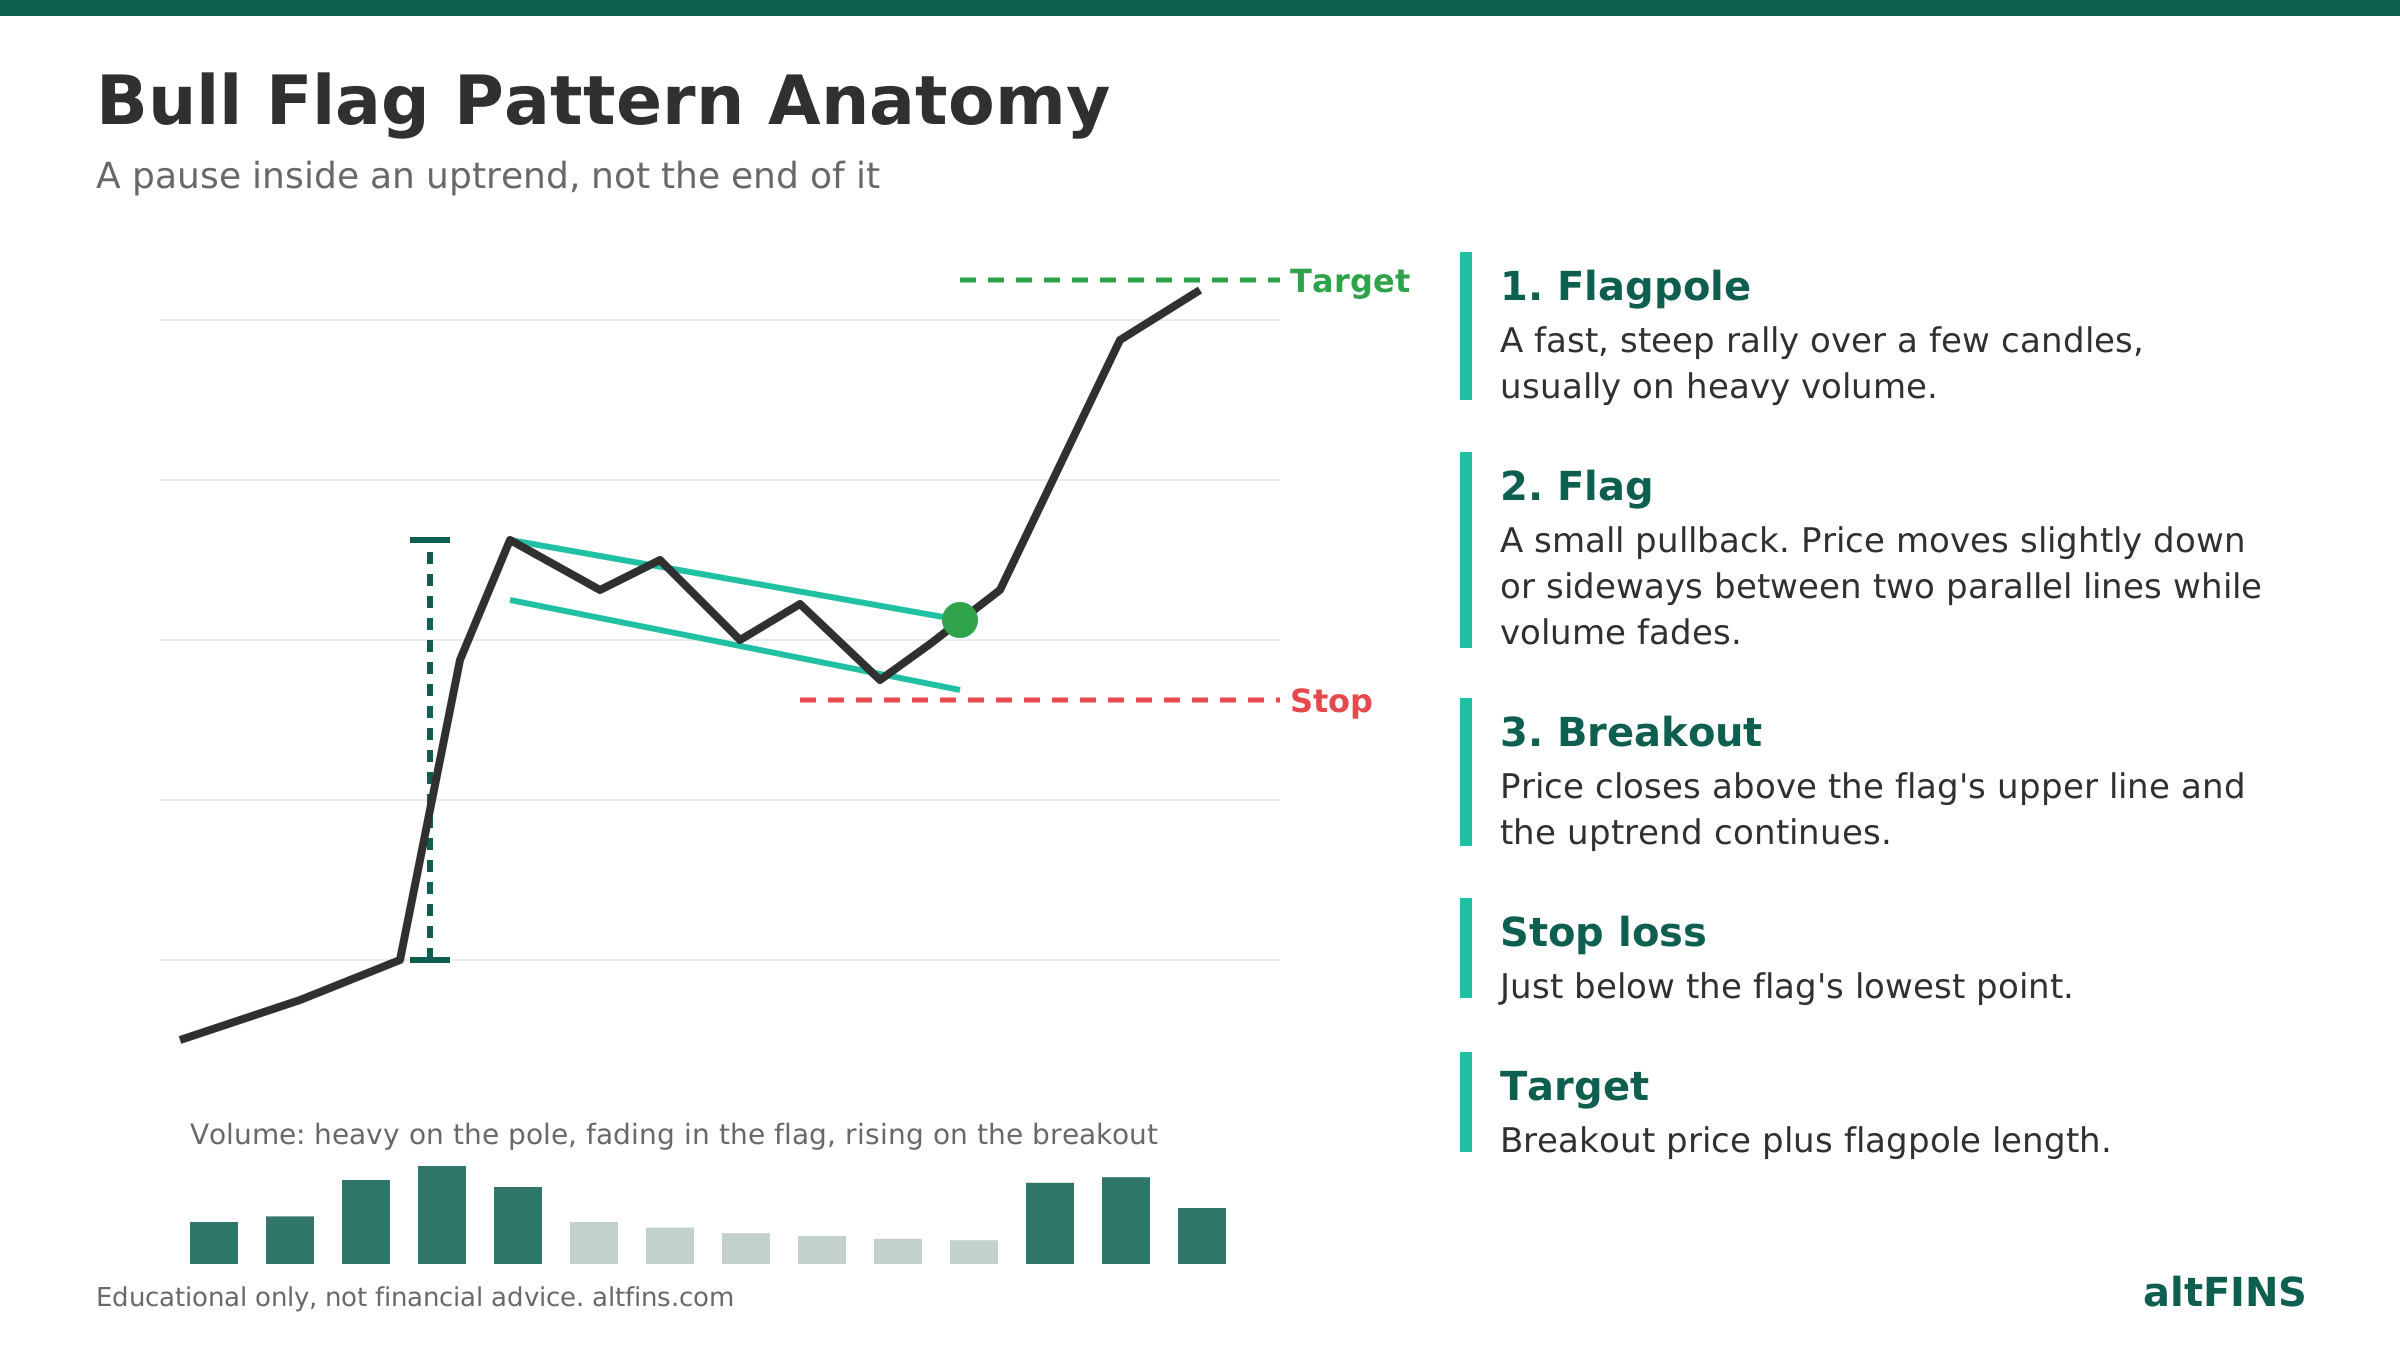
Takeaway: a bull flag is a pause inside an uptrend, not the end of it.
A bull flag has three parts:
- The flagpole: a fast, steep rally over a few candles, usually on heavy volume.
- The flag: a small pullback. Price moves slightly down or sideways between two parallel lines while volume fades.
- The breakout: price closes above the flag’s upper line and the uptrend continues.
The psychology explains why it works. The pole shows strong demand. The flag is profit taking by early buyers, but sellers cannot push price down much and volume dries up. When the last sellers are done, buyers who missed the first move step in and drive the next leg higher. Investopedia defines a flag the same way: a short consolidation against the trend that follows a sharp price move.
Bull flag vs pennant vs bear flag vs cup and handle
Takeaway: the flagpole and the shape of the pause are what separate a bull flag from its look-alikes.
| Pattern | Shape | Bias | Entry trigger | Typical length (daily chart) |
|---|---|---|---|---|
| Bull flag | Sharp rally, then a small parallel channel sloping down or sideways | Bullish continuation | Close above the upper flag line | A few days to about 3 weeks |
| Bull pennant | Sharp rally, then a small symmetrical triangle with converging lines | Bullish continuation | Close above pennant resistance | A few days to about 3 weeks |
| Bear flag | Sharp drop, then a small parallel channel sloping up or sideways | Bearish continuation | Close below the lower flag line | A few days to about 3 weeks |
| Cup and handle | U-shaped bottom, then a small pullback near the old high | Bullish continuation | Close above the handle’s resistance | Several weeks to months |
| Channel up | Price rising between two parallel upward lines, no sharp pole | Bullish trend | Bounce off the lower line or break of the upper line | Weeks to months |
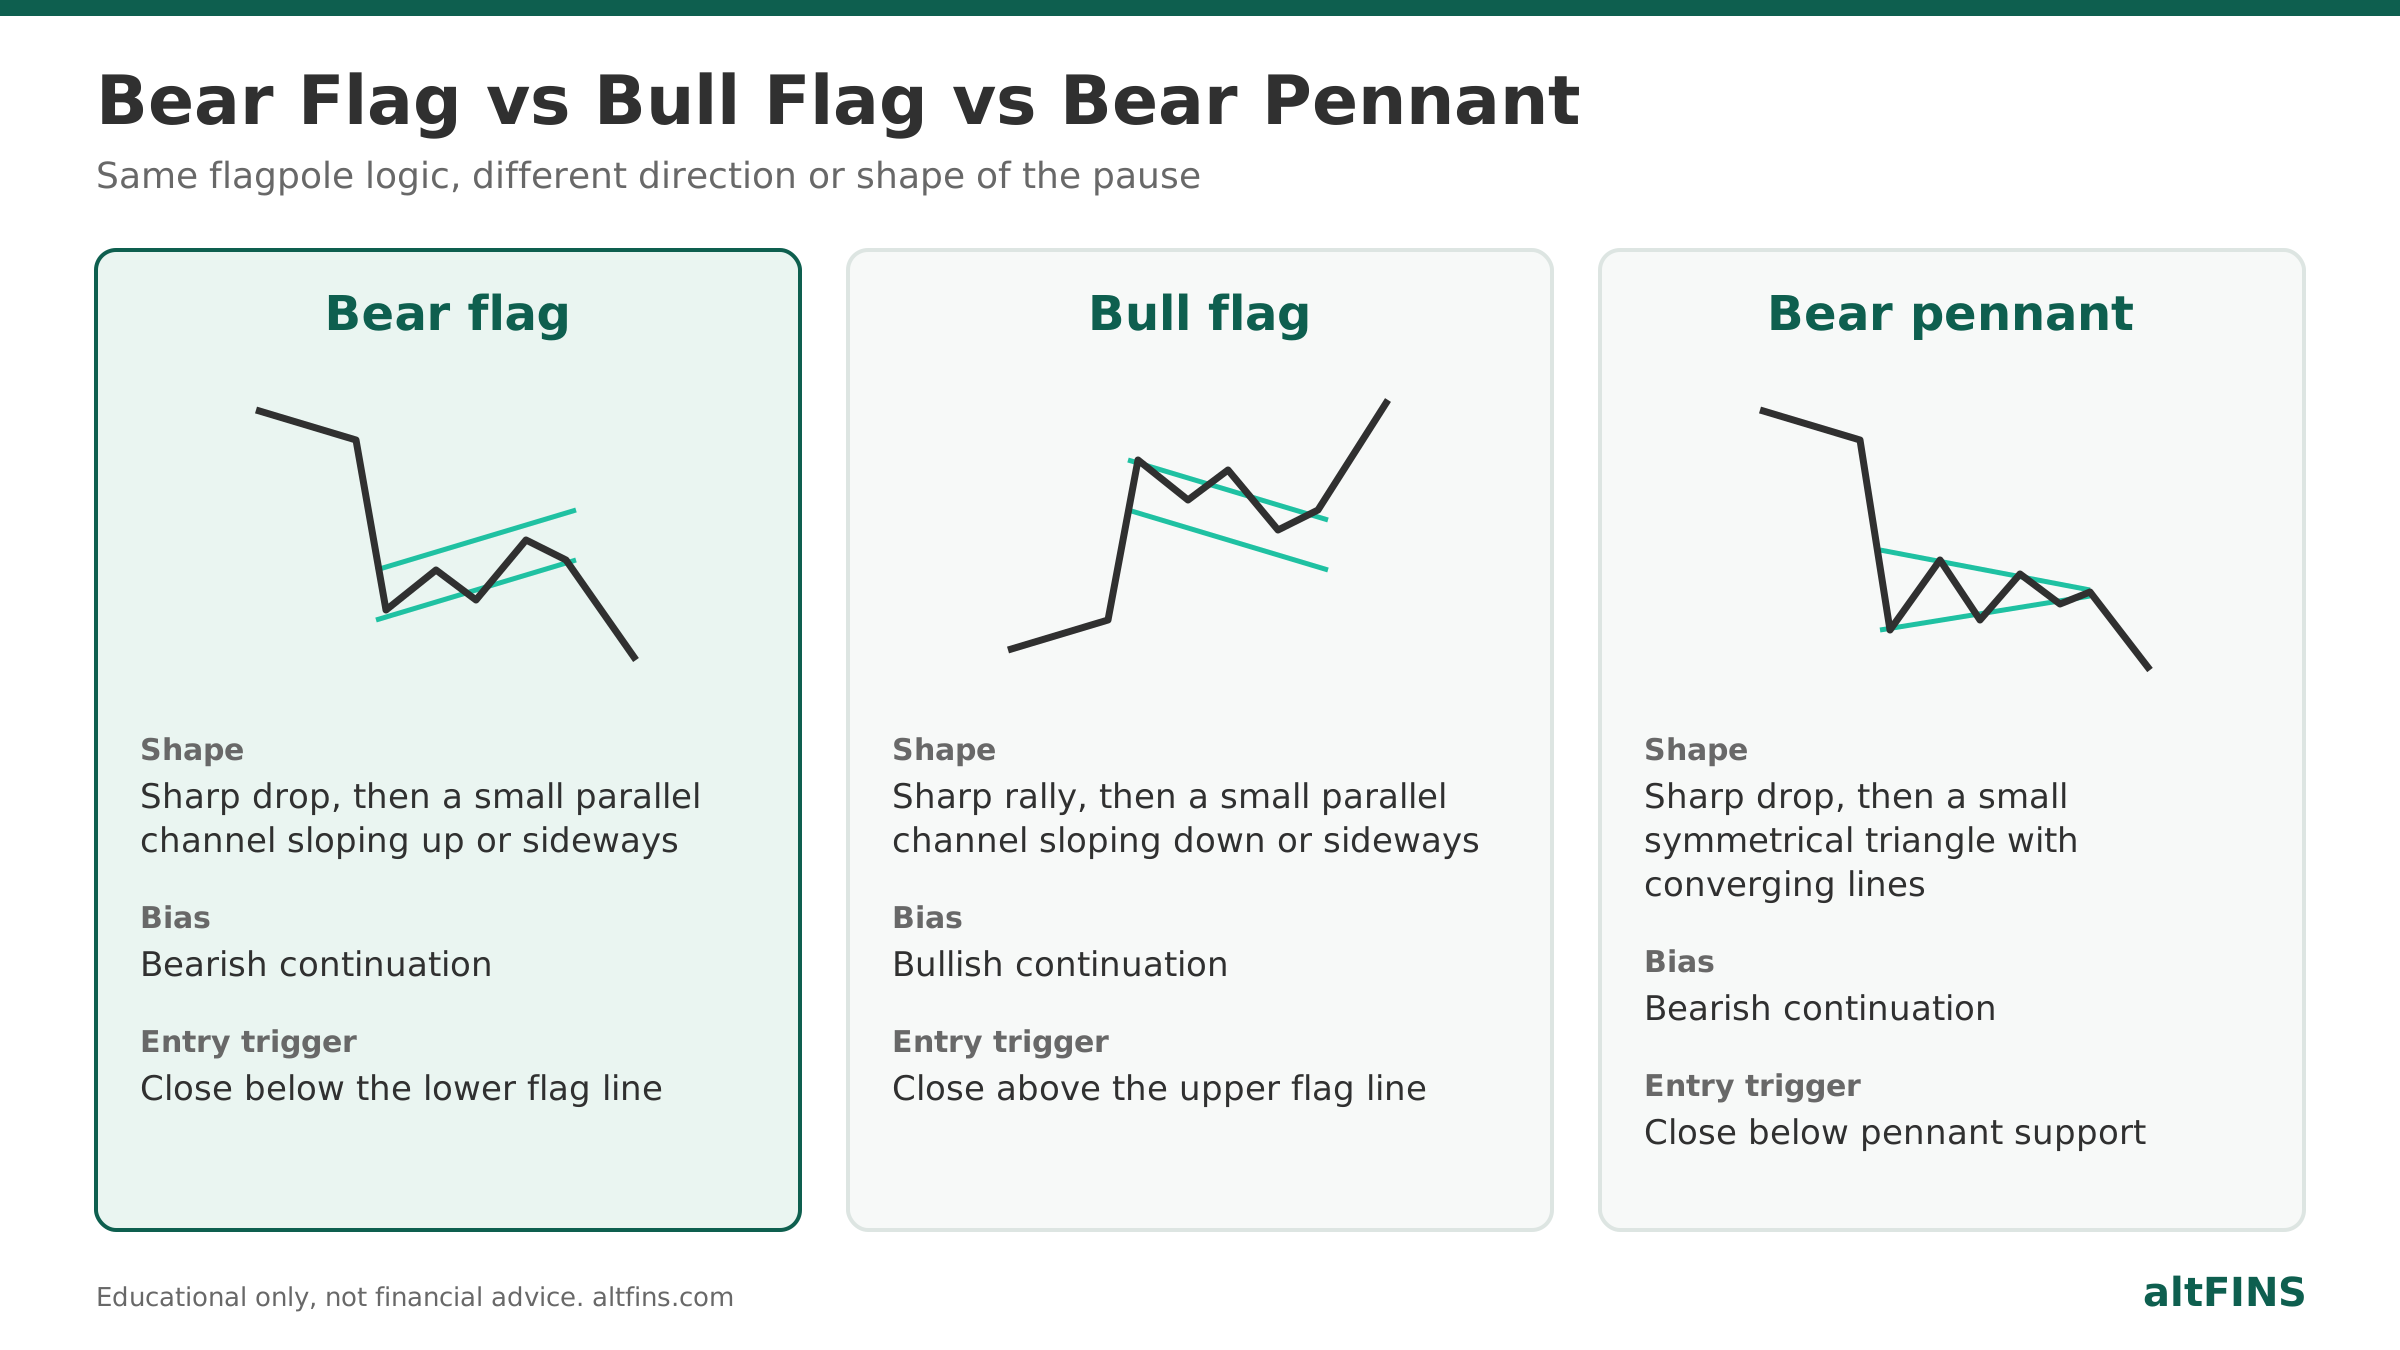
The bear flag is the exact mirror image: a sharp drop, a small bounce, then a breakdown. If you already trade one, you can trade the other with the same rules in reverse.
How to identify a bull flag: 6 rules
Takeaway: check the trend first, then the pole, then the flag.
- A clear prior uptrend. Price should be making higher highs and higher lows. A simple filter is price above a rising 50 day moving average.
- A steep flagpole. The rally should be fast and near vertical, ideally on volume well above average.
- A shallow flag. The pullback should retrace less than half of the pole, and ideally under 38.2%. A deeper pullback weakens the setup.
- Parallel boundaries. The flag’s upper and lower lines run roughly parallel and slope down or sideways. If they converge, it is a pennant.
- Falling volume in the flag. In Bulkowski’s research, volume trends downward in 74% to 77% of flags. Heavy selling volume inside the flag is a warning.
- Short duration. A common rule of thumb is up to about three weeks on the daily chart. On 4 hour crypto charts, flags often last only a few days.
Momentum can confirm the picture. In a healthy bull flag the RSI (Relative Strength Index, a 0 to 100 momentum gauge) cools off toward 50 without breaking much lower, then turns up with the breakout.
What is a high and tight flag?
A high and tight flag is an extreme version of the bull flag: the pole roughly doubles price in a short time and the flag barely pulls back. It shows up more often in small cap altcoins during hype cycles. The strength is real, but so is the volatility, so position size matters even more.
How to trade a bull flag: entry, stop loss and target
Takeaway: buy the close above the flag, stop below the flag, and target the length of the pole.
Entry
- Conservative: buy after a candle closes above the flag’s upper line, ideally on volume above the 20 period average.
- Aggressive: place a buy stop order just above the upper line. You get a better price but more false breakouts.
- Retest: wait for the breakout, then buy when price dips back to the broken line and holds. Fewer trades trigger, but the stop can be tighter.
Stop loss
Place the stop just below the flag’s lowest point. A tighter option is below the last swing low inside the flag. If price falls back into the flag and closes below its lower line, the pattern has failed.
Price target
The measured move adds the pole’s length to the breakout point:
Target = breakout price plus flagpole length
Example with round numbers: a coin rallies from 80 to 100 (a 20 point pole), pulls back to 94 in a flag, and breaks out at 96. The target is 96 plus 20, which equals 116. With a stop at 93, you risk 3 points to make 20.
Treat that target as a best case. Thomas Bulkowski’s flag statistics (last updated August 2020, stock data) show that 46% of upward flag breakouts reach the full target, the average rise is 9%, and the break-even failure rate is 44%. Taking partial profit at the nearest resistance and trailing the stop on the rest is a common way to handle this.
Real example: SOL daily bull flag, September 2026
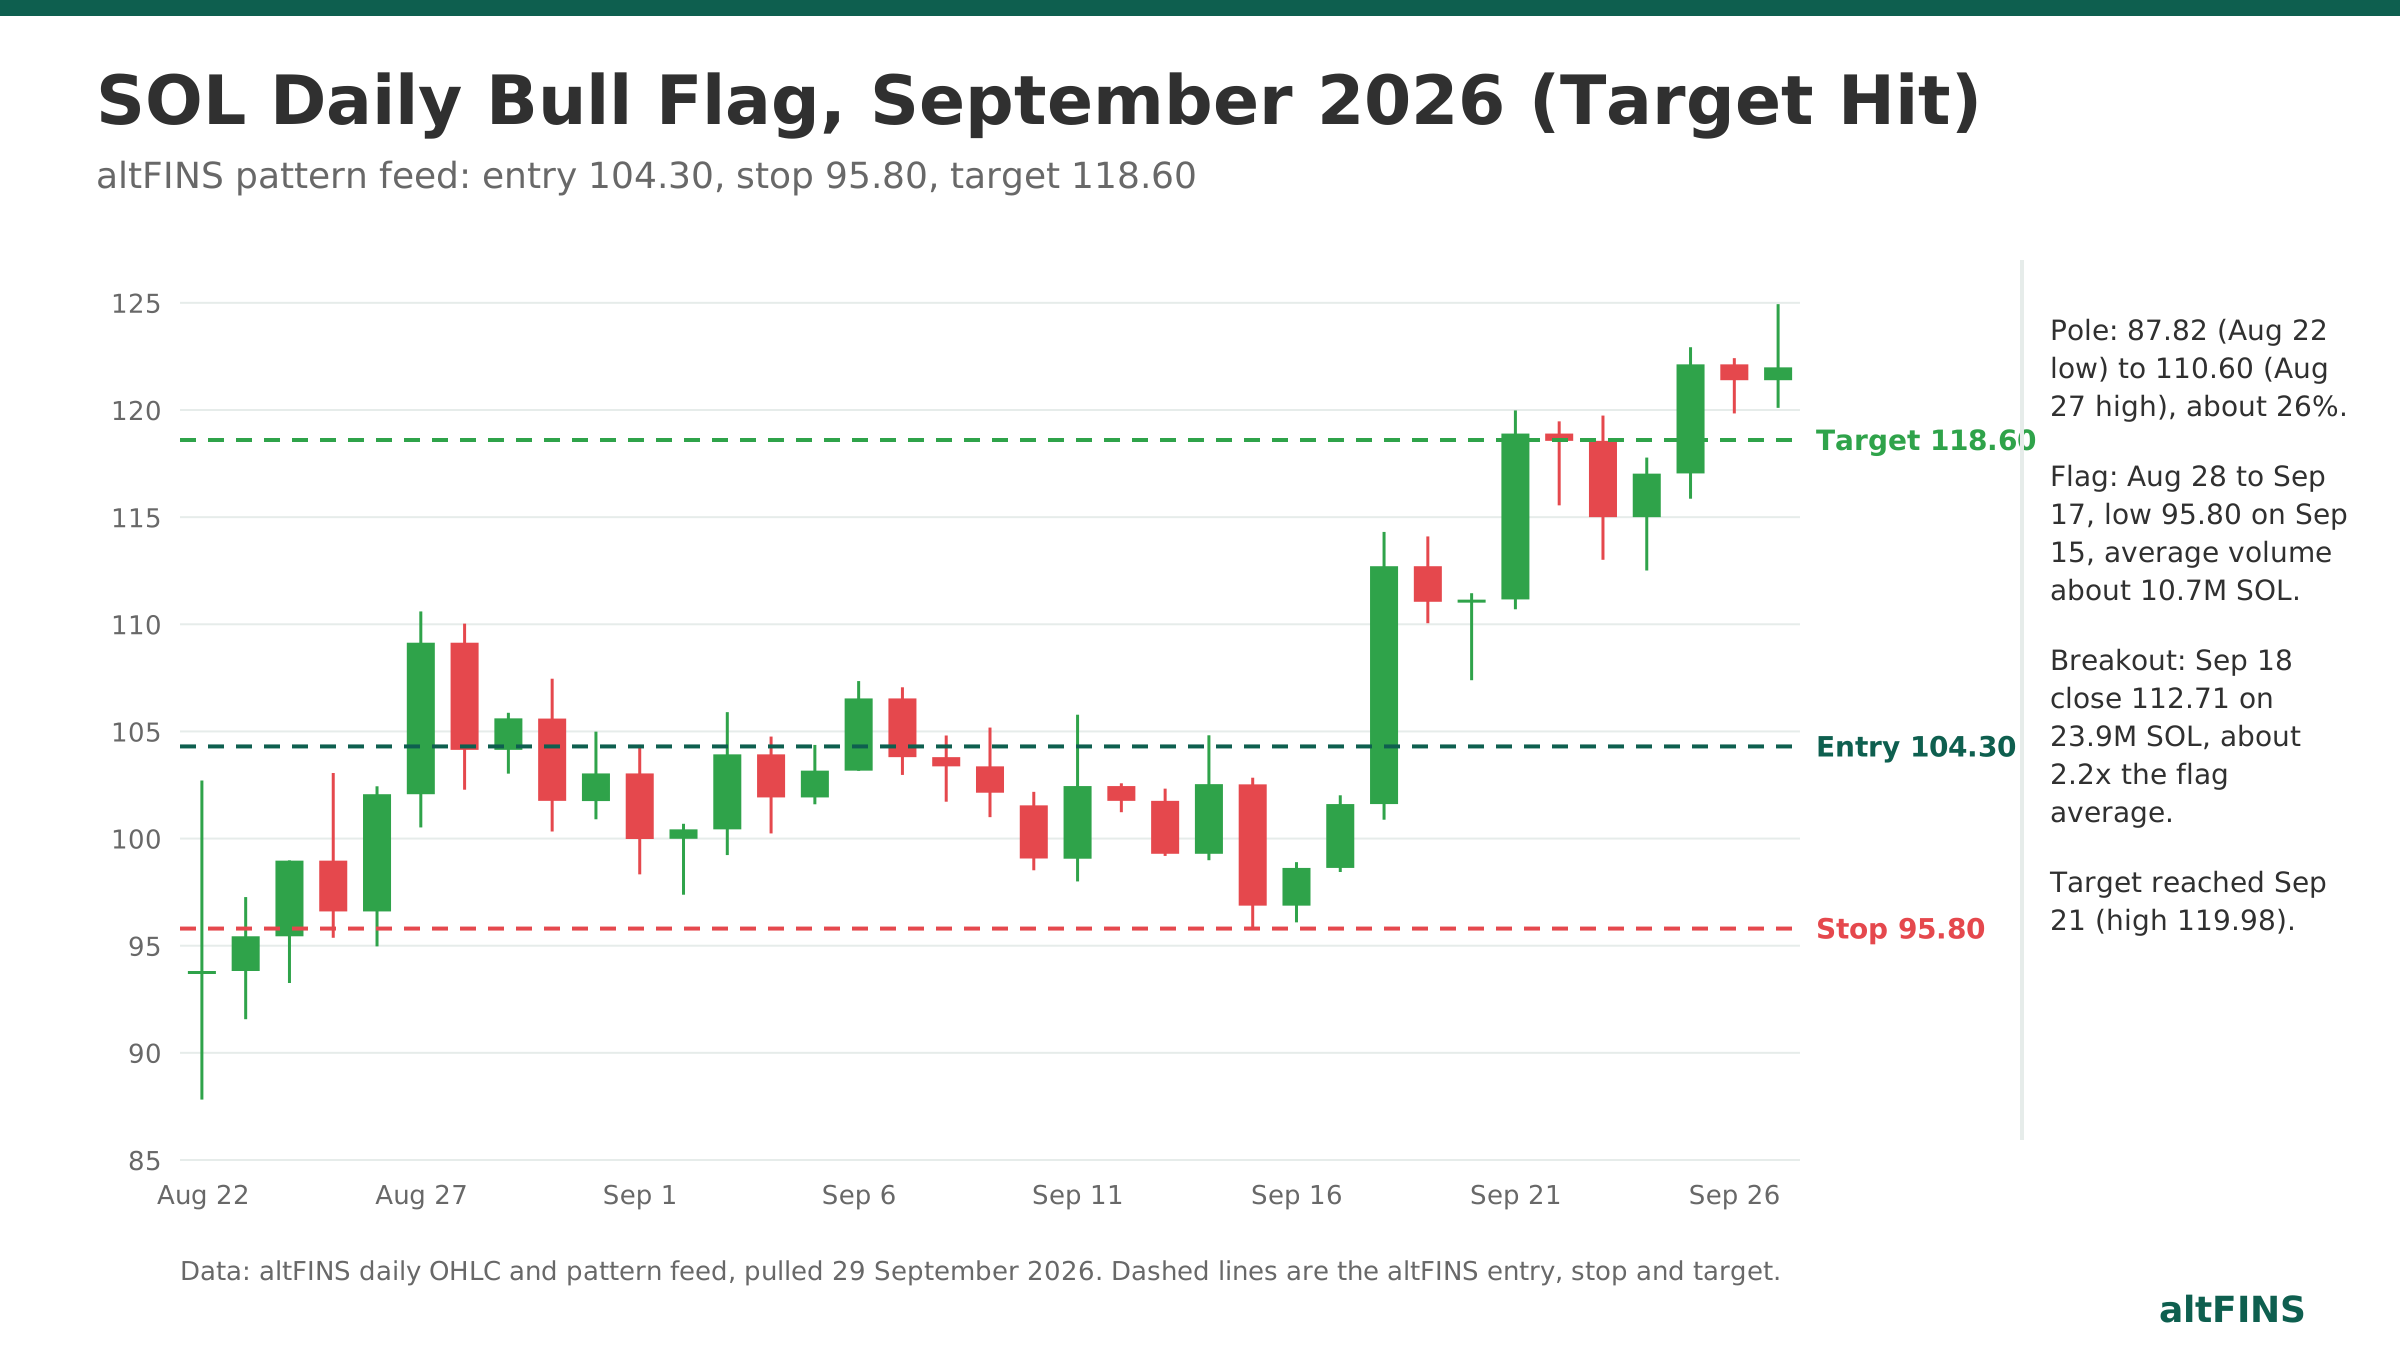
Takeaway: the flag was deeper than ideal, but the high volume breakout confirmed it and the target was hit in three days.
- Flagpole: SOL rallied from a low of 87.82 on August 22, 2026 to a high of 110.60 on August 27, a gain of about 26%.
- Flag: from August 28 to September 17 price drifted lower in a channel, with highs falling from 110.03 to 104.82 and a low of 95.80 on September 15. Average daily volume in the flag was about 10.7 million SOL.
- altFINS levels: entry 104.30, stop loss 95.80, target 118.60. That is 8.50 of risk for 14.30 of potential reward, about 1.7 to 1.
- Breakout: on September 18 SOL closed at 112.71 on 23.9 million SOL of volume, about 2.2 times the flag average.
- Target: reached on September 21, when SOL hit a high of 119.98. It closed at 121.99 on September 27.
The lesson is in the details. The flag retraced about 65% of the pole, deeper than the textbook limit of 50%, so on shape alone it was a borderline setup. What made it tradable was the volume: quiet in the flag, then more than double on the breakout. A conservative trader who waited for the September 18 close bought about 8 points above the pattern’s entry, which cut the reward to the target, so trailing the stop made more sense than a fixed exit.
altFINS CEO Richard Fetyko also walks through bull flag setups on SOL, KSM and NEAR in our trading videos, including how to pick the entry, stop loss and take profit.
Bull flag pros and cons
Takeaway: the bull flag is easy to spot and gives clear levels, but it fails often without volume confirmation.
| Pros | Cons |
|---|---|
| Easy to recognize on any timeframe | Many flags fail: Bulkowski’s break-even failure rate is 44% |
| Clear entry, stop and target levels | Only about half reach the full measured target |
| Trades with the trend, not against it | Intraday wicks cause false breakouts in 24/7 crypto markets |
| Short patterns, so capital is not tied up for long | Deep or long flags are hard to judge and often turn into ranges |
What is a failed bull flag?
Takeaway: when a bull flag breaks down instead of up, sellers have taken control.
A failed bull flag happens when price closes below the flag’s lower line, or breaks out and then falls straight back into the flag. Common causes are a pullback that retraces more than half the pole, a breakout on weak volume, a major resistance level just above the flag, or a flag that forms after a long, tired rally rather than early in a trend. Some traders treat a failed bull flag as a short signal in its own right, with a stop above the flag high.
🔎 How altFINS helps you find and trade bull flags
Takeaway: altFINS scans thousands of coins for flags so you only review setups that match your rules.
- Chart pattern recognition: the altFINS Chart Patterns section detects 26 patterns, including flags and pennants, on the 15 minute, 1 hour, 4 hour and daily charts. Filter by pattern type, direction (bullish) and stage (emerging or breakout). Each signal shows an entry, stop loss, target and the pattern’s historical success rate.
- Signals Summary: the Signals Summary collects fresh breakouts and other bullish setups in one list.
- Crypto screener: the crypto screener confirms the context with pre-set and custom filters: price above the 50 day SMA, RSI between 50 and 70, and unusual volume.
- Curated trade setups: the Technical Analysis section shows analyst-reviewed setups for top altcoins, many of them flags and channels.
- Alerts: set up chart pattern alerts to get notified the moment a flag breaks out.
New to patterns? Start with our overview of crypto chart patterns.
Frequently asked questions
Is a bull flag bullish?
Yes. A bull flag is a bullish continuation pattern that forms inside an uptrend: a sharp rally, a short downward or sideways pullback, then a breakout higher. The pullback can look bearish on its own, which confuses beginners. The signal only confirms when price closes above the flag’s upper trendline, ideally on volume clearly above average.
How long does a bull flag last?
On a daily chart, most bull flags last from a few days to about three weeks. On 4 hour and 1 hour crypto charts, the flag often forms in one to a few days. If the consolidation drags on much longer, it usually becomes a trading range or a different pattern, and the odds of a clean continuation drop.
How do you calculate a bull flag target?
Measure the flagpole from the start of the sharp rally to the top of the pole, then add that distance to the breakout price. For example, a 20 point pole and a breakout at 96 give a target of 116. Bulkowski’s data shows only 46% of flags reach the full target, so many traders take partial profit earlier.
What is the difference between a bull flag and a bull pennant?
Both form after a sharp rally and both signal continuation higher. The difference is the shape of the pause. A bull flag has two parallel lines that slope down or sideways. A bull pennant has converging lines that form a small symmetrical triangle. Traders use the same entry, stop and flagpole target method for both.
How reliable is the bull flag pattern?
The bull flag is moderately reliable. The altFINS pattern engine showed a 64% success rate for flags in September 2026. Bulkowski’s stock data shows a 44% break-even failure rate for upward breakouts and a 9% average rise. Reliability improves when the flag forms early in a strong uptrend, with falling flag volume and a high volume breakout.
What does it mean when a bull flag fails?
A failed bull flag means price closed below the flag’s lower line instead of breaking out, or broke out and quickly fell back inside the flag. It shows that sellers overpowered the buyers who created the pole. Exit longs at your stop below the flag low. Some traders then look for a short, using the flag high as the stop.
Verdict
The bull flag is one of the most practical continuation patterns in crypto because it gives you a clear entry, a clear stop and a measurable target. It works best early in a strong uptrend, with a shallow flag, fading volume in the pause and a high volume breakout. Treat the measured target as a best case, size positions carefully, and skip flags that retrace too deeply or break out on weak volume.
Want the next bull flag breakout on your radar? Open the altFINS Chart Patterns scanner and filter for bullish flags forming right now.
Disclaimer: This article is for educational purposes only and is not financial or investment advice. Chart patterns do not guarantee future results, and past performance, including the success rates quoted here, does not predict future returns. Cryptocurrency trading is highly risky, especially with leverage, and you can lose more than your initial investment. Do your own research and never trade money you cannot afford to lose.
