Search Knowledge Base by Keyword
-
Overview
-
- altFINS Platform Features - Your All-in-One Crypto Trading Tool
- Why use altFINS?
- Registered user benefits
- What kind of trader are you?
- How to trade cryptocurrencies?
- How to Trend Trade Crypto
- Trading Risk Management
- What Makes altFINS One of the Best Crypto Screeners in 2025?
- What Kind Of Crypto Trading Signals Are on altFINS?
-
-
Crypto Analytics
-
- Why use it?
- Overview > Charts > Scorecards > Performance > Trend > Oscillators
- Add table columns
- Detail view
- Charts
- Create a Trading Signal or Filter
- Find SMA crossover signals
- Crypto Time Intervals
- Create an alert
- Extreme Overbought coins Due for a Pullback
- Early momentum detection
- Crypto Trend Changes
- Why And How Use altFINS Crypto Screener
- Mastering Candlestick Patterns for Successful Crypto Trading
- What Are Fibonacci Retracement Levels?
- Essential Candlestick Patterns for Crypto Traders
- Using Local High to Spot Breakouts
- Oversold in Uptrend
- Strong Uptrend
- The Hammer Candlestick Pattern
- The Inverted Hammer Candlestick Pattern
- The Hanging Man Candlestick Pattern
- The Spinning Top Candlestick Pattern
- The Dragonfly Doji Candlestick Pattern
- What is "My Data" Option on altFINS?
- The Relative Volume (RVOL) Indicator
- New Local High
- New Local Low
- Buying Coins at an All-Time-High (ATH)
- Bullish Engulfing Candlestick Pattern: A Comprehensive Guide
- The Gravestone and Perfect Gravestone Doji Candlestick Patterns
- Support and Resistance Crypto: The Complete 2026 Guide for Traders
- What Makes altFINS One of the Best Crypto Screeners in 2025?
- Crypto Volume Tracker: Spot Unusual Volume and Momentum with altFINS
- Crypto Fundamental Data On altFINS: Identifying Projects with Real Traction
- What is ATR Indicator and How to Find It on altFINS?
- Combining fundamentals with TA
- Trading RSI and RSI Divergence
- What Is the 200-Day Simple Moving Average and How to Find It on altFINS
- Show all articles ( 24 ) Collapse Articles
-
- Overview
- Emerging v. Complete
- Mastering Key Levels in Crypto Trading: The Ultimate Guide
- Consecutive Candles
- Big Movement in Trading: Understanding and Trading the Volatility
- Fibonacci Patterns
- 10 steps for how to trade crypto using Crypto Chart Patterns
- How to trade Channel Down? | Crypto Chart Pattern
- Tutorial: Using Custom Chart Pattern Filters
- How To Set Up Chart Patterns Alerts?
- How To Trade Channel Up Pattern? | Crypto Chart Pattern
- How To Trade Ascending Triangles? | Crypto Chart Pattern
- How To Trade Bullish Flag Pattern? | Crypto Chart Pattern
- How To Trade Sideways Channel pattern? | Crypto Chart Pattern
- How To Trade Rising Wedge pattern? | Crypto Chart Pattern
- How To Trade Falling Wedge pattern? | Crypto Chart Pattern
- How To Trade Descending Triangle pattern? | Crypto Chart Pattern
- How To Trade Inverse Head and Shoulders pattern? | Crypto Chart Pattern
- What is "My Data" Option on altFINS?
- How To Trade Symmetrical Triangle Pattern? | Crypto Chart Pattern
- Crypto Chart Patterns Cheat Sheet
- How Does AI Help with Crypto Trading?
- Crypto Chart Patterns
- Show all articles ( 8 ) Collapse Articles
-
- Signals Summary Overview
- How To Find And Trade Crypto Pullbacks In Uptrend (Buying Dips)?
- Momentum & Up / Down Trend
- Range in Up/Down Trend
- Momentum
- How to trade EMA 12 / 50 crossovers?
- Moving Average Ribbons
- Strong Up / Down Trend
- Strong Up / Down Trend (Short Term)
- Strong Up / Down Trend (Medium Term)
- Strong Up / Down Trend (Long Term)
- Price / SMA Crossovers In Crypto
- What are Price / EMA Crossovers in crypto?
- SMA Crossovers
- EMA Crossovers
- Crypto Unusual Volume Gainers / Decliners
- New Up/Down trend (ADX)
- Bollinger Band - Price Broke Upper / Lower Band
- Strong Up / Down Trend and Oversold / Overbought
- Strong Up / Down Trend and Strong / Weak Ultimate Oscillator
- MACD (12,27,9) Signal Line cross
- MACD (12,27,9) Center Line cross
- Commodity Channel Index cross
- Overall Score of Oscillators (Oversold / Overbought)
- Relative Strength Index (9)
- Relative Strength Index (14)
- Relative Strength Index (25)
- Stochastic RSI (3, 3, 14, 14)
- Williams Percent Range (14)
- Bull Power
- MACD line
- Relative Strength Index (RSI) Divergence: Explained
- How to Trend Trade Crypto
- Early momentum detection
- Short-Medium-Long-Term Trend
- Relative Strength Index
- Uptrend and Fresh Bullish Momentum Inflection
- Using Local High to Spot Breakouts
- Oversold in Uptrend
- Strong Uptrend
- The Hammer Candlestick Pattern
- The Inverted Hammer Candlestick Pattern
- The Hanging Man Candlestick Pattern
- The Spinning Top Candlestick Pattern
- The Dragonfly Doji Candlestick Pattern
- What is "My Data" Option on altFINS?
- The Relative Volume (RVOL) Indicator
- New Local High
- New Local Low
- Bullish Engulfing Candlestick Pattern: A Comprehensive Guide
- The Gravestone and Perfect Gravestone Doji Candlestick Patterns
- Three White Soldiers Candlestick Pattern: A Comprehensive Guide
- How Does AI Help with Crypto Trading?
- What Kind Of Crypto Trading Signals Are on altFINS?
- Trading RSI and RSI Divergence
- Show all articles ( 40 ) Collapse Articles
-
- Volume
- OBV Divergence Indicator
- SMA vs. EMA
- Trading RSI and RSI Divergence
- Stochastic (14, 3, 3) (STOCH)
- What is CCI 20? (Commodity Channel Index 20)
- ADX
- MACD Line and MACD Signal Line
- Williams %R
- Stochastic RSI Fast
- Bull / Bear Power
- What is the UO: Ultimate Oscillator (7, 14, 28)
- Short Term Trend
- Medium Term Trend
- Long Term Trend
- Oscillator Rating
- Trading Multiple Time Frames
- Support and Resistance Crypto: The Complete 2026 Guide for Traders
- Polarity principle
- Early momentum detection
- Crypto Trend Changes
- MACD Histogram (H1, H2)
- What Are Fibonacci Retracement Levels?
- Using Local High to Spot Breakouts
- Oversold in Uptrend
- Strong Uptrend
- The Relative Volume (RVOL) Indicator
- New Local High
- Buying Coins at an All-Time-High (ATH)
- Crypto Volume Tracker: Spot Unusual Volume and Momentum with altFINS
- What is ATR Indicator and How to Find It on altFINS?
- Combining fundamentals with TA
- What Is the 200-Day Simple Moving Average and How to Find It on altFINS
- Show all articles ( 18 ) Collapse Articles
- How To Trade Symmetrical Triangle Pattern? | Crypto Chart Pattern
- New Local High
- New Local Low
- Three White Soldiers Candlestick Pattern: A Comprehensive Guide
- Crypto Volume Tracker: Spot Unusual Volume and Momentum with altFINS
- What is ATR Indicator and How to Find It on altFINS?
- What Is the 200-Day Simple Moving Average and How to Find It on altFINS
- Crypto Breakouts Explained: How to Spot Winning Trades with altFINS
- Getting Started with altFINS! Your Complete Step-by-Step Guide to Crypto Trading Success
-
-
Trade Crypto
-
- Initiating a trade
- Market vs. Limit order
- Refreshing tables
- Are derivatives such as futures, options and perpetual swaps supported?
- Does altFINS charge trading fees?
- Balances
- Open Orders
- Transaction History
- Order Book & Trades in Crypto
- Connecting to exchanges
- How to trade cryptocurrencies?
- Trading Risk Management
- Crypto Portfolio Tracker
- Connect To Bitget
- Connect to Coinbase
-
-
Research Hub
-
Crypto Education
-
- Where To Buy And Sell Cryptocurrency?
- When Is The Best Time To Buy And Sell Cryptocurrency?
- Crypto Profits: Full Guide How to Take Profits In Cryptocurrency
- What Is Crypto Copy Trading?
- What Is Leverage Trading Cryptocurrency?
- Crypto Arbitrage Trading: Meaning, Signals And Opportunities
- Crypto Hot Wallet vs. Cold Wallet: What is the Difference
- Crypto Trading Strategies
- Difference Between Crypto Fundamental and Technical Analysis
- List of TOP Decentralized Exchanges 2025
- What is a Crypto Prop Trading? A Complete Guide to Crypto Proprietary Trading Firms
- The Best Crypto Prop Trading Firms
- Altrady Review: How To Achieve Optimal Trade Execution
- Crypto AI Agents Explained: Top 10 AI Agent Cryptos by Market Cap to Watch in 2025
- The Ultimate Guide to Smart Money Whales in Crypto
- The Ultimate Guide to Cryptocurrency ETFs in 2025
- How to Control Your Emotions While Trading Crypto (and How altFINS Can Help)
- HyroTrader Review: A Comprehensive Analysis
- Best Crypto Trading Bots in 2025: Coinrule vs Cryptohopper vs 3Commas
- How to Automate Your Crypto Trading with Coinrule
- OneFunded Review: Pros & Cons Revealed
- Show all articles ( 6 ) Collapse Articles
-
-
About
-
AI Features
-
altFINS API
- What Is the altFINS Analytics Data API?
- Who Is the altFINS Data API For?
- Real-World Use Cases of the altFINS API
- altFINS Crypto Market & Analytical Data API
- How to Create an altFINS API Key (Step-by-Step Guide)
- The Ultimate Guide to Cryptocurrency MCP Servers in 2026: Complete Comparison for Traders, Developers & Trading Platforms
Crypto Trend Changes
Introduction
altFINS automatically rates crypto trends across Short-, Medium-, and Long-term horizons using a 5-level system (Strong Up → Strong Down). Traders can spot opportunities by tracking trend upgrades/downgrades, such as assets recently improving from Neutral → Up. In Downtrends—when most coins trade below the 200-day MA—traders often short bounces, but altFINS also helps identify early trend reversals with Short-term trend improvements. Use pre-set scans, custom filters, alerts, and the AI Copilot to quickly find actionable trade setups.
Crypto Trend Upgrade / Downgrade
altFINS identifies and rates crypto trend from Strong Up, Up, Neutral, Down, to Strong Down, across three time horizons Short-term, Medium-term, and Long-term.
Identifying trends is a key pillar to successful trading strategies, especially trend trading.
As the old adage goes. Trend is your friend. Trade with the trend.
If you get the trend right, you dramatically improve your chances of winning.
With this analytic, traders can also find coins when their trend rating changes (i.e. upgrade or downgrade).
Let’s say you’re looking for coins that have had a recent (last 3 days) improvement (upgrade) in their Medium-Term trend specifically from Neutral to Up or from Up to Strong Up.  Check out actual results.

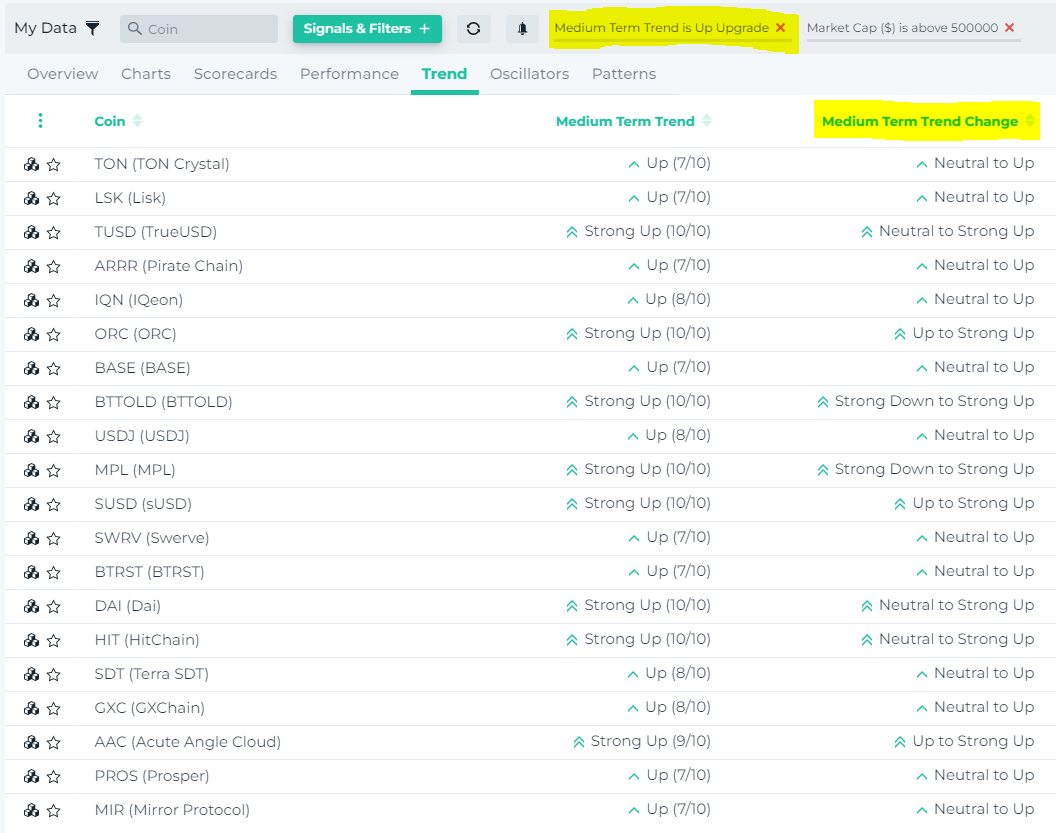
Watch a 5 min tutorial video that demonstrates this new powerful capability, how to create and save this filter, and how to create an alert out of it so you don’t miss any trading opportunities.
How to Spot Trend Reversals
Crypto markets are firmly in a Downtrend, trading below their 200-day Moving Averages. (some exceptions here)
In downtrends, traders make money by Short Selling the bounces.
But naturally, we keep an eye on potential trend reversals. And there have been some early signs.
A simple way to spot early trend reversals is by using altFINS’ automated trend ratings and pre-set market scans.
Our systems scores trends for over 2,000 assets across Short- Medium- and Long-term horizonts.
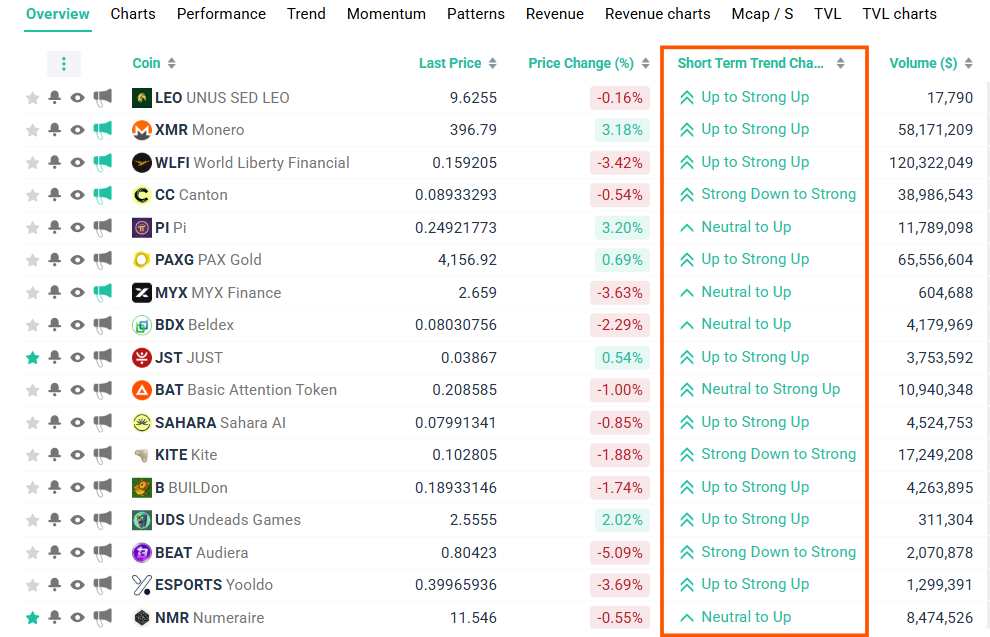
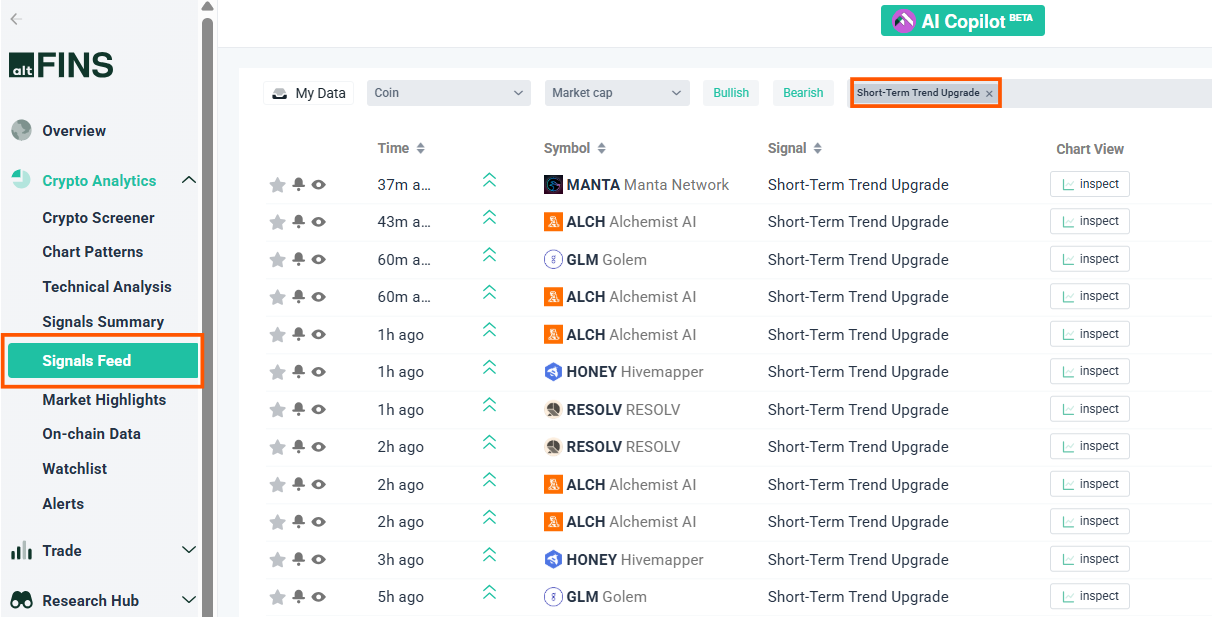
So let’s find assets where Short-Term trend has recently changed to Up or Strong Up (see live results here):
Crypto Screener: Short-Term Trend Upgrade

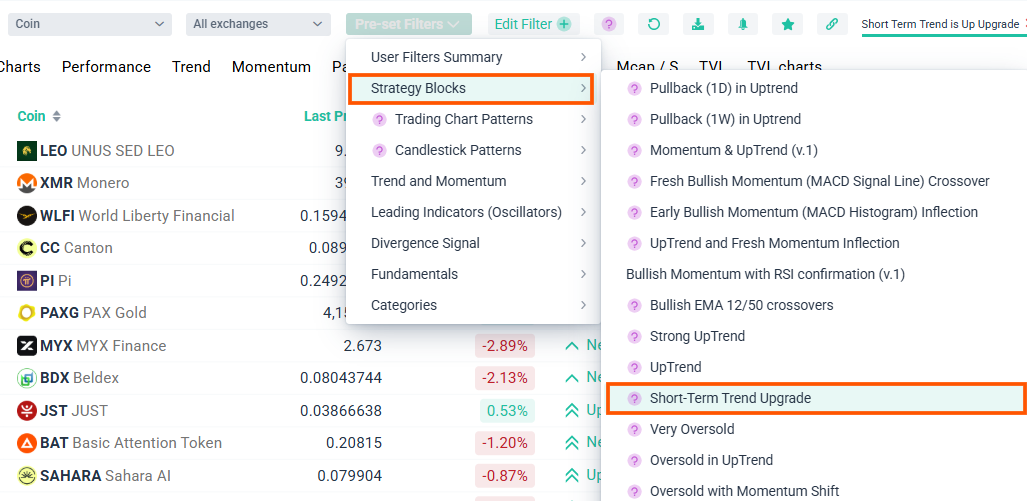
Crypto Screener: Pre-Set Filter

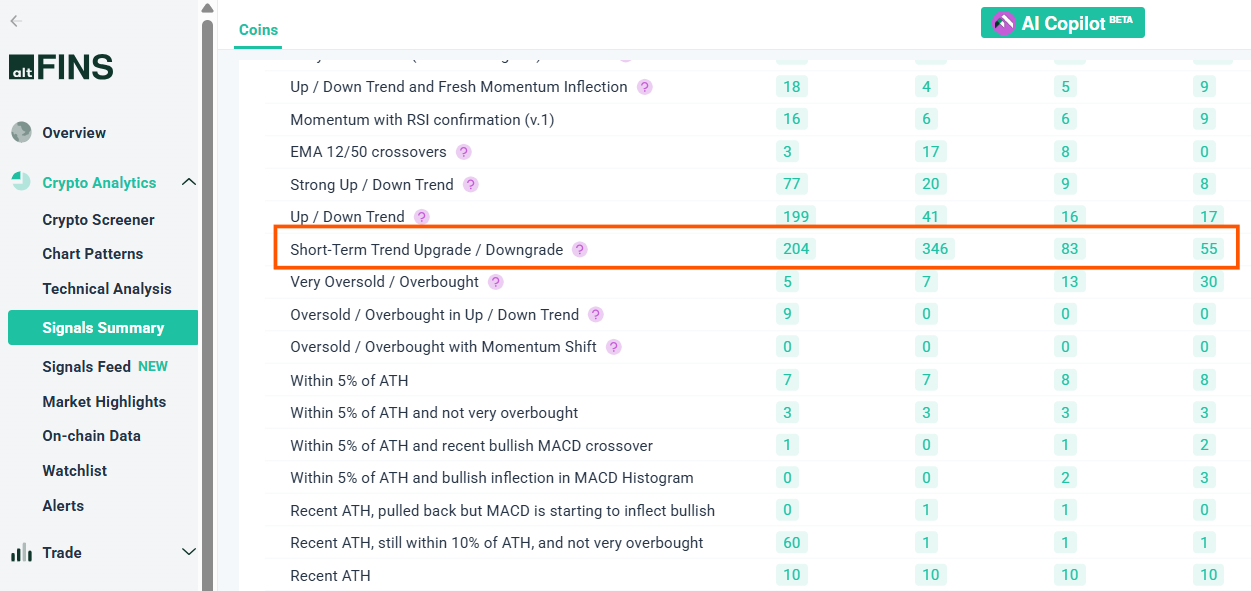
altFINS Signals Summary

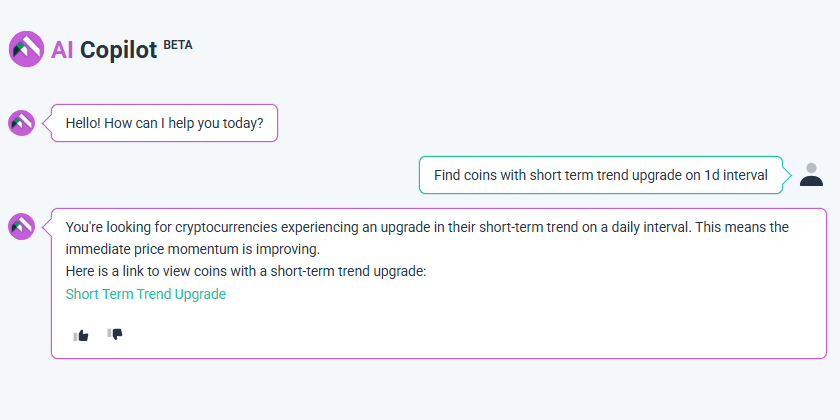
Ask altFINS AI Copilot

Crypto Signals Feed

Go ahead and try these pre-set market scans now:
FAQ
1. What are altFINS trend ratings?
Trend ratings classify assets into Strong Up, Up, Neutral, Down, or Strong Down across Short-, Medium-, and Long-term horizons.
2. Why are trend ratings important?
Trading with the trend increases your chance of success. Identifying upgrades/downgrades helps you catch early momentum shifts.
3. What is a trend upgrade or downgrade?
This is a change in an asset’s trend score—for example, Neutral → Up or Up → Strong Down. Upgrades may signal bullish momentum; downgrades may indicate weakness.
4. Can I filter for coins with recent trend upgrades?
Yes. You can create filters that detect upgrades within any time window (e.g., last 3 days) and across any timeframe (Short-, Medium-, Long-term).
5. How do I get alerts for trend changes?
Create a custom filter → Save it → Set an alert. altFINS will notify you when assets meet the criteria.
6. How does altFINS help identify trend reversals?
Monitor Short-term trend upgrades to Up or Strong Up. These often act as early reversal signals before Medium- or Long-term trends follow.
7. What if the market is in a Downtrend?
When assets trade below their 200-day MA, markets are typically bearish. Traders often short bounces but can still watch for early reversal signs using altFINS scans.
8. Where can I see pre-set scans?
You can access them directly through:
-
Crypto Screener
-
Signal Summary
-
Signals Feed
9. What does the AI Copilot do?
It helps you interpret signals, build filters, generate strategies, and find relevant market opportunities—instantly.