Search Knowledge Base by Keyword
Bullish Engulfing Candlestick Pattern: A Comprehensive Guide
The bullish engulfing candlestick pattern is a widely recognized and respected signal in technical analysis. Traders often use it to spot potential market reversals and identify opportunities to enter long positions. This guide will explain its concept, formation, application, and limitations as a double candlestick pattern.
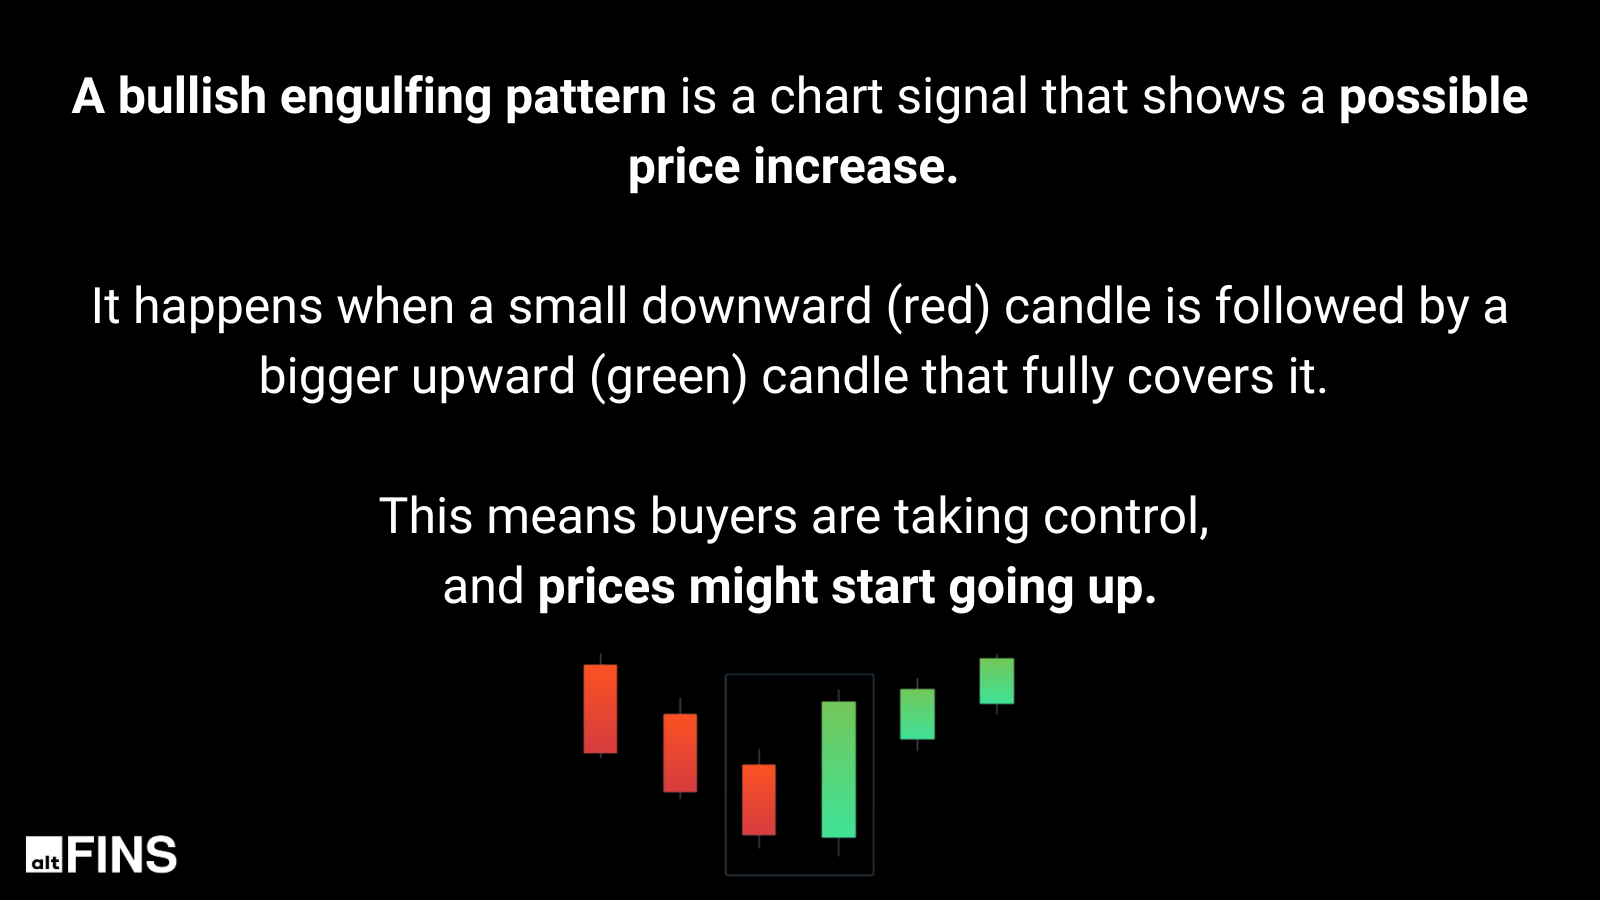
What is a Bullish Engulfing Candlestick Pattern?
A bullish engulfing candlestick pattern is a two-candlestick reversal pattern that signals a potential shift from a bearish to a bullish trend. It forms during a downtrend when a small bearish candlestick (red or black) is followed by a larger bullish candlestick (green or white), whose body completely engulfs the body of the previous bearish candlestick.
This pattern is significant because it represents a complete takeover by buyers after a bearish phase, indicating strong upward momentum. Traders interpret this pattern as a signal to buy or close short positions, anticipating a price increase.
Based on our experience, this pattern is useful for short-term trading signals, not that useful for identifying major or lasting trend reversal but rather short-term trend reversals for a few candles after the appearance of the candle pattern. It does seem to have a relatively high success rate (over 70%). It works particularly well if the pattern appears after 3 or more red candles.
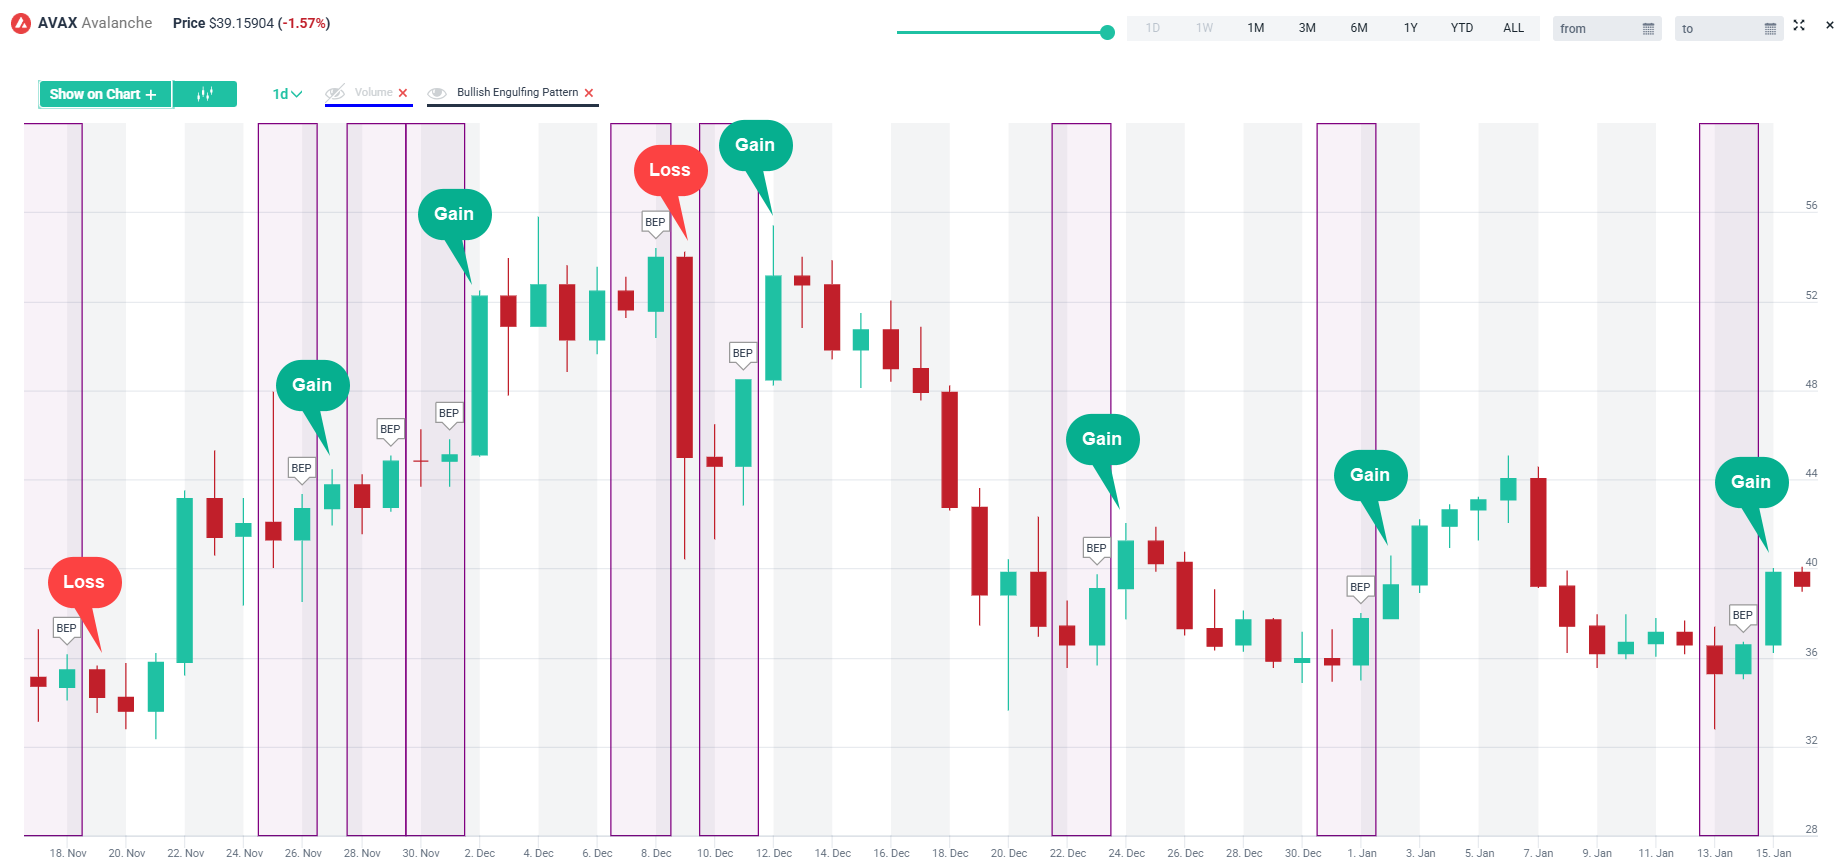
Highly Effective Candlestick Pattern
The chart highlights bullish engulfing candlestick patterns on AVAX’s price chart, showing mostly successful trades (“Gain”) with a few losses. The win rate appears high, likely above 70%, suggesting bullish engulfing patterns are generally reliable.
Key Features of the Bullish Engulfing Pattern
- First Candlestick: A small bearish (red/black) candlestick that reflects continued selling pressure.
- Second Candlestick: A large bullish (green/white) candlestick that opens below the first candlestick’s close and closes above its open, completely engulfing it.
- Trend Reversal: Typically appears after a downtrend, signaling a potential reversal to the upside.
- Volume: Higher volume on the bullish candlestick strengthens the reliability of the pattern.
How the Pattern Forms
The bullish engulfing pattern forms under these conditions:
- Downtrend: The market is in a downward trajectory.
- Small Bearish Candle: A short bearish candlestick indicates a continuation of selling pressure.
- Large Bullish Candle: The next candlestick opens lower but closes significantly higher, overshadowing the previous candlestick.
- Market Sentiment Shift: The pattern reflects a decisive shift in market sentiment, with buyers overtaking sellers.
How to Identify a Bullish Engulfing Pattern on altFINS?
altFINS makes it easy to find Bullish Engulfing Patterns with a few clicks. Traders have several options:
1. Crypto Screener: Pre-set Filters – Candlestick Patterns – 2 Candlesticks – Engulfing (Bullish)
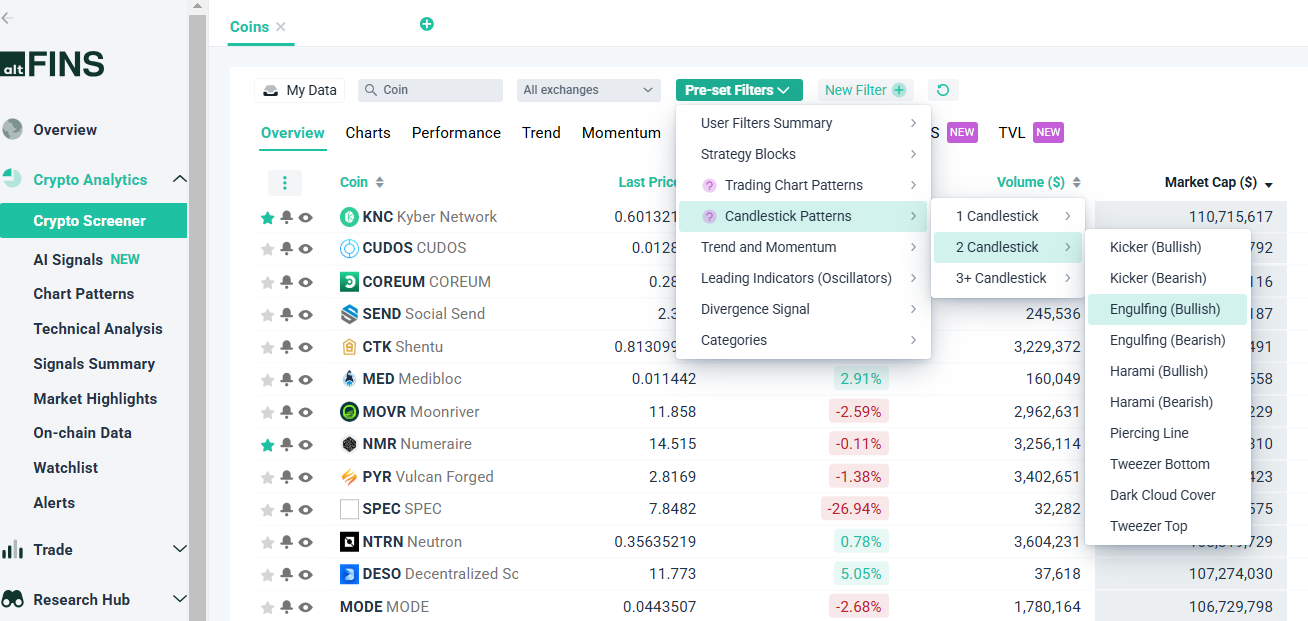
Go to Crypto Screener
2. Crypto Screener: New Filter – Candletick Patterns – 2 Candle Patterns – Bullish Engulfing Pattern
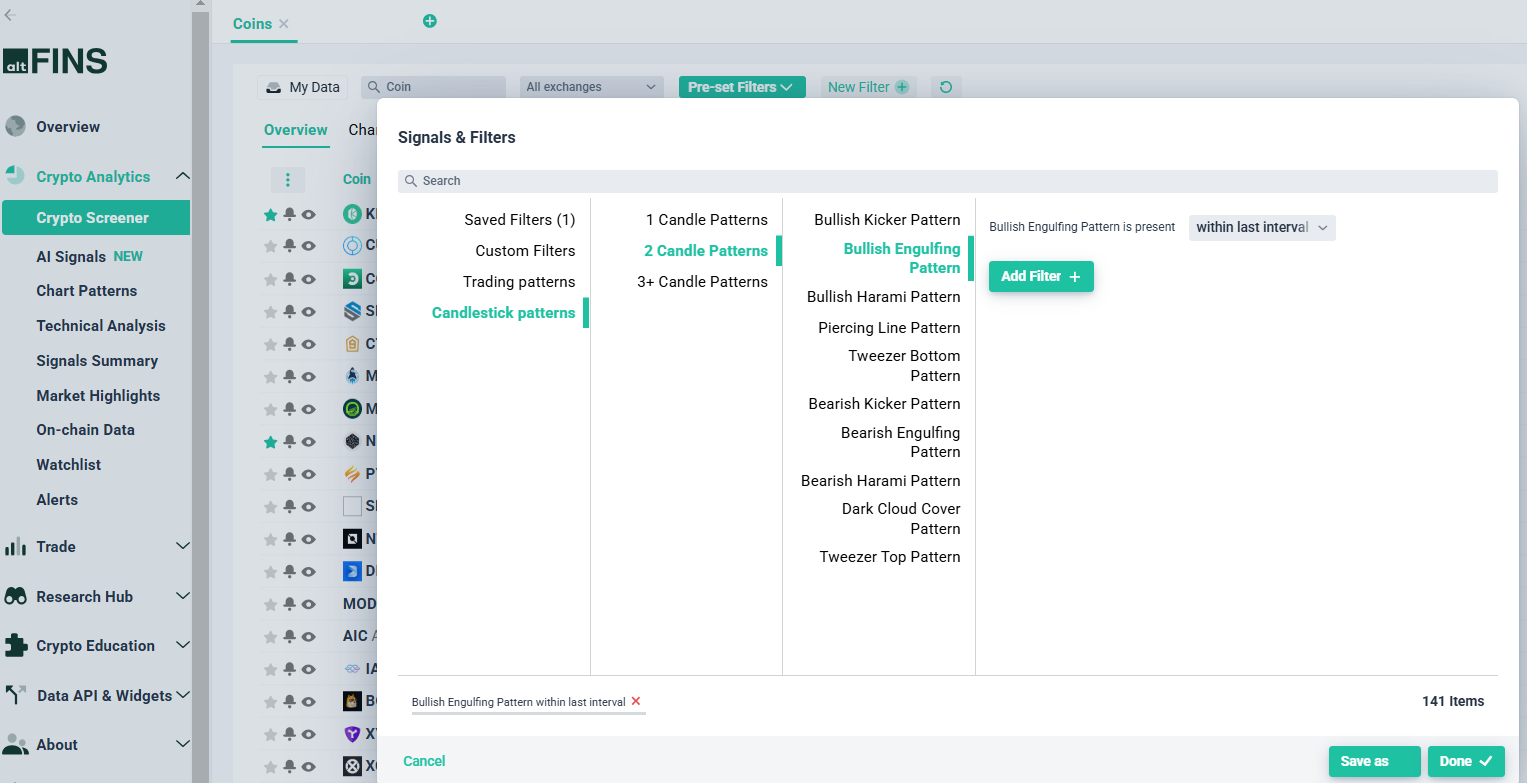
Go to Crypto Screener
3. Signals Summary
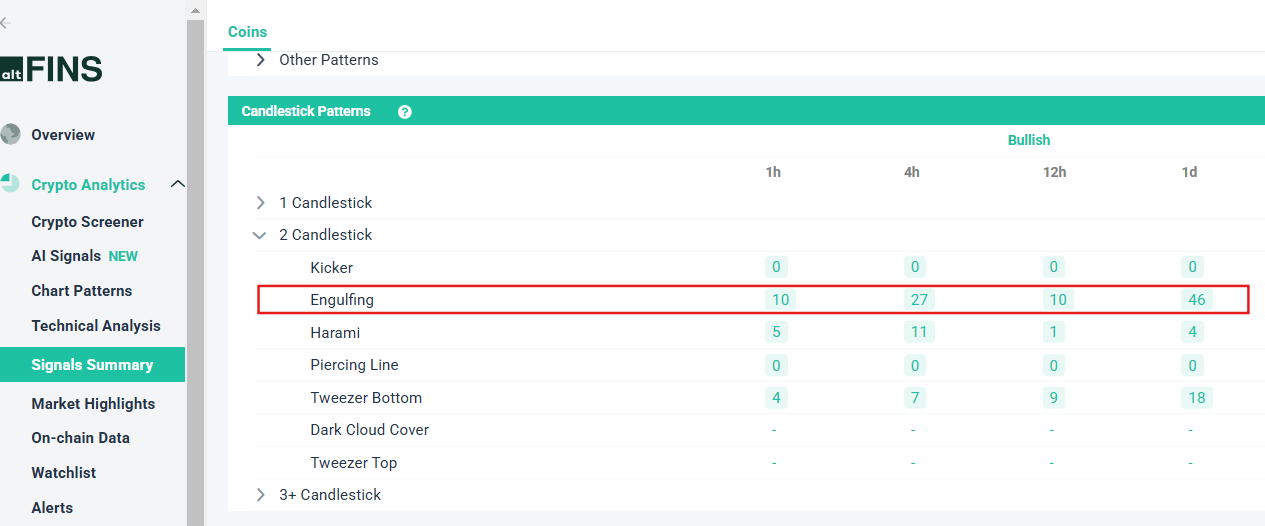
See Signals Summary
Showing Bullish Engulfing Patterns on Charts
There are several options how to show Bullish Engulfing patterns on charts:
After selecting the patterns from Pre-set filters in Screener or clicking on Signals Summary, ensure you navigate from the Overview tab to the Charts tab:
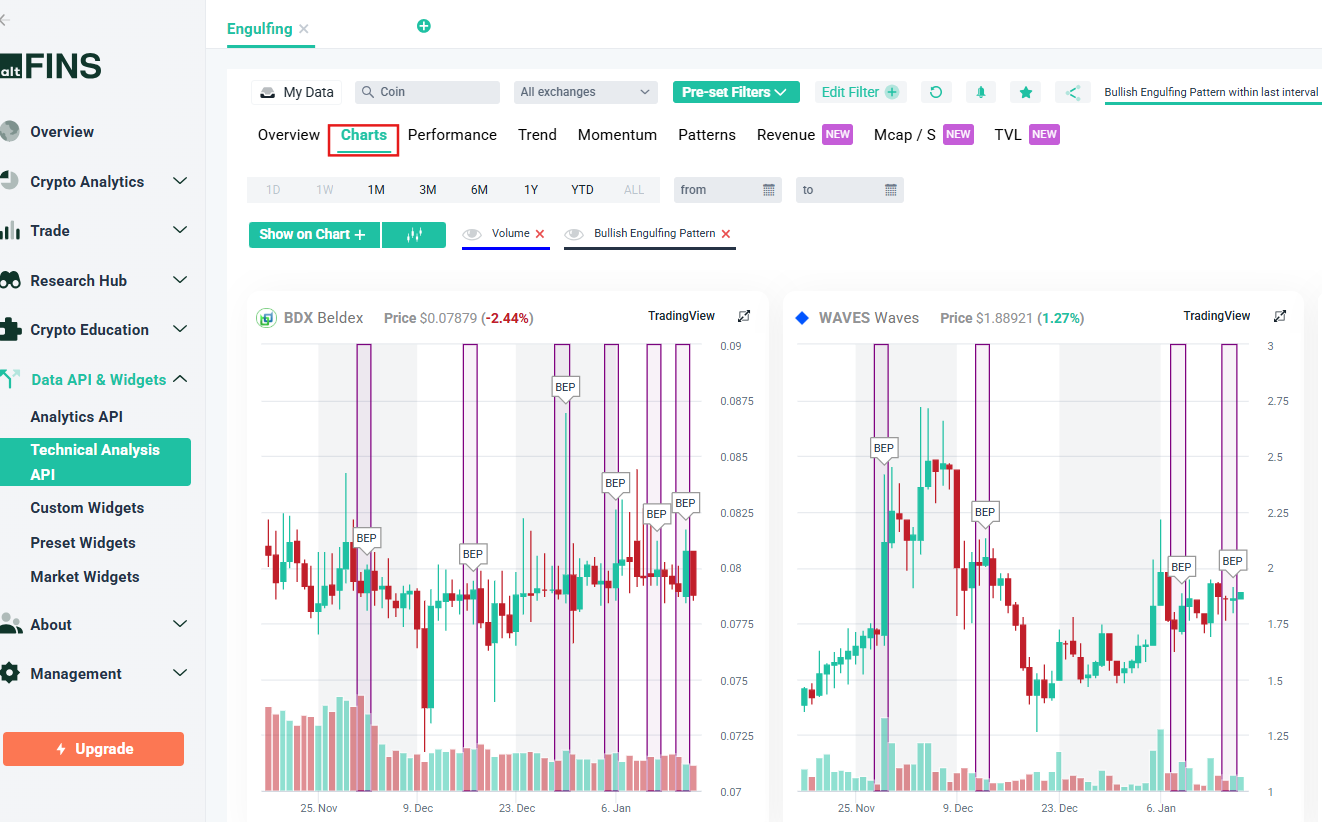
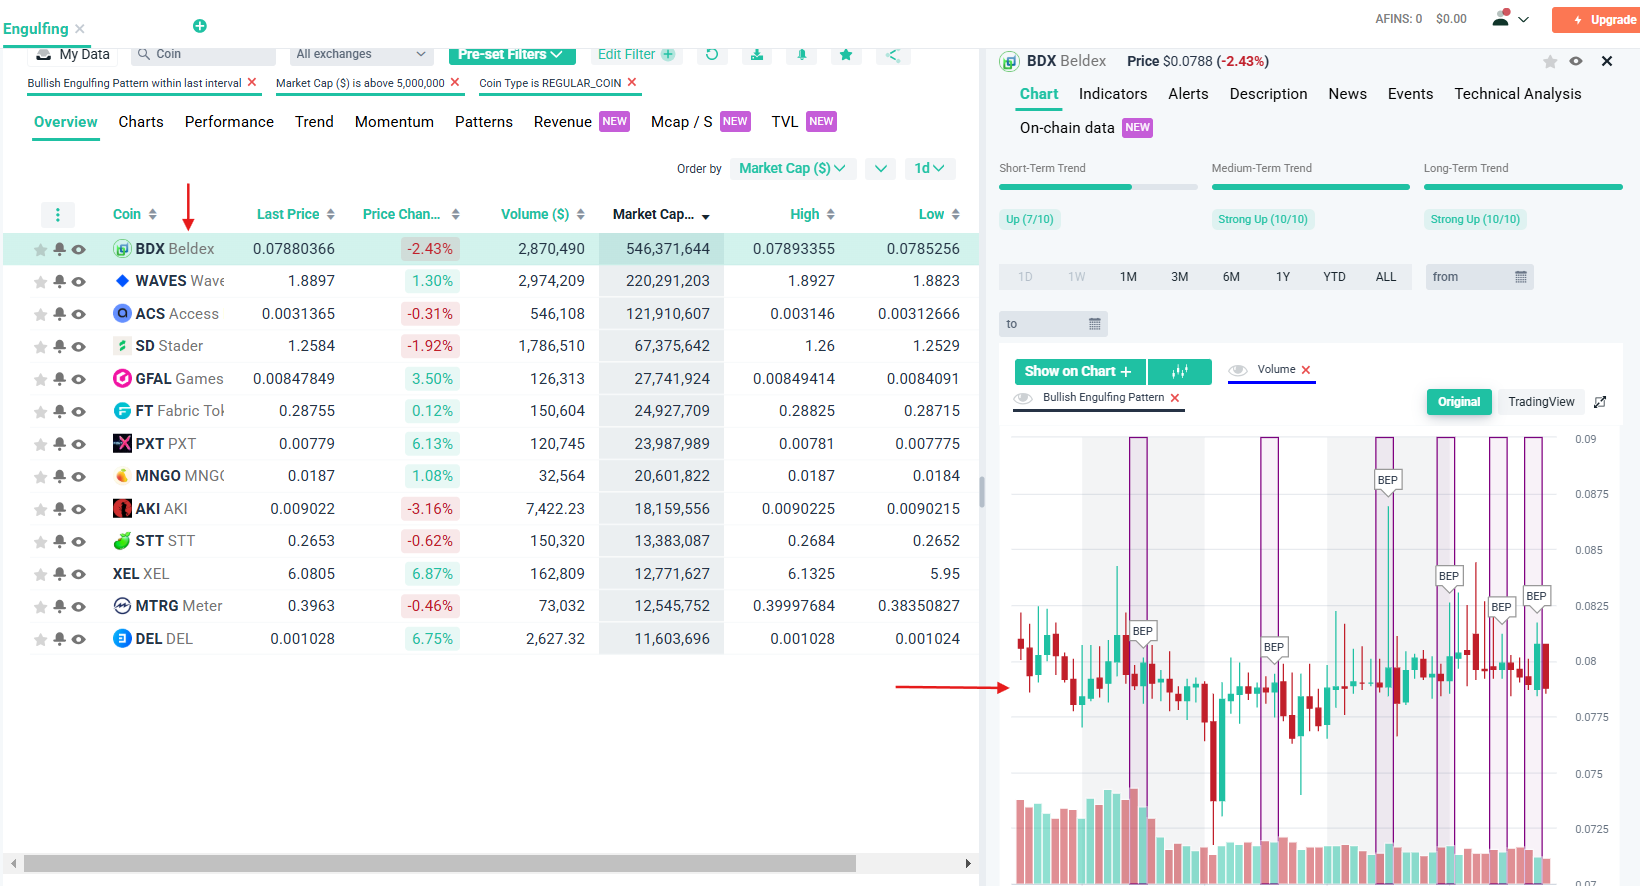
When you click on any coin from the results, the details section will display a chart featuring BEP (Bullish Engulfing Patterns).
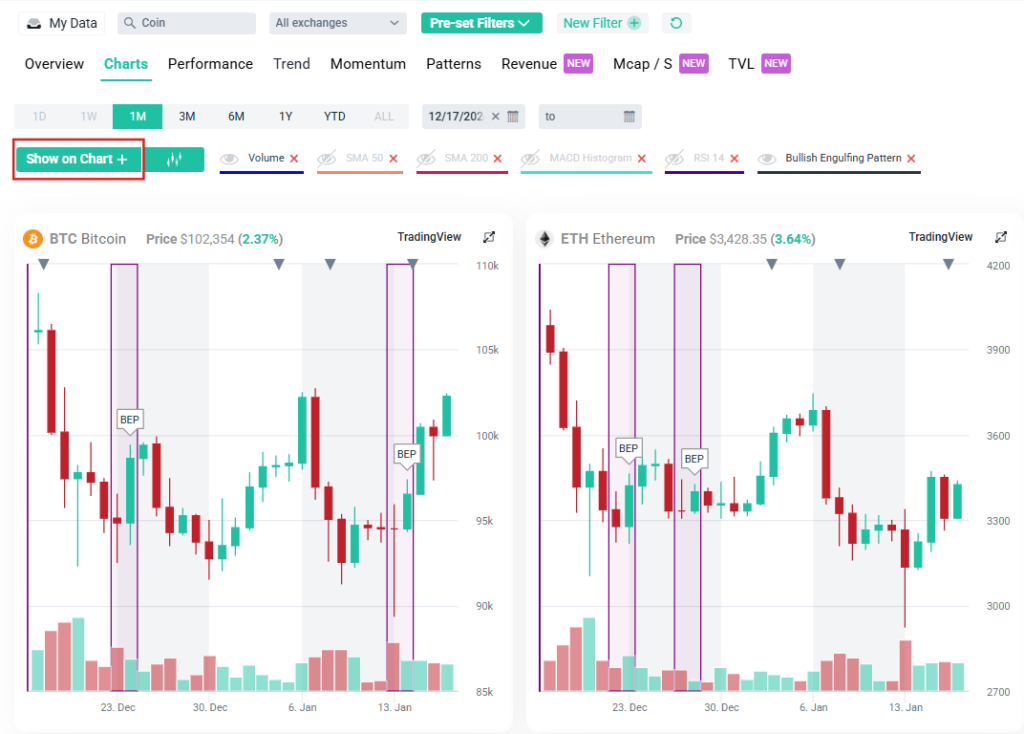
BEP (Bullish Engulfing Patterns) are displayed on each chart after selecting the Bullish Engulfing Pattern option in the “Show on Chart” menu. In this case, no filter is being used at all.

How to Trade with Bullish Engulfing Patterns
Here’s how traders use this pattern in their strategies:
- Enter a Long Position: Once the pattern is confirmed, traders typically buy.
- Set a Stop Loss: Place a stop loss below the low of the bullish candlestick to limit risk.
- Define a Target: Use support and resistance levels or Fibonacci retracement to set profit targets.
Improving Pattern Accuracy
Enhance the reliability of bullish engulfing patterns with these methods:
- Volume Analysis: Ensure the bullish candlestick has higher volume than the bearish one.
- Market Volatility: Avoid trading during highly volatile periods that can produce false signals.
- Combine Indicators: Use tools like moving averages, RSI, or MACD for confirmation.
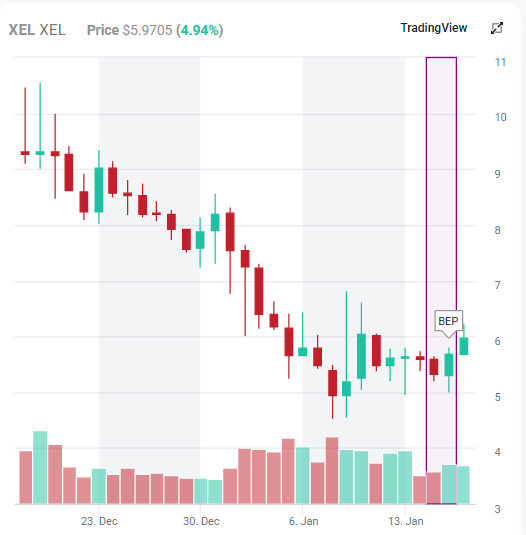
Example of a Bullish Engulfing Patterns
XEL was in a downtrend. Over two days:
- Day 1: A small bearish candlestick forms, closing lower than it opened.
- Day 2: A large bullish candlestick opens below Day 1’s close but closes above Day 1’s open, engulfing it.
This pattern indicates that buyers are gaining control, prompting traders to consider buying XEL.
See all coins with Bullish Engulfing Pattern here.
Benefits of the Bullish Engulfing Pattern
A trend reversal pattern signals a shift from bearish to bullish sentiment, helping traders spot potential buying opportunities. It provides guidance for risk management by suggesting clear stop-loss levels below the pattern and is versatile enough to be used across different markets and timeframes.
- Works well for Short-Term Trading (1 period after the pattern – so 1 day if using daily time interval or 1 hour if using hourly time interval)
- Provides Entry Signals: Helps traders identify potential buy opportunities.
- Risk Management: Offers clear stop loss placement below the pattern.
- Adaptable: Works across markets and timeframes.
Limitations of the Bullish Engulfing Pattern
The Bullish Engulfing pattern isn’t foolproof—it can produce false signals in volatile conditions, needs thorough testing to confirm its effectiveness in your market, depends on high trading volume for accuracy, and lacks specific profit targets, so it’s best used alongside other trading strategies.
- False Signals: May appear during volatile periods without leading to a true reversal.
- Volume Dependency: Low volume reduces reliability.
- No Price Targets: Candlestick patterns don’t provide specific profit targets.
Tips for Successful Trading
Successful trading requires a combination of technical analysis, market awareness, and strategic tools like altFINS. When using altFINS, take advantage of its powerful analytics to confirm candlestick patterns with additional indicators and uncover potential opportunities. Monitoring broader market conditions, trends, and news remains essential for understanding price movements in context.
Watch Tutorial Video – How To Trade Candlestick Patterns
Conclusion
The bullish engulfing candlestick pattern is a powerful tool for traders looking to capitalize on trend reversals. While it provides valuable insights, it should be used alongside other technical analysis tools and strategies to maximize its effectiveness. With careful analysis and risk management, this pattern can significantly enhance your trading success.
What kind on Candlestick Patterns can be found on altFINS?

altFINS crypto screener allows traders to create custom filters based on Candlestick patterns. These patterns include 1-Candle Patterns, 2-Candle Patterns, and patterns involving 3 or more candles. Traders can enhance their trading strategies by selecting from an additional 120 technical indicators. Candlestick patterns also appear in the Pre-set filter and Signal Summary.
On the altFINS platform, traders can access a comprehensive range of candlestick patterns categorized into 1-candle, 2-candle, and 3+ candle patterns. Here’s an overview of the patterns available:
1-Candle Patterns
These patterns provide concise insights into market sentiment and potential reversals:
- Hammer Pattern – Bullish reversal; small body near the top with a long lower shadow.
- Inverted Hammer Pattern – Bullish reversal; small body near the bottom with a long upper shadow.
- Dragonfly Doji Pattern – Bullish reversal; small body near the top with a long lower shadow.
- Bullish Spinning Top Pattern – Indecision; small body with long shadows, possibly signaling momentum shifts.
- Hanging Man Pattern – Bearish reversal; small body near the top with a long lower shadow.
- Shooting Star Pattern – Bearish reversal; small body near the bottom with a long upper shadow.
- Gravestone Doji Pattern – Bearish reversal; small body near the bottom with a long upper shadow.
- Bearish Spinning Top Pattern – Indecision after an uptrend; small body with extended shadows.
- Doji Pattern – Signals indecision; opening and closing prices are nearly identical.
2-Candle Patterns
These patterns provide nuanced insights and can confirm or negate potential trends:
- Bullish Kicker Pattern – Bullish reversal; second candle opens higher than the first.
- Bullish Engulfing Pattern – Bullish reversal; larger bullish candle engulfs the prior bearish candle.
- Bullish Harami Pattern – Bullish reversal; small bullish candle within the previous bearish candle’s body.
- Piercing Line Pattern – Bullish reversal; second candle opens higher and closes above the midpoint of the first candle.
- Tweezer Bottom Pattern – Bullish reversal; two candles share identical lows.
- Bearish Kicker Pattern – Bearish reversal; second candle opens lower than the first.
- Bearish Engulfing Pattern – Bearish reversal; larger bearish candle engulfs the prior bullish candle.
- Bearish Harami Pattern – Bearish reversal; small bearish candle within the previous bullish candle’s body.
- Dark Cloud Cover Pattern – Bearish reversal; second candle opens higher but closes below the midpoint of the first.
- Tweezer Top Pattern – Bearish reversal; two candles share identical highs.
3+ Candles Patterns
These patterns are useful for analyzing more complex market dynamics:
- Morning Star Pattern – Bullish reversal; star flanked by bearish and bullish candles.
- Morning Doji Star Pattern – Bullish reversal; Doji flanked by bearish and bullish candles.
- Bullish Abandoned Baby Pattern – Bullish reversal; gap between two Doji candles.
- Three White Soldiers Pattern – Strong bullish momentum; three consecutive bullish candles.
- Three Line Strike Bullish Pattern – Reversal; three bullish candles following a downtrend.
- Three Inside Up Pattern – Bullish reversal; small bullish candle within a prior bearish candle.
- Evening Star Pattern – Bearish reversal; star flanked by bullish and bearish candles.
- Evening Doji Star Pattern – Bearish reversal; Doji flanked by bullish and bearish candles.
- Bearish Abandoned Baby Pattern – Bearish reversal; gap between two Doji candles.
- Three Black Crows Pattern – Strong bearish momentum; three consecutive bearish candles.
- Three Line Strike Bearish Pattern – Reversal; three bearish candles following an uptrend.
- Three Inside Down Pattern – Bearish reversal; small bearish candle within a prior bullish candle.
- Three Outside Down Pattern – Bearish continuation; two bearish candles surrounding a bullish candle.
How to Use These Patterns on altFINS
These patterns serve as valuable tools for analyzing market movements. Reversal patterns, such as the Hammer or Shooting Star, help traders anticipate potential trend changes. Continuation patterns, like Three White Soldiers or Three Black Crows, confirm the ongoing direction of a trend, providing confidence in sustained momentum. Meanwhile, indecision patterns, such as Doji or Spinning Tops, highlight market uncertainty, signaling potential pauses or turning points. Recognizing these patterns can enhance decision-making and improve trading strategies.
altFINS simplifies the analysis by offering these patterns within preset filters, custom filters, and the signals summary sections, enabling traders to identify and act on opportunities quickly.
Read also an article:
Mastering Candlestick Patterns for Successful Crypto Trading
Essential Candlestick Patterns for Crypto Traders
The Dragonfly Doji Candlestick Pattern
The Hammer Candlestick Pattern
The Inverted Hammer Candlestick Pattern
The Hammer Candlestick Pattern
The Gravestone and Perfect Gravestone Doji Candlestick Patterns
The Spinning Top Candlestick Pattern
The Hanging Man Candlestick Pattern
What is Candlestick Pattern (source: Investopedia)
