Search Knowledge Base by Keyword
The Hanging Man Candlestick Pattern
TL;DR: The Hanging Man Pattern
The Hanging Man is a bearish reversal candlestick that appears at the peak of an uptrend. It features a small body at the top and a long lower shadow (at least twice the body’s length), signaling that sellers are starting to test the market’s strength.
-
What it Signals: It warns that despite a price recovery by the close, significant selling pressure occurred during the session, suggesting the uptrend is losing steam.
-
Trading with altFINS: You can automate the search for this pattern using the altFINS Crypto Screener. Simply use the Pre-set Filters for 1-candle patterns or create a Custom Filter to find Hanging Man setups across 3,000+ altcoins and multiple timeframes.
-
Strategy Tip: Never trade a Hanging Man alone. Always wait for bearish confirmation (the next candle closing below the Hanging Man’s body) and check for confluence with resistance levels or high volume.
Detailed Characteristics of the Hanging Man Pattern
The Hanging Man candlestick pattern is a significant indicator within technical analysis, often signaling the potential for a bearish reversal. This pattern appears at the top of an uptrend and is recognized by its small body and long lower shadow. It indicates that selling pressure is starting to outweigh buying pressure after a price increase. This guide delves deep into the Hanging Man, offering advanced insights and strategies for effectively utilizing this pattern in trading.
Understanding the Hanging Man
The Hanging Man is characterized by a small body at the upper end of the trading range, with a long lower shadow that is typically twice the length of the body. This structure suggests that during the session, sellers were able to push the price significantly lower, although the price did recover somewhat by the close.
Hanging Man Candlestick Patterns on altFINS
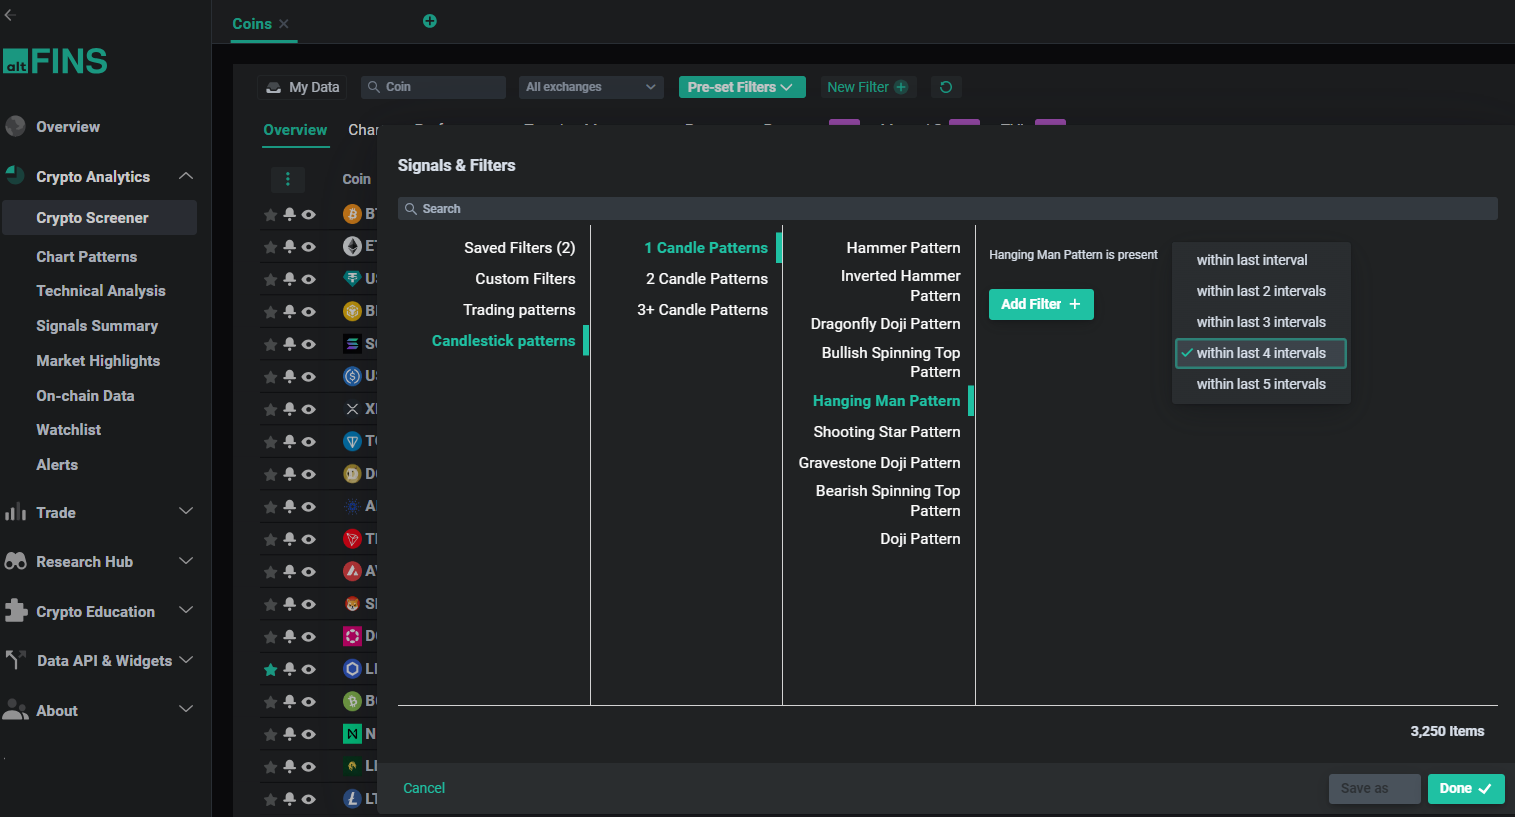
altFINS crypto screener allows traders to create custom filters based on Candlestick patterns. These patterns include 1-Candle Patterns, 2-Candle Patterns, and patterns involving 3 or more candles.
To access Candlestick patterns on altFINS, go to:
Crypto Screener – Preset Filters
altFINS provides a leading cryptocurrency screening tool capable of analyzing over 3,000 altcoins using 120 different indicators across five time frames. It includes Pre-set Filters, which are predefined and optimized strategies and patterns designed for quick access to the most popular filters, such as the Hanging Man Candlesticks pattern.
Crypto Screener Custom Filters
Select New Filter- Candlestick Patterns – 1 Candlestick – Hanging Man and select interval.

Source: altFINS
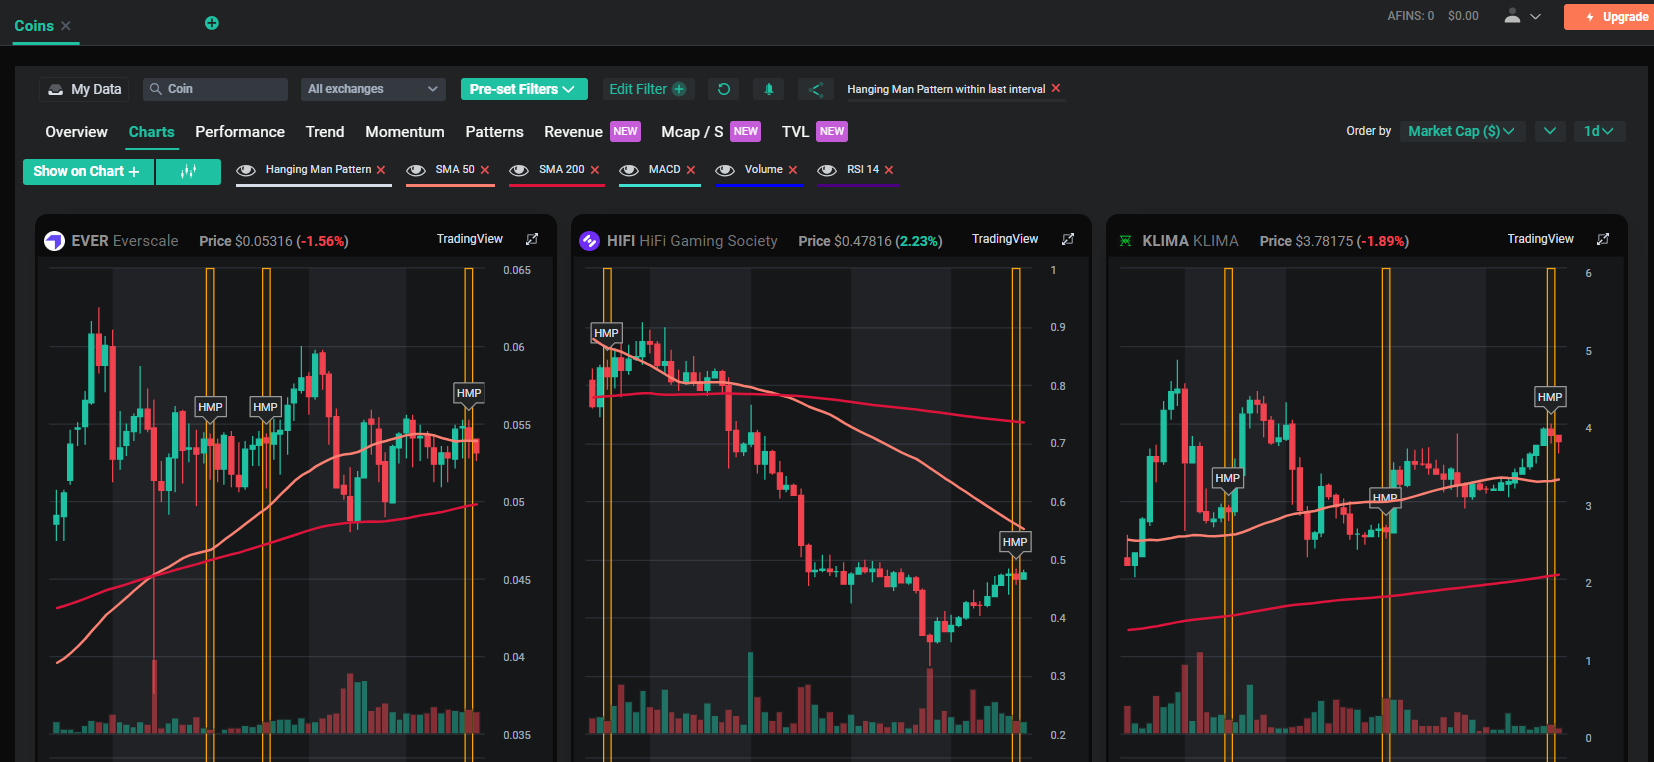
Examples: Hanging Man Candlestick Patterns in Charts

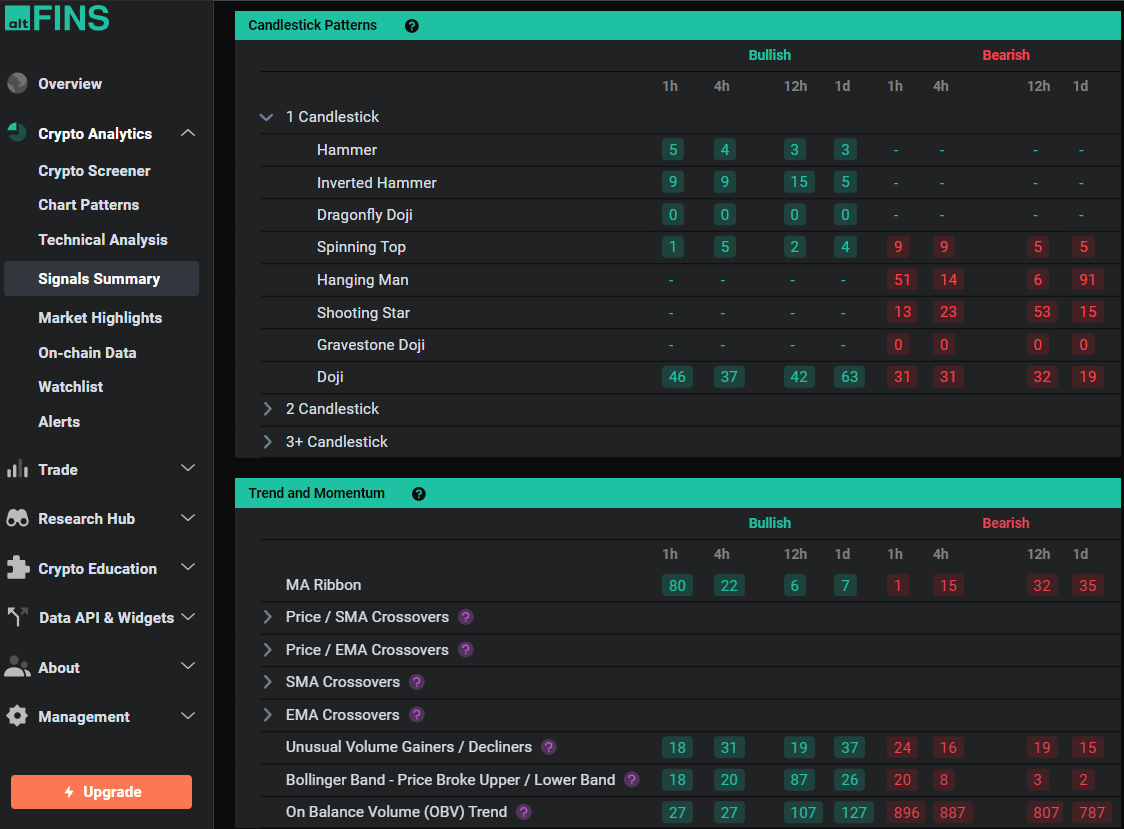
Signals Summary Custom Filters

Source: altFINS
Variations and Similar Patterns
- Hammer: The Hammer is essentially the bullish counterpart to the Hanging Man, appearing during downtrends with a similar shape but signaling a bullish reversal.
- Inverted Hammer and Shooting Star: These patterns also signal potential reversals but are differentiated by their placement in the trend and the direction of the shadow.
Recognizing these variations and similar patterns is crucial for traders to apply the correct interpretation and strategy based on market context.
Advanced Trading Strategies
Combining with Resistance Levels
When a Hanging Man forms at or near a key resistance level, it can reinforce the likelihood of a bearish reversal. This positioning makes the pattern more reliable as a predictor of downward price movements.
Using with Trend Lines
If a Hanging Man occurs near an ascending trend line, particularly one that has been tested several times, it may forewarn of a potential breakdown. Confirmation should be sought with a subsequent bearish candle that closes below the trend line.
Tips and Tricks for Effective Use
Wait for Confirmation
Because the Hanging Man indicates potential rather than confirmed reversal, it’s prudent to wait for additional bearish confirmation in subsequent trading sessions. This could be a closing price below the Hanging Man’s low.
Check the Historical Context
Analyzing how effectively Hanging Man patterns have predicted reversals in the past for a specific asset can provide valuable insights into how they might perform in the future.
Monitor Market Sentiment
Market sentiment and broader economic indicators should be considered, as a bearish Hanging Man pattern during an overwhelmingly bullish market sentiment may be less predictive.
Use Technical Indicators for Confirmation
- Volume Analysis: Higher trading volume during the formation of a Hanging Man can confirm the increased selling pressure, strengthening the reversal signal.
- Oscillators and Moving Averages: Using these tools can help validate the bearish momentum suggested by a Hanging Man.
Psychological Insights
The Hanging Man pattern indicates a session where, despite a strong initial position, bulls lose control to bears by the end, suggesting growing pessimism among investors.
Risk Management
Effective risk management strategies are essential when trading on the Hanging Man:
- Proper Position Sizing: Adjust position size based on the asset’s volatility and the proximity of your stop-loss.
- Dynamic Stop-Loss Adjustment: Consider setting stop-losses just above the Hanging Man’s high to manage potential losses if the anticipated reversal does not materialize.
Learn more about Risk management in the Lesson 9 in Crypto Trading Course.
Practical Examples
Illustrating real-life trades that have utilized the Hanging Man pattern can help traders identify the most favorable conditions for this setup and understand potential pitfalls.
Conclusion
The Hanging Man candlestick pattern is a valuable tool for predicting potential bearish reversals. By integrating advanced strategies, understanding the market context, and employing solid risk management, traders can enhance their ability to capitalize on this pattern effectively. This pattern, when used judiciously, forms an essential part of a sophisticated trading strategy, particularly for those looking to anticipate and act on potential price declines.
Read also an article:
Mastering Candlestick Patterns for Successful Crypto Trading
Essential Candlestick Patterns for Crypto Traders
The Dragonfly Doji Candlestick Pattern
The Hammer Candlestick Pattern
The Inverted Hammer Candlestick Pattern
The Hammer Candlestick Pattern
The Gravestone and Perfect Gravestone Doji Candlestick Patterns
Bullish Engulfing Candlestick Pattern
The Spinning Top Candlestick Pattern
What is Candlestick Pattern (source: Investopedia)
