Search Knowledge Base by Keyword
Mastering Key Levels in Crypto Trading: The Ultimate Guide
Understanding key levels in crypto trading can drastically improve your entry, exit, and risk management decisions. These are horizontal zones on a chart that act as psychological support or resistance, influencing how price behaves in those areas.
📈 What Are Key Levels in Trading?
Key levels are horizontal support or resistance zones where the price of an asset frequently bounces or stalls. They represent psychological boundaries where many traders agree on whether the asset is “too expensive” (resistance) or “attractive to buy” (support).
💡 Support: A price floor where buyers typically enter, preventing further decline.
💡 Resistance: A ceiling where sellers step in, halting price increases.
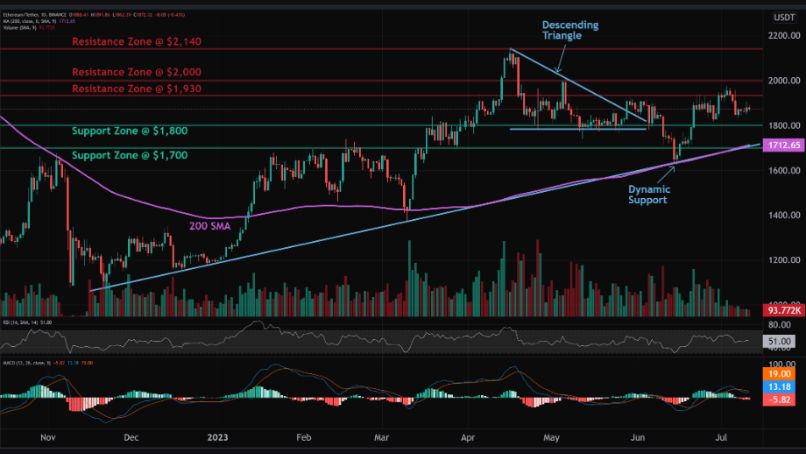
Key levels in trading crypto are simply horizontal support or resistance areas. This means that the peaks or troughs in the price graph line up to a horizontal psychological barrier. Support and resistance lines are critical concepts in technical analysis. These are areas where buyers deem an asset attractive to buy (support) or too expensive (resistance). Watch a video explaining this concept.
Key levels are established when price touches a level at least three times. The more times the price touches the level, the more significant the level is. Every time that a level is tested or touched, but not broken, it is another case in point whereby the market confirms that it is not prepared to go higher than that price. The more often it happens, the more likely it seems that it will happen again.
Understanding Support and Resistance Lines
- Support: A price level where buying interest is strong enough to prevent the price from falling further.
- Resistance: A price level where selling interest is strong enough to prevent the price from rising further.
These levels are fundamental in technical analysis and serve as guides for market trends.
How Are Key Levels Formed?
Key levels are confirmed when price touches a level at least three times without breaking it. Each touch without a breakthrough reinforces its importance, telling traders that the market is respecting that price level.
📊 The More Touches, The Stronger the Level
- 3+ touches = confirmed key level
- Higher timeframe = stronger signal
- More volume = higher credibility
Key levels are identified when the price touches a specific level at least three times. The more frequently the price tests the level without breaking through, the stronger that level becomes. Each test without a breakthrough reinforces the psychological significance of that price point.
3 Powerful Trading Strategies Using Key Levels
Once the key level has been identified and we can see how significant it is, there are three types of trade opportunities. According to backtests, these three trade setups based on key levels have over a 70% success rate:
1. Key level approach
Anticipate price to revisit a known level. If price approaches a previous resistance, expect a potential stall or breakout.
📌 Use case: Wait for price to return to support or resistance before acting.
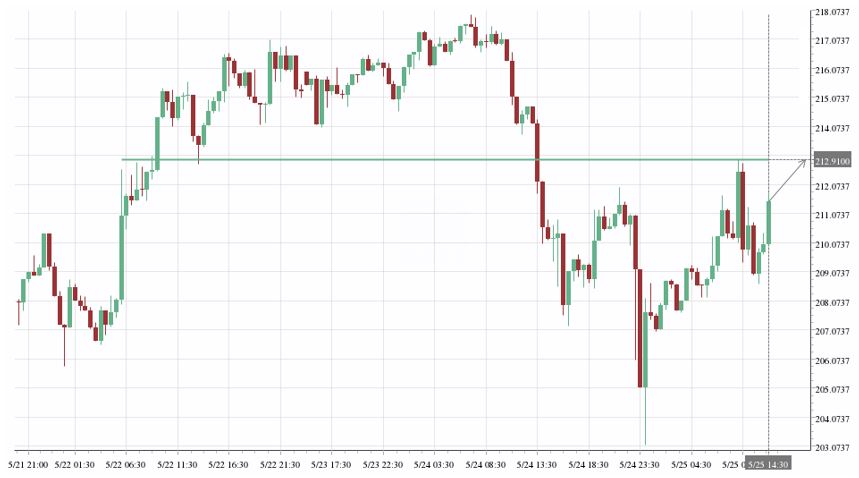
The first type of trade opportunity is when the price has bounced off a key level and moved away and is now yet again approaching that level. Here the expectation is for the price to reach the horizontal key level once again. A secondary opportunity may exist when the price continues beyond the support resistance line, forming a breakout (see next trade set up).
2. Key level breakout
When price finally breaks through a key level, it often signals strong momentum and may run significantly in that direction.
📌 Use case: Enter a long trade after resistance breaks, with a stop just below the level.
When key level is breached the theory is that the momentum of the price will carry it some distance beyond the identified level. A breakout is identified when there is a definitive breach of the key horizontal level and it is presented together with a target level where one can expect the price to move towards.
Example: Real trade video of trading Resistance breakout (BAT example)
3. Key level bounce
Most of the time, price respects these levels and bounces off them. Go long at support, short at resistance.
📌 Use case: Place buy orders near support and sell near resistance.
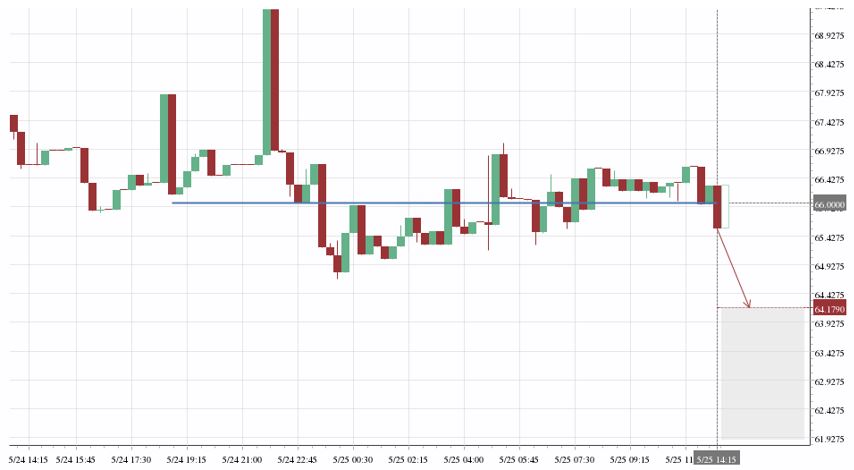
Most of the time, prices will bounce off of the key horizontal lines, instead of breaking through (trade setup #2 above). So a trader could place an order to go Long when price touches the support line, or go Short (or Sell existing position) when price touches the resistance line.
Horizontal support and resistance not only provide potential trade opportunities but they also give traders some very good indication where to place a stop loss and take profit levels. Moreover, they can be powerful confirmation for other opportunities. For example, certain chart patterns have horizontal support or resistance built-in, like ascending or descending triangles, rectangles head and shoulders.
How to Find Key Levels on altFINS
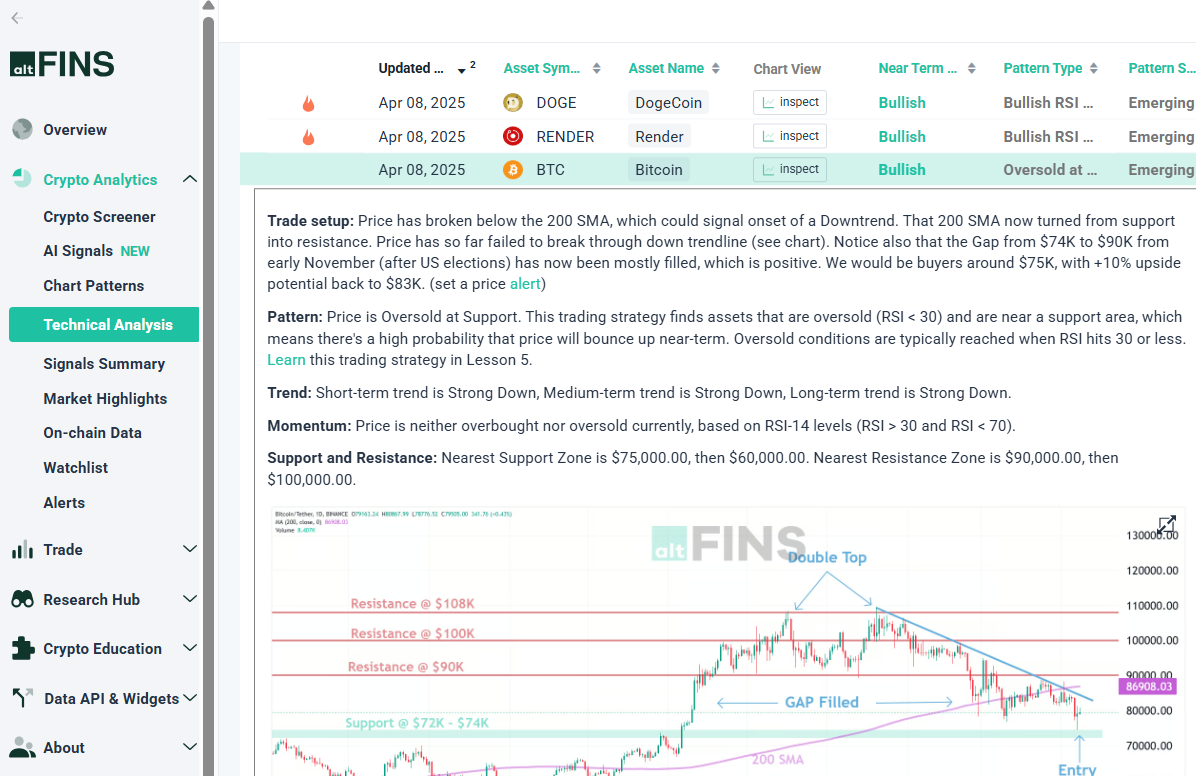
Key levels – horizontal support and resistance lines – are some of the most important tools in technical analysis. They help traders identify ideal entry, exit, and stop-loss zones. On altFINS, you don’t need to manually draw these levels — the platform highlights them for you using Trade Setups and AI Chart Patterns.
Trade Setups: Pre-Marked Key Levels with Trade Ideas
Each trade setup is defined by the altFINS expert team, including key support and resistance zones. Go to check trade setups for 65+ altcoins.
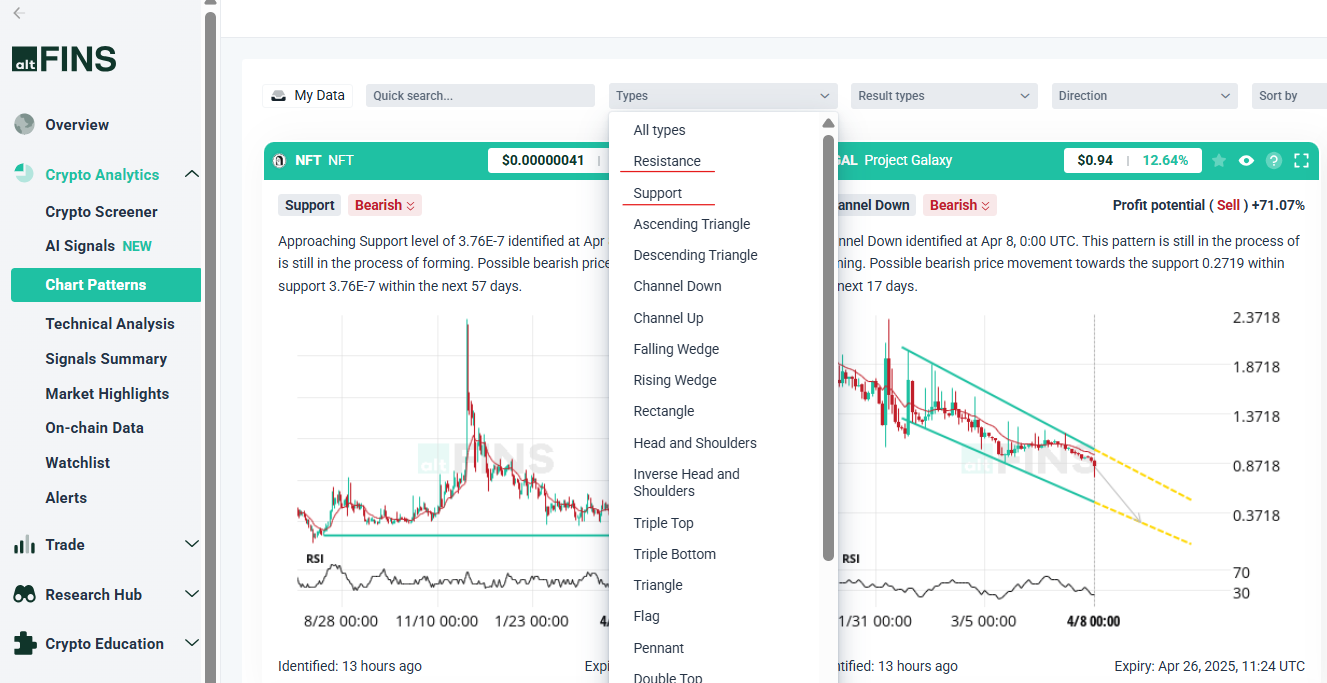
AI Chart Patterns: Filter Support and Resistance
Go to AI Chart Patterns and filter Support or Resistance in type filter
Using Key Levels for Stop Loss and Take Profit
Horizontal support and resistance levels not only help identify trade opportunities but also guide risk management strategies. Traders commonly place:
- Stop-loss orders: Just below support levels (for long positions) or above resistance levels (for short positions).
- Take-profit orders: Near previous support or resistance levels to secure gains.
Stop Loss & Take Profit with Key Levels
Key levels are ideal zones for placing stop-loss and take-profit orders.
🛑 Stop-Loss
- Below support (for long trades)
- Above resistance (for shorts)
🎯 Take-Profit
- Near the next resistance (for longs)
- Near the next support (for shorts)
Combining Key Levels with Other Chart Patterns
Combine Key Levels With Chart Patterns
Key levels become even more powerful when combined with chart formations:
| Pattern | Relation to Key Levels |
|---|---|
| Ascending Triangle | Horizontal resistance line |
| Descending Triangle | Horizontal support line |
| Rectangle Range | Defined support and resistance |
| Head & Shoulders | Horizontal neckline level |
Key levels also provide valuable confirmations for other technical patterns, such as:
- Ascending/Descending Triangles: Often form around horizontal support or resistance lines.
- Rectangles: Consolidation patterns with well-defined support and resistance boundaries.
- Head and Shoulders: A reversal pattern with horizontal neckline support or resistance.
Conclusion
Mastering key horizontal levels is crucial for successful crypto trading. By identifying, analyzing, and trading around these significant levels, traders can improve their decision-making and increase their chances of profitable trades. Additionally, integrating key levels with other technical indicators enhances trading strategies and ensures more informed market entries and exits.
Related Topics:
Maximize your trading potential by mastering key horizontal levels and incorporating them into your technical analysis toolkit.
Final Thoughts
Mastering key horizontal levels is essential for success in crypto trading. These levels offer clarity, reduce emotional decisions, and create high-probability trade opportunities. Whether you’re a beginner or advanced trader, using key levels helps you make better, more informed moves.
🔍 Keep refining your skills by combining key levels with technical patterns and indicators — and always manage your risk smartly.
