Mastering Support and Resistance for Trading Success

Understanding key concepts like Support and Resistance can be the difference between success and disappointment. These fundamental tools are essential for any trader looking to navigate the volatile crypto markets effectively. Watch this Tutorial Video and learn about Support and Resistance.
What is Support and Resistance?
Support and Resistance are critical technical analysis concepts that provide insight into the behavior of asset prices. They help traders identify potential entry and exit points, manage risk, and make informed decisions.
Support: The Safety Net
Support represents a price level where a downtrend may pause or reverse due to increased demand or buying interest. Think of it as a safety net that prevents prices from plummeting further. When an asset’s price drops, demand often increases at a specific level, creating a support zone.
Resistance: The Glass Ceiling
Conversely, resistance is a price level where uptrends encounter selling pressure, preventing prices from rising further. This level acts as a glass ceiling for prices, where sellers dominate and buyers face challenges in pushing prices higher.
Why Do Support and Resistance Matter?
Recent market events, such as Bitcoin‘s rejection at $28,000, Solana’s struggle at $25, Chainlink‘s resistance near $8.50, and Render‘s hurdles at $1.80, highlight the significance of these zones. These are not mere coincidences but clear instances of resistance zones where sellers take profits, overpowering buying demand.
Ignoring these levels can lead to significant losses. Instead, savvy traders use Support and Resistance areas to their advantage. They lighten their positions when prices approach resistance zones and consider entering or adding to positions when prices approach established support zones.
Patterns Repeat: The Power of Support and Resistance
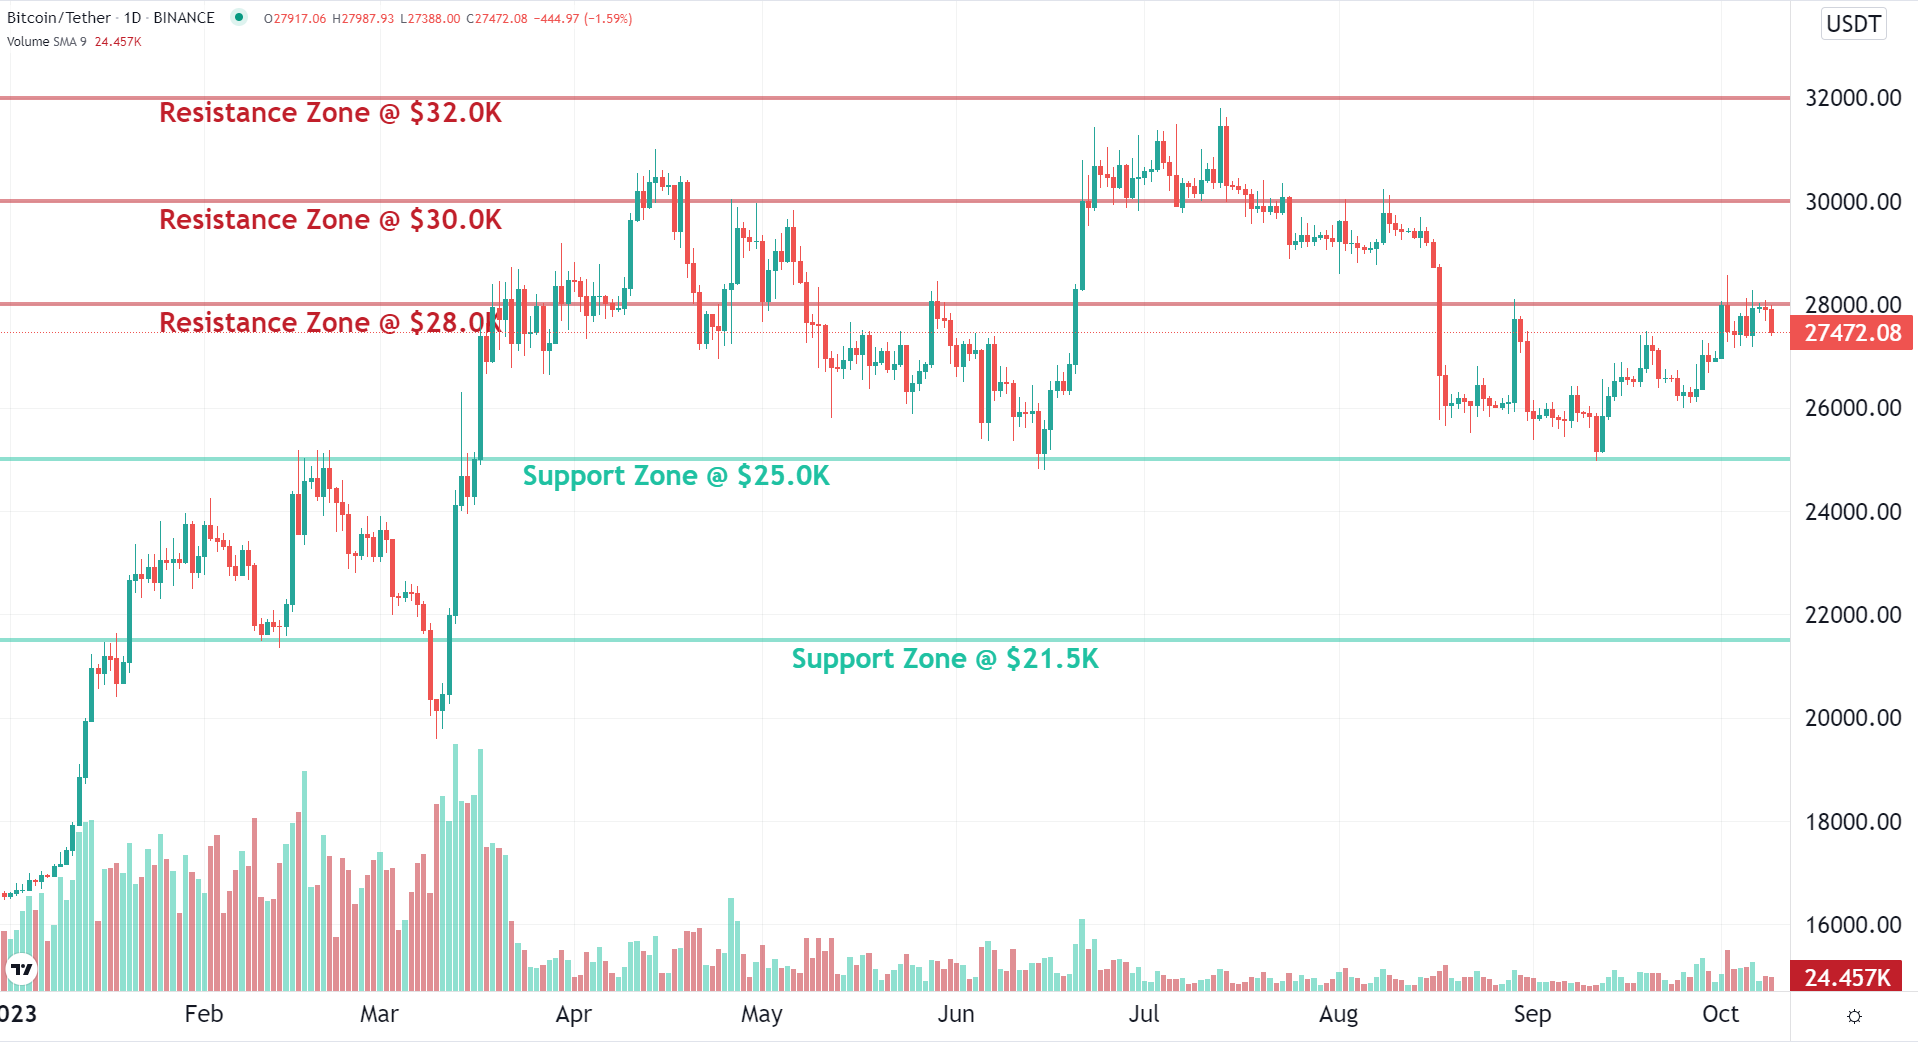
Support and Resistance levels tend to repeat over time. Consider Bitcoin’s chart, where prices touched $25,000 in July and September and rebounded. This illustrates strong buying interest, i.e., support. However, at $28,000, the price faced selling pressure, rejected three times, signifying a resistance area.
Past support and resistance levels often re-emerge in the future. Breaking above a resistance zone, as Bitcoin did at $28,000 in April and July, indicates strong buyer demand. Conversely, breaking below such a level, as in May and August, led to rapid declines towards the nearest support area of $25,000.
 Trading Strategies: Using Support and Resistance to Your Advantage
Traders often build their strategies entirely around Support and Resistance. They sell near resistance levels and buy near support zones. This approach harnesses the psychological and historical significance of these levels.
Furthermore, once a lower resistance zone is broken, it often becomes a price objective in an advancing market. For instance, if Bitcoin breaks above $28,000, traders may anticipate a move to the next resistance area at $30,000.
Leverage Technology: altFINS and Support & Resistance
For traders seeking assistance in identifying these crucial levels, platforms like altFINS can be invaluable.
In conclusion, Support and Resistance are pillars of successful trading. They help you understand market psychology, anticipate price movements, and make strategic decisions. Mastering these concepts can be the key to achieving success in the dynamic world of cryptocurrency trading. So, don’t underestimate their importance and start incorporating them into your trading strategy today! 📈
0 Comments
Leave a comment