Search Knowledge Base by Keyword
-
Overview
-
- altFINS Platform Features - Your All-in-One Crypto Trading Tool
- Why use altFINS?
- Registered user benefits
- What kind of trader are you?
- How to trade cryptocurrencies?
- How to Trend Trade Crypto
- Trading Risk Management
- What Makes altFINS One of the Best Crypto Screeners in 2025?
- What Kind Of Crypto Trading Signals Are on altFINS?
-
-
Crypto Analytics
-
- Why use it?
- Overview > Charts > Scorecards > Performance > Trend > Oscillators
- Add table columns
- Detail view
- Charts
- Create a Trading Signal or Filter
- Find SMA crossover signals
- Crypto Time Intervals
- Create an alert
- Extreme Overbought coins Due for a Pullback
- Early momentum detection
- Crypto Trend Changes
- Why And How Use altFINS Crypto Screener
- Mastering Candlestick Patterns for Successful Crypto Trading
- What Are Fibonacci Retracement Levels?
- Essential Candlestick Patterns for Crypto Traders
- Using Local High to Spot Breakouts
- Oversold in Uptrend
- Strong Uptrend
- The Hammer Candlestick Pattern
- The Inverted Hammer Candlestick Pattern
- The Hanging Man Candlestick Pattern
- The Spinning Top Candlestick Pattern
- The Dragonfly Doji Candlestick Pattern
- What is "My Data" Option on altFINS?
- The Relative Volume (RVOL) Indicator
- New Local High
- New Local Low
- Buying Coins at an All-Time-High (ATH)
- Bullish Engulfing Candlestick Pattern: A Comprehensive Guide
- The Gravestone and Perfect Gravestone Doji Candlestick Patterns
- Support and Resistance Crypto: The Complete 2026 Guide for Traders
- What Makes altFINS One of the Best Crypto Screeners in 2025?
- Crypto Volume Tracker: Spot Unusual Volume and Momentum with altFINS
- Crypto Fundamental Data On altFINS: Identifying Projects with Real Traction
- What is ATR Indicator and How to Find It on altFINS?
- Combining fundamentals with TA
- Trading RSI and RSI Divergence
- What Is the 200-Day Simple Moving Average and How to Find It on altFINS
- Show all articles ( 24 ) Collapse Articles
-
- Overview
- Emerging v. Complete
- Mastering Key Levels in Crypto Trading: The Ultimate Guide
- Consecutive Candles
- Big Movement in Trading: Understanding and Trading the Volatility
- Fibonacci Patterns
- 10 steps for how to trade crypto using Crypto Chart Patterns
- How to trade Channel Down? | Crypto Chart Pattern
- Tutorial: Using Custom Chart Pattern Filters
- How To Set Up Chart Patterns Alerts?
- How To Trade Channel Up Pattern? | Crypto Chart Pattern
- How To Trade Ascending Triangles? | Crypto Chart Pattern
- How To Trade Bullish Flag Pattern? | Crypto Chart Pattern
- How To Trade Sideways Channel pattern? | Crypto Chart Pattern
- How To Trade Rising Wedge pattern? | Crypto Chart Pattern
- How To Trade Falling Wedge pattern? | Crypto Chart Pattern
- How To Trade Descending Triangle pattern? | Crypto Chart Pattern
- How To Trade Inverse Head and Shoulders pattern? | Crypto Chart Pattern
- What is "My Data" Option on altFINS?
- How To Trade Symmetrical Triangle Pattern? | Crypto Chart Pattern
- Crypto Chart Patterns Cheat Sheet
- How Does AI Help with Crypto Trading?
- Crypto Chart Patterns
- Show all articles ( 8 ) Collapse Articles
-
- Signals Summary Overview
- How To Find And Trade Crypto Pullbacks In Uptrend (Buying Dips)?
- Momentum & Up / Down Trend
- Range in Up/Down Trend
- Momentum
- How to trade EMA 12 / 50 crossovers?
- Moving Average Ribbons
- Strong Up / Down Trend
- Strong Up / Down Trend (Short Term)
- Strong Up / Down Trend (Medium Term)
- Strong Up / Down Trend (Long Term)
- Price / SMA Crossovers In Crypto
- What are Price / EMA Crossovers in crypto?
- SMA Crossovers
- EMA Crossovers
- Crypto Unusual Volume Gainers / Decliners
- New Up/Down trend (ADX)
- Bollinger Band - Price Broke Upper / Lower Band
- Strong Up / Down Trend and Oversold / Overbought
- Strong Up / Down Trend and Strong / Weak Ultimate Oscillator
- MACD (12,27,9) Signal Line cross
- MACD (12,27,9) Center Line cross
- Commodity Channel Index cross
- Overall Score of Oscillators (Oversold / Overbought)
- Relative Strength Index (9)
- Relative Strength Index (14)
- Relative Strength Index (25)
- Stochastic RSI (3, 3, 14, 14)
- Williams Percent Range (14)
- Bull Power
- MACD line
- Relative Strength Index (RSI) Divergence: Explained
- How to Trend Trade Crypto
- Early momentum detection
- Short-Medium-Long-Term Trend
- Relative Strength Index
- Uptrend and Fresh Bullish Momentum Inflection
- Using Local High to Spot Breakouts
- Oversold in Uptrend
- Strong Uptrend
- The Hammer Candlestick Pattern
- The Inverted Hammer Candlestick Pattern
- The Hanging Man Candlestick Pattern
- The Spinning Top Candlestick Pattern
- The Dragonfly Doji Candlestick Pattern
- What is "My Data" Option on altFINS?
- The Relative Volume (RVOL) Indicator
- New Local High
- New Local Low
- Bullish Engulfing Candlestick Pattern: A Comprehensive Guide
- The Gravestone and Perfect Gravestone Doji Candlestick Patterns
- Three White Soldiers Candlestick Pattern: A Comprehensive Guide
- How Does AI Help with Crypto Trading?
- What Kind Of Crypto Trading Signals Are on altFINS?
- Trading RSI and RSI Divergence
- Show all articles ( 40 ) Collapse Articles
-
- Volume
- OBV Divergence Indicator
- SMA vs. EMA
- Trading RSI and RSI Divergence
- Stochastic (14, 3, 3) (STOCH)
- What is CCI 20? (Commodity Channel Index 20)
- ADX
- MACD Line and MACD Signal Line
- Williams %R
- Stochastic RSI Fast
- Bull / Bear Power
- What is the UO: Ultimate Oscillator (7, 14, 28)
- Short Term Trend
- Medium Term Trend
- Long Term Trend
- Oscillator Rating
- Trading Multiple Time Frames
- Support and Resistance Crypto: The Complete 2026 Guide for Traders
- Polarity principle
- Early momentum detection
- Crypto Trend Changes
- MACD Histogram (H1, H2)
- What Are Fibonacci Retracement Levels?
- Using Local High to Spot Breakouts
- Oversold in Uptrend
- Strong Uptrend
- The Relative Volume (RVOL) Indicator
- New Local High
- Buying Coins at an All-Time-High (ATH)
- Crypto Volume Tracker: Spot Unusual Volume and Momentum with altFINS
- What is ATR Indicator and How to Find It on altFINS?
- Combining fundamentals with TA
- What Is the 200-Day Simple Moving Average and How to Find It on altFINS
- Show all articles ( 18 ) Collapse Articles
- How To Trade Symmetrical Triangle Pattern? | Crypto Chart Pattern
- New Local High
- New Local Low
- Three White Soldiers Candlestick Pattern: A Comprehensive Guide
- Crypto Volume Tracker: Spot Unusual Volume and Momentum with altFINS
- What is ATR Indicator and How to Find It on altFINS?
- What Is the 200-Day Simple Moving Average and How to Find It on altFINS
- Crypto Breakouts Explained: How to Spot Winning Trades with altFINS
- Getting Started with altFINS! Your Complete Step-by-Step Guide to Crypto Trading Success
-
-
Trade Crypto
-
- Initiating a trade
- Market vs. Limit order
- Refreshing tables
- Are derivatives such as futures, options and perpetual swaps supported?
- Does altFINS charge trading fees?
- Balances
- Open Orders
- Transaction History
- Order Book & Trades in Crypto
- Connecting to exchanges
- How to trade cryptocurrencies?
- Trading Risk Management
- Crypto Portfolio Tracker
- Connect To Bitget
- Connect to Coinbase
-
-
Research Hub
-
Crypto Education
-
- Where To Buy And Sell Cryptocurrency?
- When Is The Best Time To Buy And Sell Cryptocurrency?
- Crypto Profits: Full Guide How to Take Profits In Cryptocurrency
- What Is Crypto Copy Trading?
- What Is Leverage Trading Cryptocurrency?
- Crypto Arbitrage Trading: Meaning, Signals And Opportunities
- Crypto Hot Wallet vs. Cold Wallet: What is the Difference
- Crypto Trading Strategies
- Difference Between Crypto Fundamental and Technical Analysis
- List of TOP Decentralized Exchanges 2025
- What is a Crypto Prop Trading? A Complete Guide to Crypto Proprietary Trading Firms
- The Best Crypto Prop Trading Firms
- Altrady Review: How To Achieve Optimal Trade Execution
- Crypto AI Agents Explained: Top 10 AI Agent Cryptos by Market Cap to Watch in 2025
- The Ultimate Guide to Smart Money Whales in Crypto
- The Ultimate Guide to Cryptocurrency ETFs in 2025
- How to Control Your Emotions While Trading Crypto (and How altFINS Can Help)
- HyroTrader Review: A Comprehensive Analysis
- Best Crypto Trading Bots in 2025: Coinrule vs Cryptohopper vs 3Commas
- How to Automate Your Crypto Trading with Coinrule
- OneFunded Review: Pros & Cons Revealed
- The Market's X-Ray: Liquidation Heatmaps
- Show all articles ( 7 ) Collapse Articles
-
-
About
-
AI Features
-
altFINS API
- What Is the altFINS Analytics Data API?
- Who Is the altFINS Data API For?
- Real-World Use Cases of the altFINS API
- altFINS Crypto Market & Analytical Data API
- How to Create an altFINS API Key (Step-by-Step Guide)
- The Ultimate Guide to Cryptocurrency MCP Servers in 2026: Complete Comparison for Traders, Developers & Trading Platforms
- 11 Best Crypto APIs for 2026: Comparison, Pricing & Features
- How to Connect altFINS MCP to Claude Desktop
- 8 AI-Powered Trade Strategy Prompts Using altFINS MCP
Stochastic RSI Fast
In trending markets—especially uptrends—the traditional RSI often gives false overbought signals and fails to reach oversold levels, making it less effective for identifying buy opportunities. A solution to this problem is to apply the Stochastic Oscillator to the RSI, creating the Stochastic RSI, which compares the current RSI reading to the range of RSI values over a defined period (typically 14 days).
This makes it more sensitive and responsive than the original RSI, making it particularly useful for short-term trading in sideways (range-bound) markets, where traditional indicators might fail.
The Stochastic RSI is a second derivative of price, so its movement may not mirror price action directly. It’s considered:
- Oversold when below 0.20, which may signal a potential bounce or reversal up.
- Overbought when above 0.80, which may suggest a pullback or correction is near.
A reading above 0.50 may indicate short-term bullish momentum, while a reading below 0.50 may suggest bearish pressure. These centerline crossovers can help identify emerging trends early.
Because the Stochastic RSI can be highly volatile, many traders smooth it using a short moving average (e.g., 10-day SMA) to reduce noise and generate more stable signals.
Tips:
- Best used in combination with support/resistance or trendlines for confirmation.
- Works well for crypto scalping and swing trades on lower timeframes.
- Consider adding volume indicators to validate potential reversals.
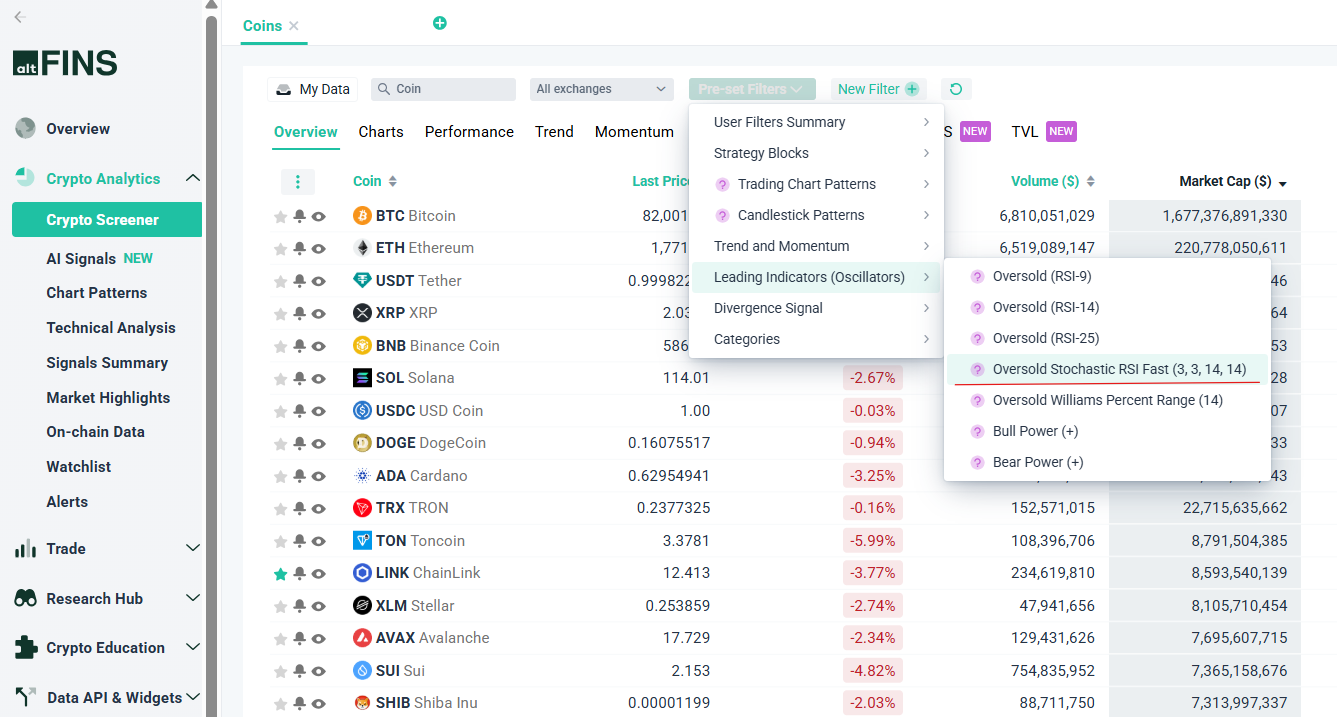
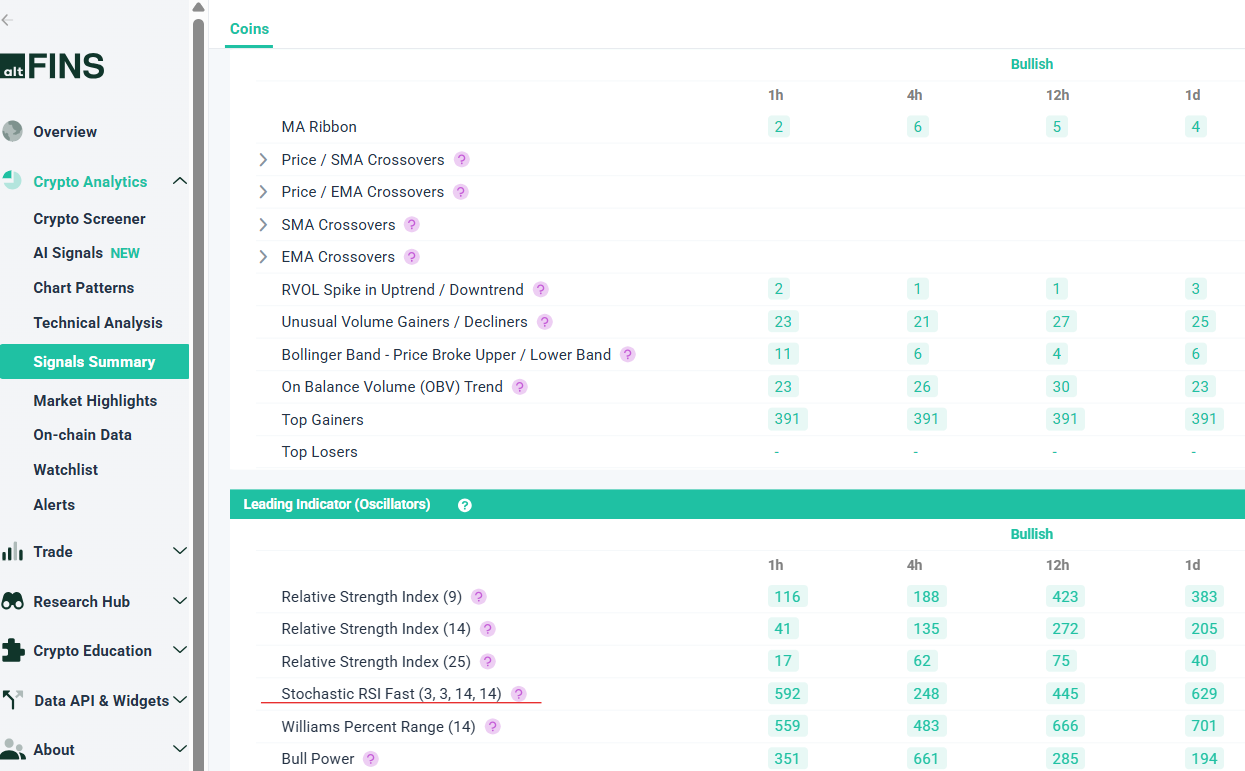
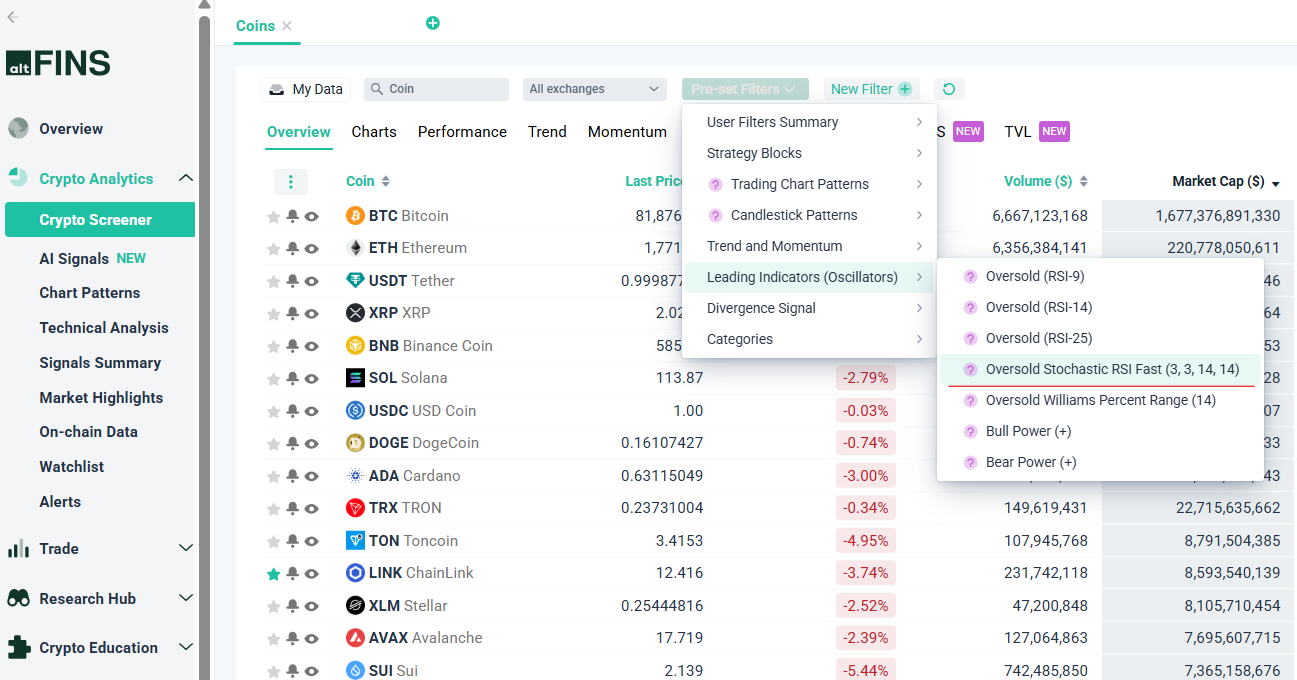
How to Find Stochastic RSI Fast on altFINS?
Traders can find Stochastic RSI Fast indicator on several sections:
-
Crypto Screener: Pre-set Filters
-
Crypto Screener: Custom Filters