Search Knowledge Base by Keyword
-
Overview
-
- altFINS Platform Features - Your All-in-One Crypto Trading Tool
- Why use altFINS?
- Registered user benefits
- What kind of trader are you?
- How to trade cryptocurrencies?
- How to Trend Trade Crypto
- Trading Risk Management
- What Makes altFINS One of the Best Crypto Screeners in 2025?
- What Kind Of Crypto Trading Signals Are on altFINS?
-
-
Crypto Analytics
-
- Why use it?
- Overview > Charts > Scorecards > Performance > Trend > Oscillators
- Add table columns
- Detail view
- Charts
- Create a Trading Signal or Filter
- Find SMA crossover signals
- Crypto Time Intervals
- Create an alert
- Extreme Overbought coins Due for a Pullback
- Early momentum detection
- Crypto Trend Changes
- Why And How Use altFINS Crypto Screener
- Mastering Candlestick Patterns for Successful Crypto Trading
- Fibonacci Retracement Levels: The Complete Crypto Trading Guide (2026)
- Essential Candlestick Patterns for Crypto Traders
- Using Local High to Spot Breakouts
- Oversold in Uptrend
- Strong Uptrend
- The Hammer Candlestick Pattern
- The Inverted Hammer Candlestick Pattern
- The Hanging Man Candlestick Pattern
- The Spinning Top Candlestick Pattern
- The Dragonfly Doji Candlestick Pattern: Complete Trading Guide (2026)
- What is "My Data" Option on altFINS?
- The Relative Volume (RVOL) Indicator
- New Local High
- New Local Low
- Buying Coins at an All-Time-High (ATH)
- Bullish Engulfing Candlestick Pattern: A Comprehensive Guide
- The Gravestone and Perfect Gravestone Doji Candlestick Patterns
- Support and Resistance Crypto: The Complete 2026 Guide for Traders
- What Makes altFINS One of the Best Crypto Screeners in 2025?
- Crypto Volume Tracker: Spot Unusual Volume and Momentum with altFINS
- Crypto Fundamental Data On altFINS: Identifying Projects with Real Traction
- What is ATR Indicator and How to Find It on altFINS?
- Combining fundamentals with TA
- Trading RSI and RSI Divergence
- What Is the 200-Day Simple Moving Average and How to Find It on altFINS
- 11 Best Crypto Screeners in 2026: Comparison, Pricing & Features
- The Complete Guide to altFINS Preset Screener Filters
- altFINS AI Trade Setup: Analyze 2,000 Coins in Seconds
- Show all articles ( 27 ) Collapse Articles
-
- Overview
- Emerging v. Complete
- Mastering Key Levels in Crypto Trading: The Ultimate Guide
- Consecutive Candles
- Big Movement in Trading: Understanding and Trading the Volatility
- Fibonacci Patterns
- 10 steps for how to trade crypto using Crypto Chart Patterns
- How to trade Channel Down? | Crypto Chart Pattern
- Tutorial: Using Custom Chart Pattern Filters
- How To Set Up Chart Patterns Alerts?
- How To Trade Channel Up Pattern? | Crypto Chart Pattern
- How To Trade Ascending Triangles? | Crypto Chart Pattern
- How To Trade Bullish Flag Pattern? | Crypto Chart Pattern
- How To Trade Sideways Channel pattern? | Crypto Chart Pattern
- How To Trade Rising Wedge pattern? | Crypto Chart Pattern
- How To Trade Falling Wedge pattern? | Crypto Chart Pattern
- How To Trade Descending Triangle pattern? | Crypto Chart Pattern
- How To Trade Inverse Head and Shoulders pattern? | Crypto Chart Pattern
- What is "My Data" Option on altFINS?
- How To Trade Symmetrical Triangle Pattern? | Crypto Chart Pattern
- Crypto Chart Patterns Cheat Sheet
- How Does AI Help with Crypto Trading?
- Crypto Chart Patterns: The Complete 2026 Guide to 26 AI-Detected Patterns
- Best Automated Crypto Chart Pattern Recognition Platforms in 2026: The Ultimate Comparison
- Show all articles ( 9 ) Collapse Articles
-
- Technical Analysis - Trade Setups
- Fibonacci Retracement Levels: The Complete Crypto Trading Guide (2026)
- How To Trade Sideways Channel pattern? | Crypto Chart Pattern
- Technical Analysis Alerts
- Support and Resistance Crypto: The Complete 2026 Guide for Traders
- 8 AI-Powered Trade Strategy Prompts Using altFINS MCP
-
- Signals Summary Overview
- How To Find And Trade Crypto Pullbacks In Uptrend (Buying Dips)?
- Momentum & Up / Down Trend
- Range in Up/Down Trend
- Momentum
- How to trade EMA 12 / 50 crossovers?
- Moving Average Ribbons
- Strong Up / Down Trend
- Strong Up / Down Trend (Short Term)
- Strong Up / Down Trend (Medium Term)
- Strong Up / Down Trend (Long Term)
- Price / SMA Crossovers In Crypto
- What are Price / EMA Crossovers in crypto?
- SMA Crossovers
- EMA Crossovers
- Crypto Unusual Volume Gainers / Decliners
- New Up/Down trend (ADX)
- Bollinger Band - Price Broke Upper / Lower Band
- Strong Up / Down Trend and Oversold / Overbought
- Strong Up / Down Trend and Strong / Weak Ultimate Oscillator
- MACD (12,27,9) Signal Line cross
- MACD (12,27,9) Center Line cross
- Commodity Channel Index cross
- Overall Score of Oscillators (Oversold / Overbought)
- Relative Strength Index (9)
- Relative Strength Index (14)
- Relative Strength Index (25)
- Stochastic RSI (3, 3, 14, 14)
- Williams Percent Range (14)
- Bull Power
- MACD line
- Relative Strength Index (RSI) Divergence: Explained
- How to Trend Trade Crypto
- Early momentum detection
- Short-Medium-Long-Term Trend
- Relative Strength Index
- Uptrend and Fresh Bullish Momentum Inflection
- Using Local High to Spot Breakouts
- Oversold in Uptrend
- Strong Uptrend
- The Hammer Candlestick Pattern
- The Inverted Hammer Candlestick Pattern
- The Hanging Man Candlestick Pattern
- The Spinning Top Candlestick Pattern
- The Dragonfly Doji Candlestick Pattern: Complete Trading Guide (2026)
- What is "My Data" Option on altFINS?
- The Relative Volume (RVOL) Indicator
- New Local High
- New Local Low
- Bullish Engulfing Candlestick Pattern: A Comprehensive Guide
- The Gravestone and Perfect Gravestone Doji Candlestick Patterns
- Three White Soldiers Candlestick Pattern: A Comprehensive Guide
- How Does AI Help with Crypto Trading?
- What Kind Of Crypto Trading Signals Are on altFINS?
- Trading RSI and RSI Divergence
- The Complete Guide to altFINS Preset Screener Filters
- Show all articles ( 41 ) Collapse Articles
-
- Volume
- OBV Divergence Indicator
- SMA vs. EMA
- Trading RSI and RSI Divergence
- Stochastic (14, 3, 3) (STOCH)
- What is CCI 20? (Commodity Channel Index 20)
- ADX
- MACD Indicator Explained: MACD Line, Signal Line & Histogram (Complete 2026 Guide)
- Williams %R
- Stochastic RSI Fast
- Bull / Bear Power
- What is the UO: Ultimate Oscillator (7, 14, 28)
- Short Term Trend
- Medium Term Trend
- Long Term Trend
- Oscillator Rating
- Trading Multiple Time Frames
- Support and Resistance Crypto: The Complete 2026 Guide for Traders
- Polarity principle
- Early momentum detection
- Crypto Trend Changes
- MACD Histogram (H1, H2)
- Fibonacci Retracement Levels: The Complete Crypto Trading Guide (2026)
- Using Local High to Spot Breakouts
- Oversold in Uptrend
- Strong Uptrend
- The Relative Volume (RVOL) Indicator
- New Local High
- Buying Coins at an All-Time-High (ATH)
- Crypto Volume Tracker: Spot Unusual Volume and Momentum with altFINS
- What is ATR Indicator and How to Find It on altFINS?
- Combining fundamentals with TA
- What Is the 200-Day Simple Moving Average and How to Find It on altFINS
- The Complete Guide to altFINS Preset Screener Filters
- Show all articles ( 19 ) Collapse Articles
- How To Trade Symmetrical Triangle Pattern? | Crypto Chart Pattern
- New Local High
- New Local Low
- Three White Soldiers Candlestick Pattern: A Comprehensive Guide
- Crypto Volume Tracker: Spot Unusual Volume and Momentum with altFINS
- What is ATR Indicator and How to Find It on altFINS?
- What Is the 200-Day Simple Moving Average and How to Find It on altFINS
- Crypto Breakouts Explained: How to Spot Winning Trades with altFINS
- Getting Started with altFINS! Your Complete Step-by-Step Guide to Crypto Trading Success
- 11 Best Crypto Screeners in 2026: Comparison, Pricing & Features
-
-
Trade Crypto
-
- Initiating a trade
- Market vs. Limit order
- Refreshing tables
- Are derivatives such as futures, options and perpetual swaps supported?
- Does altFINS charge trading fees?
- Balances
- Open Orders
- Transaction History
- Orderbook in Crypto: How to Read It, Spot Liquidity, and Trade Smarter (2026 Guide)
- Connecting to Exchanges on altFINS Terminal
- How to trade cryptocurrencies?
- Trading Risk Management
- Crypto Portfolio Tracker
- Connect To Bitget
- Connect to Coinbase
-
-
Research Hub
-
Crypto Education
-
- Where To Buy And Sell Cryptocurrency?
- When Is The Best Time To Buy And Sell Cryptocurrency?
- Crypto Profits: Full Guide How to Take Profits In Cryptocurrency
- What Is Crypto Copy Trading?
- What Is Leverage Trading Cryptocurrency?
- Crypto Arbitrage Trading: Meaning, Signals And Opportunities
- Crypto Hot Wallet vs. Cold Wallet: What is the Difference
- Crypto Trading Strategies
- Difference Between Crypto Fundamental and Technical Analysis
- Best Decentralized Exchanges in 2026: Complete Ranking by Volume, Fees & Features
- What is a Crypto Prop Trading? A Complete Guide to Crypto Proprietary Trading Firms
- The Best Crypto Prop Trading Firms
- Altrady Review: How To Achieve Optimal Trade Execution
- Crypto AI Agents Explained: Top 10 AI Agent Cryptos by Market Cap to Watch in 2025
- The Ultimate Guide to Smart Money Whales in Crypto
- The Ultimate Guide to Cryptocurrency ETFs in 2025
- How to Control Your Emotions While Trading Crypto (and How altFINS Can Help)
- HyroTrader Review: A Comprehensive Analysis
- Best Crypto Trading Bots in 2025: Coinrule vs Cryptohopper vs 3Commas
- How to Automate Your Crypto Trading with Coinrule
- OneFunded Review: Pros & Cons Revealed
- The Market's X-Ray: Liquidation Heatmaps
- Can Quantum Computers Break Bitcoin? | 2026 Google Research
- CoinEx Exchange Review 2026: Features, Fees, Security & What You Should Know Before Trading
- Hyperliquid ($HYPE) Price: The On-Chain Derivatives Powerhouse Eyeing $50
- Crypto Exchange Comparison 2026: CoinEx vs MEXC vs BYDFi vs Phemex vs Margex
- Best Crypto Prop Trading Firms in 2026: The Ultimate Comparison Guide
- Best Crypto Portfolio Trackers 2026: altFINS, CoinStats & 3 More Compared
- RebelsFunding Review 2026: The No-Time-Limit Prop Firm Built for Patient Traders
- LBank Review 2026: The Complete Guide to Fees, Security, Features & Trust
- Crypto Signals on Telegram in 2026 – Complete Guide With altFINS Examples
- MiCA 2026: The July 1 Deadline Every EU Crypto Firm Must Prepare For
- Show all articles ( 17 ) Collapse Articles
-
-
About
-
AI Features
-
altFINS API
- What Is the altFINS Analytics Data API?
- Who Is the altFINS Data API For?
- Real-World Use Cases of the altFINS API
- altFINS Crypto Market & Analytical Data API
- How to Create an altFINS API Key (Step-by-Step Guide)
- The Ultimate Guide to Cryptocurrency MCP Servers in 2026: Complete Comparison for Traders, Developers & Trading Platforms
- 11 Best Crypto APIs for 2026: Comparison, Pricing & Features
- How to Connect altFINS MCP to Claude Desktop
- 8 AI-Powered Trade Strategy Prompts Using altFINS MCP
- altFINS CLI: The Complete Guide To Crypto CLI
- Find Trade Ideas | Prompts Using altFINS MCP And AI
- How to Use altFINS AI Skills with OpenAI Codex
- The Complete Guide to altFINS MCP Crypto Trading Prompts
- The Trinity Moment: When a Local AI Model, altFINS CLI, and an M1 Max Started Working Like One Tool
- altFINS Preset Filters + MCP: Find Crypto Trade Opportunities in Plain English
- What Is a Crypto API & How to Use One: 2026 Tutorial
- How to Connect altFINS MCP to Perplexity PRO
- Show all articles ( 2 ) Collapse Articles
New Local Low
New Local Low is used in crypto technical analysis to detect when a new low point has been made in the price of an asset over a specified period. This concept is often used by traders to spot downward trends or breakdowns in the price of a cryptocurrency. A local low refers to a point where the price is lower than the surrounding data points within a given period or window of time.
Watch Tutorial Video about New Local Low and New Local High
Key Points:
- Shorter periods (e.g., 10 or 15): These periods are more sensitive to recent price movements, generating more frequent signals. They are typically used by day traders or swing traders to catch early signs of downward momentum.
- Longer periods (e.g., 30 or 50): These periods are less sensitive to short-term price fluctuations and focus on signaling more significant downward trends. Longer periods are often preferred by position traders or long-term investors.
How It’s Used:
Traders use the New Local Low indicator to identify breakdown patterns, where the price falls below recent lows, potentially continuing downward. Depending on a trader’s strategy, different periods are used to detect either short-term or more substantial downward movements:
- Shorter periods (10, 15): Often used by traders aiming to catch early downward breakouts or corrections.
- Longer periods (30, 50): Typically used to confirm more substantial breakdowns, potentially indicating a larger bearish trend.
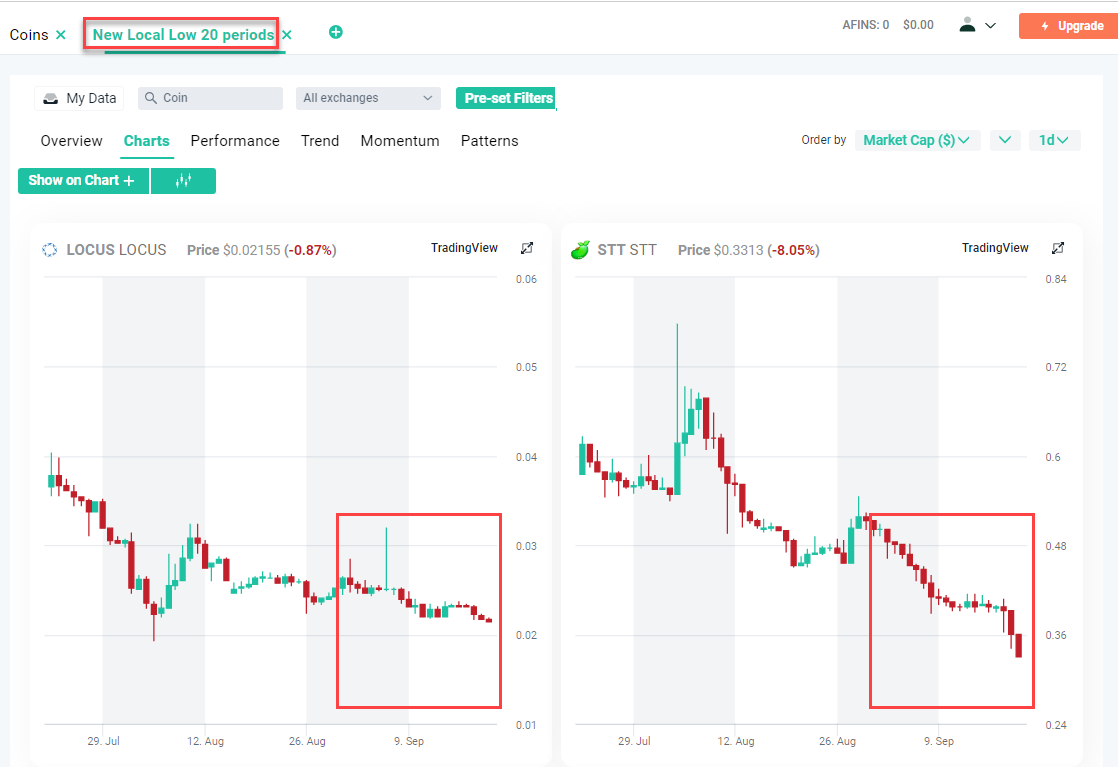
Example: these are coins reaching a new low over the last 20 periods. On a daily time frame, this represents a span of 20 days.
How to Detect New Local Low on altFINS
On the altFINS platform, the New Local Low indicator is available for periods of 10, 15, 20, 30, and 50. The concept works similarly for each of these periods, with the platform automatically detecting and signaling when a new local low is established. Here’s how it works for each period:
For Period 10:
- The indicator checks if the current price is the lowest over the last 10 periods (e.g., 10 days if using daily data). If the current price is lower than any of the prices over the last 10 periods, it will be marked as a New Local Low.
For Period 15:
- The indicator checks the lowest price over the last 15 periods. If the current price is lower than any price from the previous 15 periods, it will trigger a signal for a New Local Low.
For Period 20:
- Similarly, this indicator looks back over the last 20 periods. If the current price is lower than any price within that timeframe, a New Local Low signal is generated.
For Period 30:
- The indicator evaluates the price over the last 30 periods, marking the current price as a New Local Low if it’s lower than any price from the last 30 periods.
For Period 50:
- This longer-period indicator checks whether the current price is the lowest over the last 50 periods, signaling a more significant downtrend if true.
How to Detect New Local Low on altFINS?
If you are analyzing daily price data for a cryptocurrency and set the period to 20, the New Local Low indicator will mark the current price as a new low if it is lower than the lowest price of the previous 20 days.
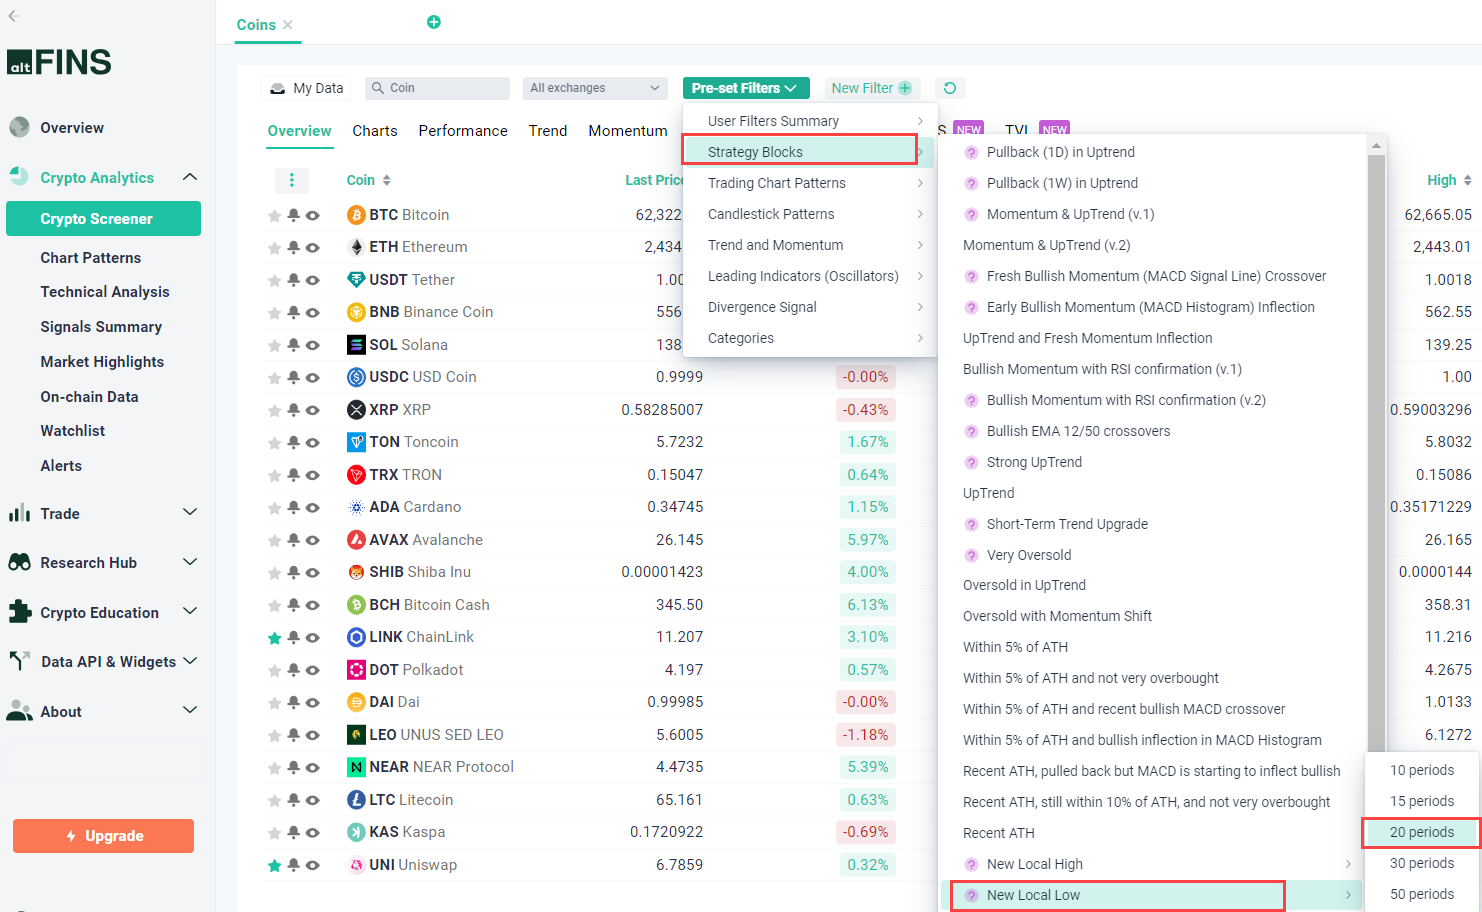
New Local Low on Crypto Screener
-
Pre-set Filters – Strategy Blocks – New Local Low – Choose Period
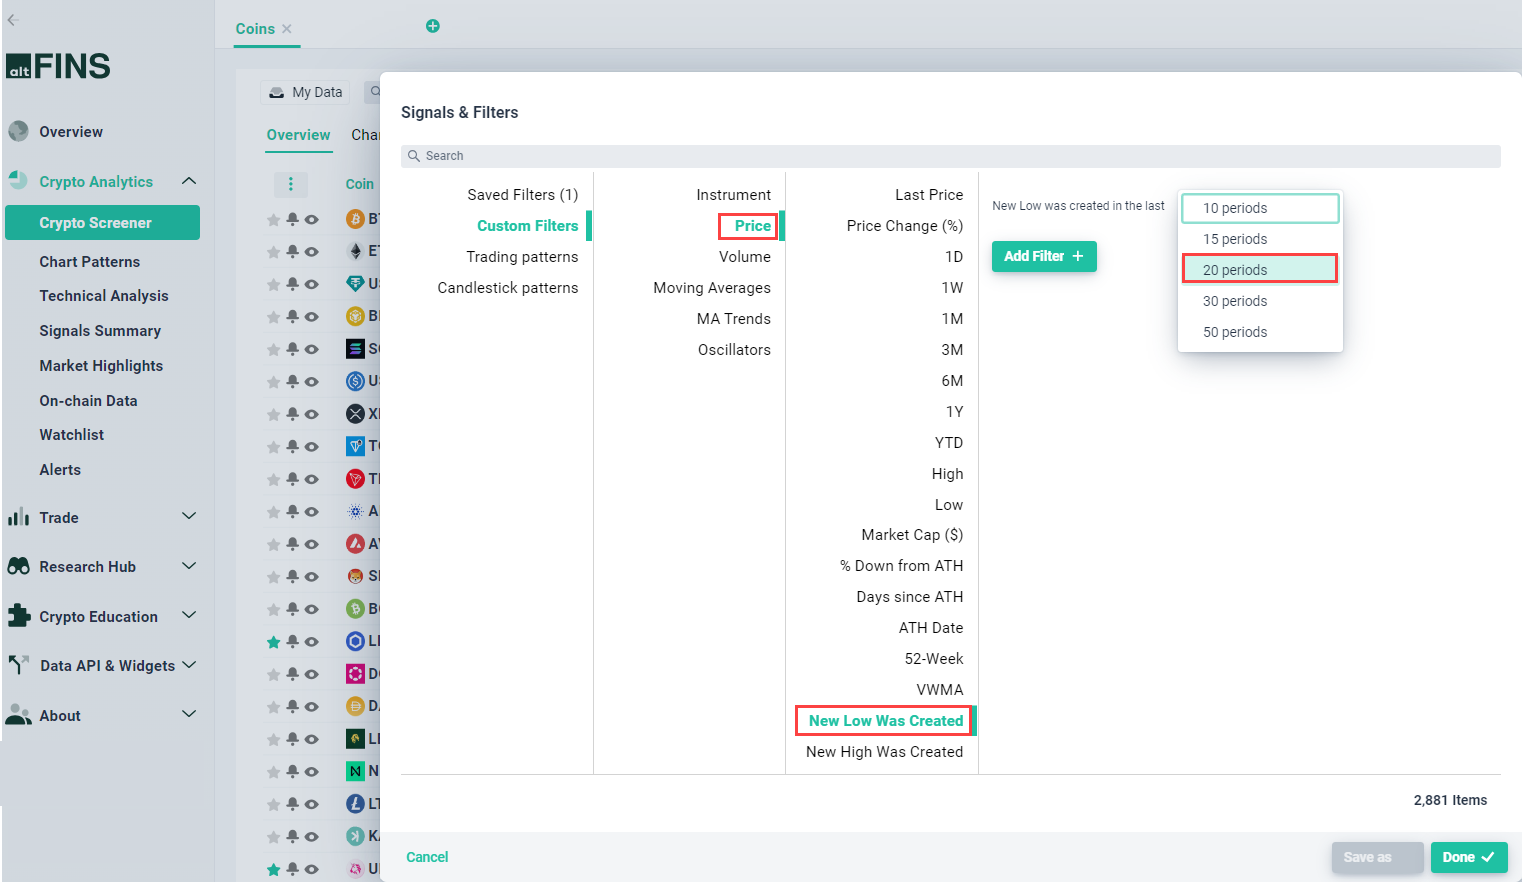
-
Custom Filters – Price – New Low Was Created – Choose Period
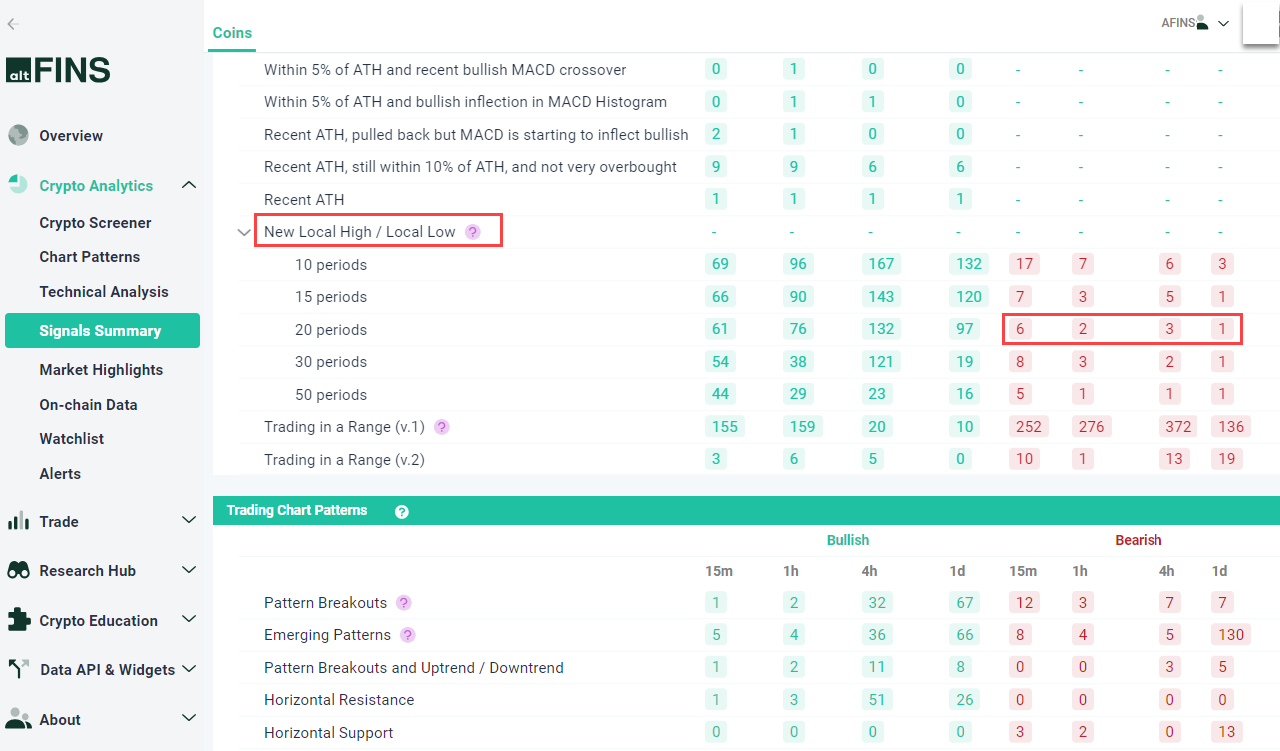
New Local Low on Signals Summary
- Strategy Blocks – New Local Low – Choose Period: You can see a summary of coins that have hit a New Local Low for a specific period.