Search Knowledge Base by Keyword
-
Overview
-
- altFINS Platform Features - Your All-in-One Crypto Trading Tool
- Why use altFINS?
- Registered user benefits
- What kind of trader are you?
- How to trade cryptocurrencies?
- How to Trend Trade Crypto
- Trading Risk Management
- What Makes altFINS One of the Best Crypto Screeners in 2025?
- What Kind Of Crypto Trading Signals Are on altFINS?
-
-
Crypto Analytics
-
- Why use it?
- Overview > Charts > Scorecards > Performance > Trend > Oscillators
- Add table columns
- Detail view
- Charts
- Create a Trading Signal or Filter
- Find SMA crossover signals
- Crypto Time Intervals
- Create an alert
- Extreme Overbought coins Due for a Pullback
- Early momentum detection
- Crypto Trend Changes
- Why And How Use altFINS Crypto Screener
- Mastering Candlestick Patterns for Successful Crypto Trading
- What Are Fibonacci Retracement Levels?
- Essential Candlestick Patterns for Crypto Traders
- Using Local High to Spot Breakouts
- Oversold in Uptrend
- Strong Uptrend
- The Hammer Candlestick Pattern
- The Inverted Hammer Candlestick Pattern
- The Hanging Man Candlestick Pattern
- The Spinning Top Candlestick Pattern
- The Dragonfly Doji Candlestick Pattern
- What is "My Data" Option on altFINS?
- The Relative Volume (RVOL) Indicator
- New Local High
- New Local Low
- Buying Coins at an All-Time-High (ATH)
- Bullish Engulfing Candlestick Pattern: A Comprehensive Guide
- The Gravestone and Perfect Gravestone Doji Candlestick Patterns
- Support and Resistance Crypto: The Complete 2026 Guide for Traders
- What Makes altFINS One of the Best Crypto Screeners in 2025?
- Crypto Volume Tracker: Spot Unusual Volume and Momentum with altFINS
- Crypto Fundamental Data On altFINS: Identifying Projects with Real Traction
- What is ATR Indicator and How to Find It on altFINS?
- Combining fundamentals with TA
- Trading RSI and RSI Divergence
- What Is the 200-Day Simple Moving Average and How to Find It on altFINS
- Show all articles ( 24 ) Collapse Articles
-
- Overview
- Emerging v. Complete
- Mastering Key Levels in Crypto Trading: The Ultimate Guide
- Consecutive Candles
- Big Movement in Trading: Understanding and Trading the Volatility
- Fibonacci Patterns
- 10 steps for how to trade crypto using Crypto Chart Patterns
- How to trade Channel Down? | Crypto Chart Pattern
- Tutorial: Using Custom Chart Pattern Filters
- How To Set Up Chart Patterns Alerts?
- How To Trade Channel Up Pattern? | Crypto Chart Pattern
- How To Trade Ascending Triangles? | Crypto Chart Pattern
- How To Trade Bullish Flag Pattern? | Crypto Chart Pattern
- How To Trade Sideways Channel pattern? | Crypto Chart Pattern
- How To Trade Rising Wedge pattern? | Crypto Chart Pattern
- How To Trade Falling Wedge pattern? | Crypto Chart Pattern
- How To Trade Descending Triangle pattern? | Crypto Chart Pattern
- How To Trade Inverse Head and Shoulders pattern? | Crypto Chart Pattern
- What is "My Data" Option on altFINS?
- How To Trade Symmetrical Triangle Pattern? | Crypto Chart Pattern
- Crypto Chart Patterns Cheat Sheet
- How Does AI Help with Crypto Trading?
- Crypto Chart Patterns
- Show all articles ( 8 ) Collapse Articles
-
- Signals Summary Overview
- How To Find And Trade Crypto Pullbacks In Uptrend (Buying Dips)?
- Momentum & Up / Down Trend
- Range in Up/Down Trend
- Momentum
- How to trade EMA 12 / 50 crossovers?
- Moving Average Ribbons
- Strong Up / Down Trend
- Strong Up / Down Trend (Short Term)
- Strong Up / Down Trend (Medium Term)
- Strong Up / Down Trend (Long Term)
- Price / SMA Crossovers In Crypto
- What are Price / EMA Crossovers in crypto?
- SMA Crossovers
- EMA Crossovers
- Crypto Unusual Volume Gainers / Decliners
- New Up/Down trend (ADX)
- Bollinger Band - Price Broke Upper / Lower Band
- Strong Up / Down Trend and Oversold / Overbought
- Strong Up / Down Trend and Strong / Weak Ultimate Oscillator
- MACD (12,27,9) Signal Line cross
- MACD (12,27,9) Center Line cross
- Commodity Channel Index cross
- Overall Score of Oscillators (Oversold / Overbought)
- Relative Strength Index (9)
- Relative Strength Index (14)
- Relative Strength Index (25)
- Stochastic RSI (3, 3, 14, 14)
- Williams Percent Range (14)
- Bull Power
- MACD line
- Relative Strength Index (RSI) Divergence: Explained
- How to Trend Trade Crypto
- Early momentum detection
- Short-Medium-Long-Term Trend
- Relative Strength Index
- Uptrend and Fresh Bullish Momentum Inflection
- Using Local High to Spot Breakouts
- Oversold in Uptrend
- Strong Uptrend
- The Hammer Candlestick Pattern
- The Inverted Hammer Candlestick Pattern
- The Hanging Man Candlestick Pattern
- The Spinning Top Candlestick Pattern
- The Dragonfly Doji Candlestick Pattern
- What is "My Data" Option on altFINS?
- The Relative Volume (RVOL) Indicator
- New Local High
- New Local Low
- Bullish Engulfing Candlestick Pattern: A Comprehensive Guide
- The Gravestone and Perfect Gravestone Doji Candlestick Patterns
- Three White Soldiers Candlestick Pattern: A Comprehensive Guide
- How Does AI Help with Crypto Trading?
- What Kind Of Crypto Trading Signals Are on altFINS?
- Trading RSI and RSI Divergence
- Show all articles ( 40 ) Collapse Articles
-
- Volume
- OBV Divergence Indicator
- SMA vs. EMA
- Trading RSI and RSI Divergence
- Stochastic (14, 3, 3) (STOCH)
- What is CCI 20? (Commodity Channel Index 20)
- ADX
- MACD Line and MACD Signal Line
- Williams %R
- Stochastic RSI Fast
- Bull / Bear Power
- What is the UO: Ultimate Oscillator (7, 14, 28)
- Short Term Trend
- Medium Term Trend
- Long Term Trend
- Oscillator Rating
- Trading Multiple Time Frames
- Support and Resistance Crypto: The Complete 2026 Guide for Traders
- Polarity principle
- Early momentum detection
- Crypto Trend Changes
- MACD Histogram (H1, H2)
- What Are Fibonacci Retracement Levels?
- Using Local High to Spot Breakouts
- Oversold in Uptrend
- Strong Uptrend
- The Relative Volume (RVOL) Indicator
- New Local High
- Buying Coins at an All-Time-High (ATH)
- Crypto Volume Tracker: Spot Unusual Volume and Momentum with altFINS
- What is ATR Indicator and How to Find It on altFINS?
- Combining fundamentals with TA
- What Is the 200-Day Simple Moving Average and How to Find It on altFINS
- Show all articles ( 18 ) Collapse Articles
- How To Trade Symmetrical Triangle Pattern? | Crypto Chart Pattern
- New Local High
- New Local Low
- Three White Soldiers Candlestick Pattern: A Comprehensive Guide
- Crypto Volume Tracker: Spot Unusual Volume and Momentum with altFINS
- What is ATR Indicator and How to Find It on altFINS?
- What Is the 200-Day Simple Moving Average and How to Find It on altFINS
- Crypto Breakouts Explained: How to Spot Winning Trades with altFINS
- Getting Started with altFINS! Your Complete Step-by-Step Guide to Crypto Trading Success
-
-
Trade Crypto
-
- Initiating a trade
- Market vs. Limit order
- Refreshing tables
- Are derivatives such as futures, options and perpetual swaps supported?
- Does altFINS charge trading fees?
- Balances
- Open Orders
- Transaction History
- Order Book & Trades in Crypto
- Connecting to exchanges
- How to trade cryptocurrencies?
- Trading Risk Management
- Crypto Portfolio Tracker
- Connect To Bitget
- Connect to Coinbase
-
-
Research Hub
-
Crypto Education
-
- Where To Buy And Sell Cryptocurrency?
- When Is The Best Time To Buy And Sell Cryptocurrency?
- Crypto Profits: Full Guide How to Take Profits In Cryptocurrency
- What Is Crypto Copy Trading?
- What Is Leverage Trading Cryptocurrency?
- Crypto Arbitrage Trading: Meaning, Signals And Opportunities
- Crypto Hot Wallet vs. Cold Wallet: What is the Difference
- Crypto Trading Strategies
- Difference Between Crypto Fundamental and Technical Analysis
- List of TOP Decentralized Exchanges 2025
- What is a Crypto Prop Trading? A Complete Guide to Crypto Proprietary Trading Firms
- The Best Crypto Prop Trading Firms
- Altrady Review: How To Achieve Optimal Trade Execution
- Crypto AI Agents Explained: Top 10 AI Agent Cryptos by Market Cap to Watch in 2025
- The Ultimate Guide to Smart Money Whales in Crypto
- The Ultimate Guide to Cryptocurrency ETFs in 2025
- How to Control Your Emotions While Trading Crypto (and How altFINS Can Help)
- HyroTrader Review: A Comprehensive Analysis
- Best Crypto Trading Bots in 2025: Coinrule vs Cryptohopper vs 3Commas
- How to Automate Your Crypto Trading with Coinrule
- OneFunded Review: Pros & Cons Revealed
- The Market's X-Ray: Liquidation Heatmaps
- Show all articles ( 7 ) Collapse Articles
-
-
About
-
AI Features
-
altFINS API
- What Is the altFINS Analytics Data API?
- Who Is the altFINS Data API For?
- Real-World Use Cases of the altFINS API
- altFINS Crypto Market & Analytical Data API
- How to Create an altFINS API Key (Step-by-Step Guide)
- The Ultimate Guide to Cryptocurrency MCP Servers in 2026: Complete Comparison for Traders, Developers & Trading Platforms
- 11 Best Crypto APIs for 2026: Comparison, Pricing & Features
- How to Connect altFINS MCP to Claude Desktop
- 8 AI-Powered Trade Strategy Prompts Using altFINS MCP
Big Movement in Trading: Understanding and Trading the Volatility
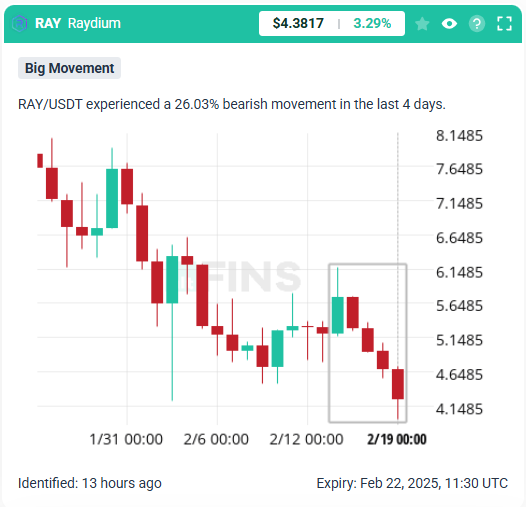
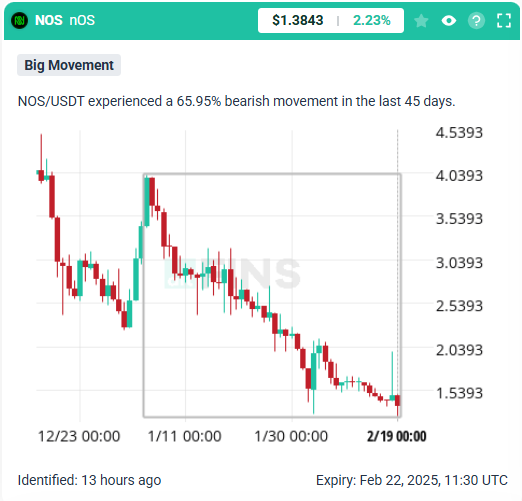
Big Movement refers to situations where a price experiences an excessively large movement, either upward or downward. These moves are statistically rare, often exceeding two standard deviations from the mean, which makes them particularly interesting for traders who follow either trend-following or mean-reversion strategies.
How to Trade Big Movements?
1. Trend Traders
For trend followers, a Big Movement may indicate the start of a new trend. If a stock, cryptocurrency, or forex pair experiences a sudden and significant price surge, it could be the beginning of an uptrend. Traders can choose to:
- Enter a position in the direction of the move immediately.
- Wait for a small pullback before entering the trade to get a better price.
- Use additional trend confirmation indicators like moving averages, MACD, or volume analysis.
2. Swing Traders
For swing traders, a Big Movement may suggest that a temporary correction or reversal is imminent. These traders look for signs that the asset is overbought or oversold and aim to capitalize on the pullback before the primary trend resumes. To trade a potential reversal, swing traders should:
- Identify overbought or oversold conditions using indicators like the Relative Strength Index (RSI) or Bollinger Bands.
- Look for reversal patterns such as Doji, Engulfing Candles, or Bearish/Bullish Divergences.
- Use stop losses to mitigate risks, as counter-trend trading can be tricky.
3. Combining Trend and Swing Trading Approaches
Sometimes, both approaches can be correct. A modest pullback may occur before the trend resumes. Swing traders may attempt to profit from the pullback, while trend followers might wait for the correction to end before entering a position in the trend direction.
Improving Trading Accuracy with altFINS AI Chart Patterns
altFINS AI chart pattern recognition is a powerful tool that detects Big Movement patterns across four different time intervals. This feature helps traders spot critical moments when a market move is statistically significant. Here’s how it works:
- 15-Minute: Ideal for short-term traders seeking rapid intraday opportunities.
- 1-Hour: Useful for day traders looking to identify momentum shifts.
- 4-Hour: Helps swing traders recognize potential reversals or trend continuations.
- 1-Day: Provides insights into broader market movements for long-term traders.
How to Find Big Movements on altFINS?
Go to the Chart Patterns section and filter Big Movement in the types section.
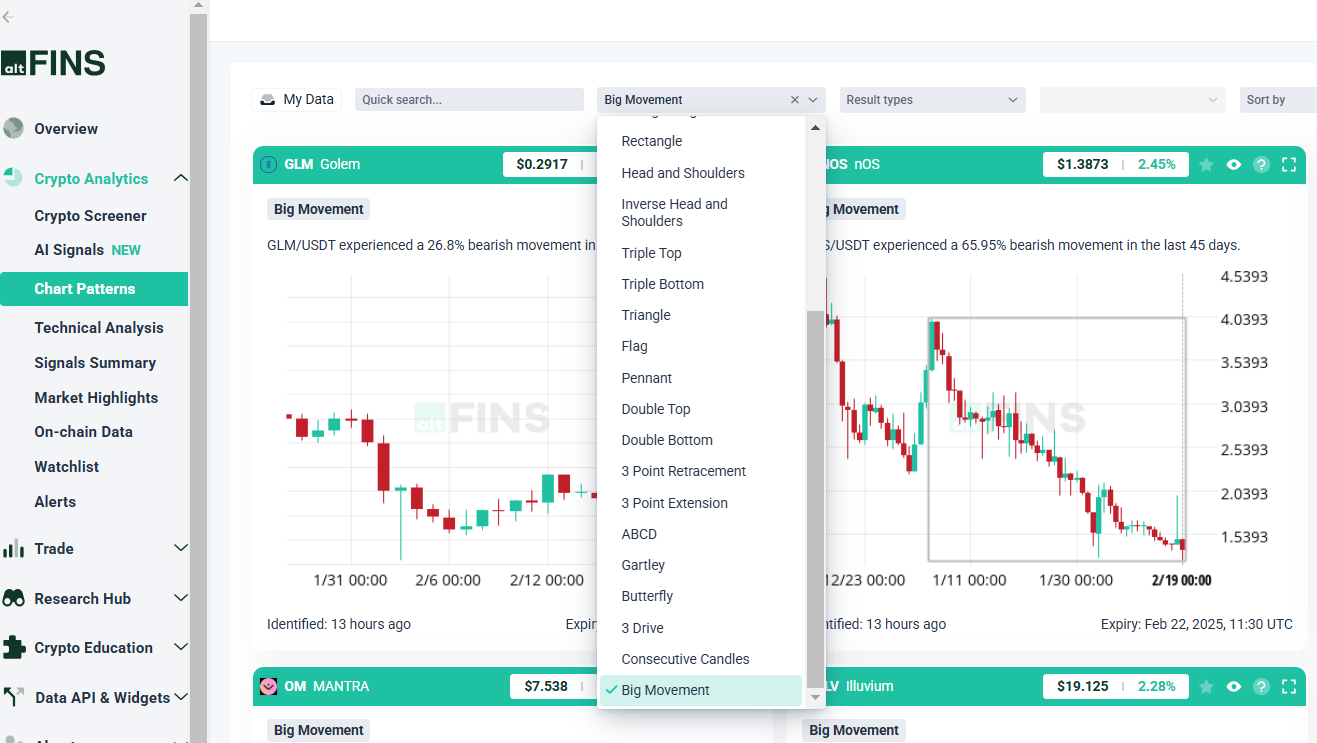
Go to the Signals Summary section and find Big Movement among patterns.
Practical Tips for Trading Big Movements with altFINS
- Confirm with Other Indicators: Use RSI, MACD, or volume analysis to validate Big Movements.
- Trade with the Trend: If the Big Movement aligns with the longer-term trend, consider following it.
- Use Proper Risk Management: Set stop losses and manage position sizes to avoid large losses.
- Monitor Multiple Timeframes: Cross-referencing signals across different time intervals can improve decision-making.
Conclusion
Big Movements create significant opportunities for both trend followers and swing traders. By leveraging altFINS AI-powered chart patterns, traders can efficiently detect and analyze these moves across multiple timeframes. Whether aiming to ride a new trend or capitalize on a temporary pullback, using a data-driven approach with AI insights can enhance accuracy and profitability in trading.
Start utilizing altFINS AI today to identify Big movements and make informed trading decisions!
