Search Knowledge Base by Keyword
Crypto Fundamental Data On altFINS: Identifying Projects with Real Traction
The Fundamental data in pre-set and custom filters on altFINS allow traders and investors to move beyond price action and focus on the core metrics that show whether a crypto project is gaining real-world usage and economic strength. These six filters help identify projects with growing user activity, strong revenue generation, and attractive valuations.
1. Annualized TR above $1 million
This filter shows projects generating over $1 million in annualized total revenue (TR), which reflects protocol fees or income from users interacting with smart contracts. Here are the coins that match this filter on the Crypto Screener.
Why use it:
This indicator highlights projects that are already achieving significant user activity and cash flow. Revenue is one of the clearest signals of utility and user demand. Projects with $1M+ in revenue are typically established, with proven use cases, and are more likely to sustain themselves over time.
When to use:
Use this filter to find mature, revenue-generating projects for long-term investing or to avoid speculative tokens with no business traction.
2. TR growth (1M) > 10%
This filter captures projects whose total revenue has grown by more than 10% over the past month. Check the projects with this filter.
Why use it:
Sustained revenue growth is a strong indicator of increasing user adoption and protocol usage. It often precedes price rallies, as growing usage tends to drive value appreciation over time.
When to use:
Ideal for traders seeking momentum plays with strong fundamentals, or investors wanting to catch rising stars early in their growth cycle.
3. Market Cap / TR under 10x
This filter finds projects with a market capitalization that is less than 10 times their annualized total revenue. It’s similar to a price-to-sales (P/S) ratio in traditional finance. See live results.
Why use it:
A lower Market Cap / TR ratio indicates a project may be undervalued relative to its revenue. It can help identify mispriced assets that are delivering strong economic output compared to their market valuation.
When to use:
Use this filter to identify value opportunities—projects where strong fundamentals are not yet fully priced in by the market.
4. TVL above $10 million
This filter shows projects that have more than $10 million in Total Value Locked (TVL), which measures the amount of capital users have deposited in a protocol. These are projects with TVL above $10 million.
Why use it:
High TVL is a sign of user trust and adoption. Users are willing to lock assets in a protocol only if they believe it’s secure and valuable. TVL also reflects liquidity, which is crucial for DeFi operations.
When to use:
Use this filter to find established DeFi protocols with strong user participation and capital commitment.
5. TVL growth (1M) > 10%
This filter identifies protocols whose TVL has increased by more than 10% over the past month. Here are live filter results.
Why use it:
A growing TVL signals increasing user confidence and capital inflow. It may indicate improving fundamentals, successful product launches, or rising demand for yield opportunities.
When to use:
Ideal for spotting protocols gaining momentum, especially in yield farming, staking, or new chain ecosystems.
6. Market Cap / TVL under 0.1x
This filter finds projects whose market capitalization is less than 10% of their TVL.
Why use it:
This may indicate a deeply undervalued asset—one that controls large amounts of locked capital but has a low market valuation. These projects can be overlooked by the market and offer upside potential if investor attention increases.
When to use:
Use this to find value plays and hidden gems, especially during market corrections or when searching for asymmetric opportunities.
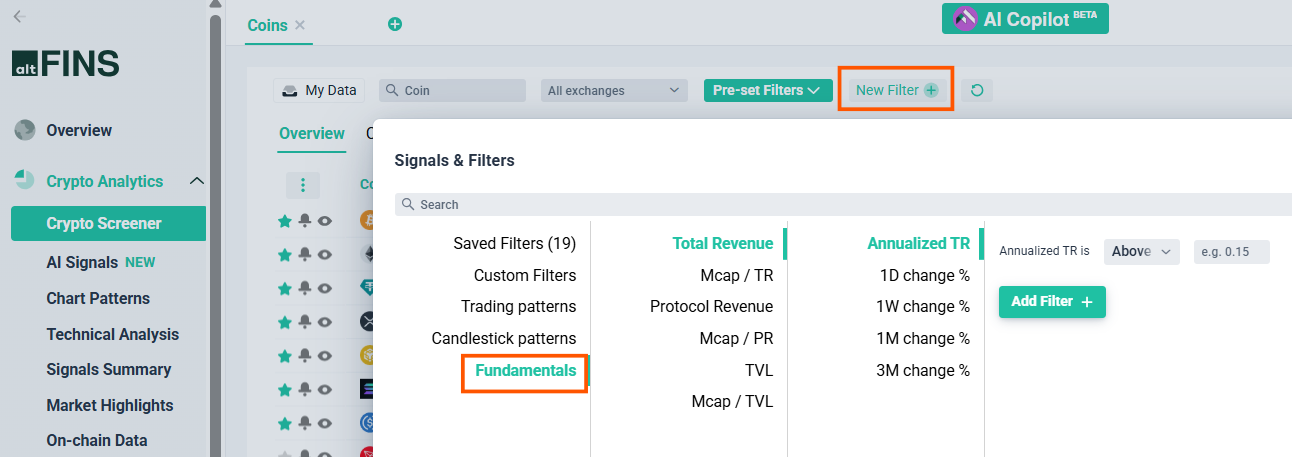
How to Access Fundamental Filters on altFINS
To view fundamental data filters, navigate to the Crypto Screener:
- Navigate to Pre-set filters – Fundamentals and choose from 6 filters.
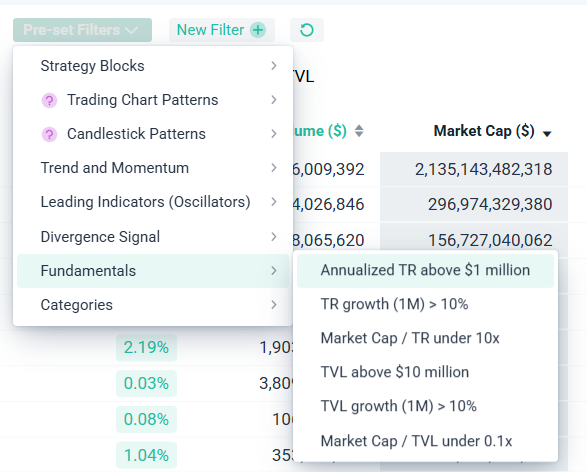
- Or create your a new, custom filters on altFINS Screener
On- Chain Data on altFINS Crypto Screener
To see all on-chain data go to Crypto Screener and check the tabs: Revenue, Mcap / S, TVL, Revenue Charts, TVL charts:
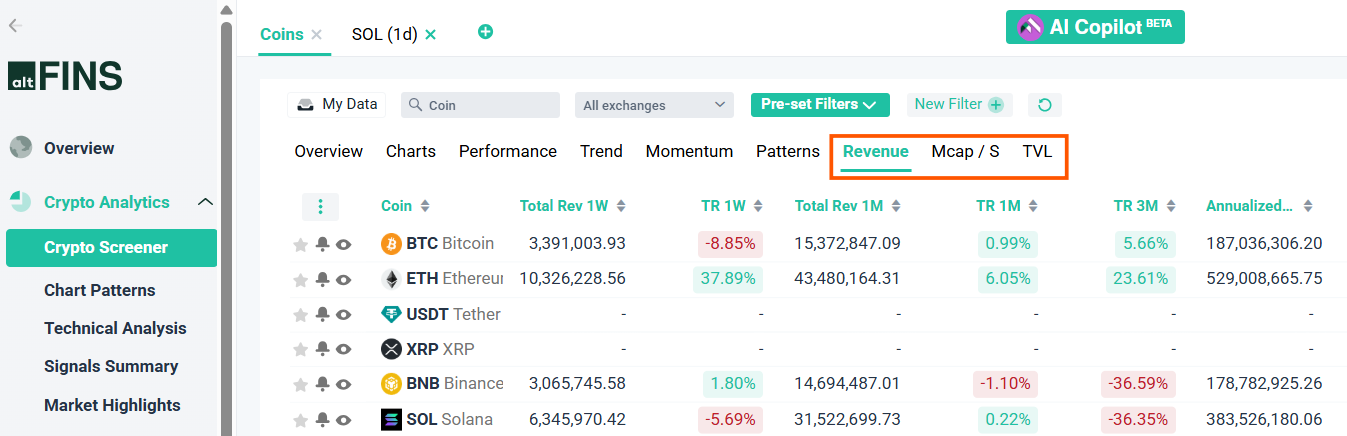
The three data categories highlighted in the red rectangle – Revenue, Mcap/S, and TVL – represent key fundamental indicators for evaluating crypto projects on altFINS. Here’s what each one means:
1. Revenue
This tab shows total revenue (TR) metrics, such as:
- Total Rev 1W / 1M / 3M: Total revenue generated from protocol fees over 1 week, 1 month, or 3 months.
- TR % changes: Revenue growth or decline over each time period.
- Annualized Revenue: An estimate of what the project would earn in a year based on recent revenue activity.
Why it matters: Revenue reflects real protocol usage – how much users are paying to use the platform. It’s a strong indicator of demand, utility, and sustainability.
2. Mcap/S (Market Cap / Sales)
This is a valuation ratio comparing the project’s market cap to its annualized total revenue (sales). It works similarly to the Price-to-Sales (P/S) ratio in traditional finance.
A lower ratio means the project may be undervalued relative to its revenue.
A higher ratio may suggest it’s overvalued or speculative.
Why it matters: This helps investors compare fundamentals vs market expectations and find undervalued opportunities.
3. TVL (Total Value Locked)
This tab shows how much capital is locked inside the protocol—through staking, lending, liquidity pools, or other mechanisms.
Includes TVL growth % over different time frames.
Also includes Market Cap / TVL ratio, which helps assess value efficiency.
Why it matters: TVL reflects user trust and engagement. Higher TVL = more usage and liquidity. It’s a key metric for DeFi protocols in particular.
These tabs provide powerful tools for evaluating a project’s real-world traction, growth, and valuation – beyond just price charts.
On-Chain Data Section on altFINS
The On-Chain Data section on altFINS provides a visual overview of key blockchain activity metrics that help traders and investors evaluate the real usage and valuation of crypto projects. Go to on-chain data section.
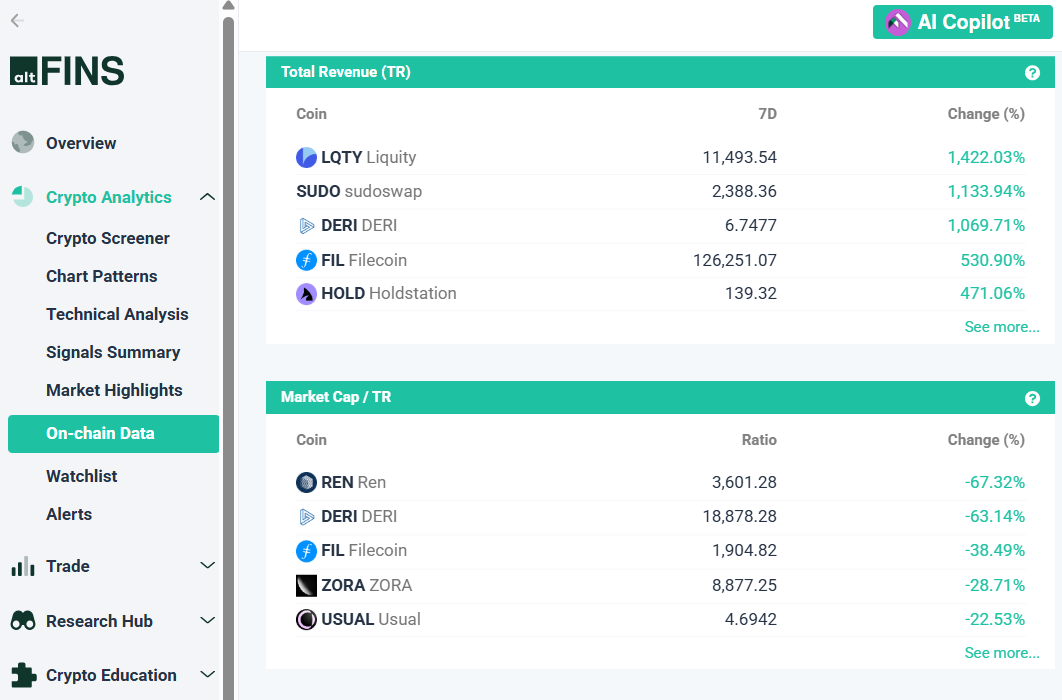
On-chain data section includes interactive charts and weekly rankings based on:
1. Total Revenue (TR)
Shows how much revenue each protocol is generating from user activity (e.g., trading fees, lending interest). High revenue signals strong user demand and active ecosystems.
2. Market Cap / TR Ratio
Compares a project’s market capitalization to its total revenue. A lower ratio may suggest the asset is undervalued relative to its actual usage.
3. Protocol Revenue (PR)
Measures the amount of total fees that go directly to the protocol (not validators or miners). This is often used to evaluate how much value accrues to token holders or the treasury.
4. Market Cap / PR Ratio
This valuation ratio helps assess whether a project is generating meaningful revenue compared to its size. Projects with low ratios may offer better risk-reward potential.
5. Total Value Locked (TVL)
Indicates how much user capital is deposited in a protocol. It’s a strong sign of user trust and protocol adoption, especially in DeFi.
6. Market Cap / TVL Ratio
Helps evaluate how efficiently a project is priced based on its locked value. A low ratio can indicate undervaluation or efficient capital use.
7. Weekly Gainers and Losers
Lists top-performing and worst-performing projects each week based on changes in TR, PR, and TVL. This helps identify trending projects and sudden shifts in user activity.
Conclusion
Fundamental data filters on altFINS give traders and investors a deeper lens into what truly drives a crypto project’s value beyond short-term price swings. By focusing on metrics like revenue, TVL, and valuation ratios, users can identify projects with real user activity, capital inflow, and long-term sustainability.
Whether you’re searching for:
- Profitable, proven projects (e.g., $1M+ in revenue),
- High-growth protocols (e.g., 10%+ TR or TVL growth),
- Undervalued opportunities (e.g., low Market Cap/Revenue or Market Cap/TVL),
…the altFINS Crypto Screener provides powerful tools to uncover real, data-driven investment ideas—no hype, just insight.
