Technical analysis of ZEC, MKR
ZEC – Price at a Critical Juncture – Can It Break Out of a Sideways Channel or Descending Triangle? Will Zcash Halving be a Catalyst?
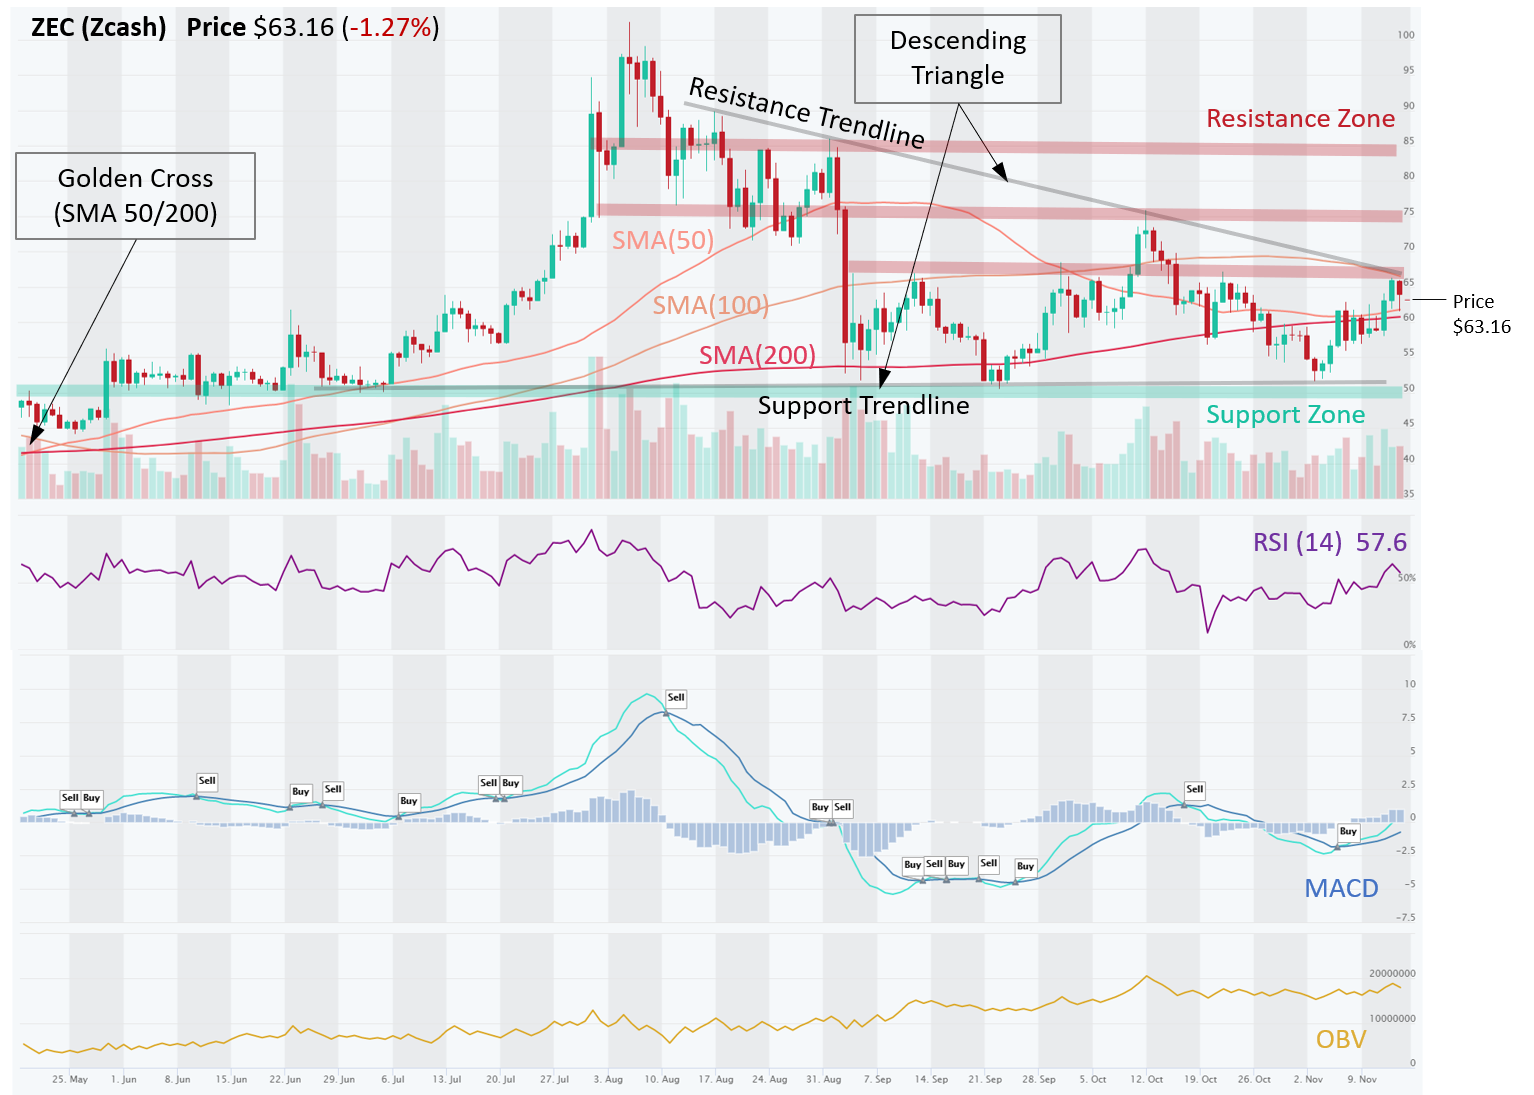
ZEC (Zcash), a privacy cryptocurrency, is in a Downtrend on Long- and Medium-Term horizons, while Shot-Term trend has flattened out into a sideways Channel between a very strong Support Zone at ~ $50, which was recently retested, and a Resistance Zone at ~ $65. Also, there is a Descending Triangle emerging, which typically is a bearish continuation pattern. Meaning that when it forms in a Downtrend, Descending Triangle tends to resolve to the downside with a break through the Support Trend line.
Currently, the price is at a critical juncture, sitting at the horizontal Resistance Zone and the Triangle Resistance Trendline. Most likely it will get rejected and retrace to the Support Zone and Triangle Support Trendline at $50. However, if we get a breakout above $65, it could go to the next Resistance Zone of $75 and then the next stop would be $85.
Momentum indicators (MACD crossover, RSI > 50) have turned bullish during the latest upswing within the Channel, and OBV has been steady, with volume on Up days about equal to Down days, suggesting a relative balance between buyers and sellers. Our best guess is that price will remain in the $50-$65 channel, for now, or even within the Descending Triangle trendlines as they gradually converge. Channel pattern is tradable by Buying Support and Selling Resistance.
Interestingly, there’s a potentially significant fundamental event coming up: Zcash block reward halving. Zcash evolved from Bitcoin’s code and retained its deflationary monetary policy, which means it goes to reward halving every few years. Here’s a good research report on Zcash.
MKR – Stuck in a Sideways Channel, Trade It
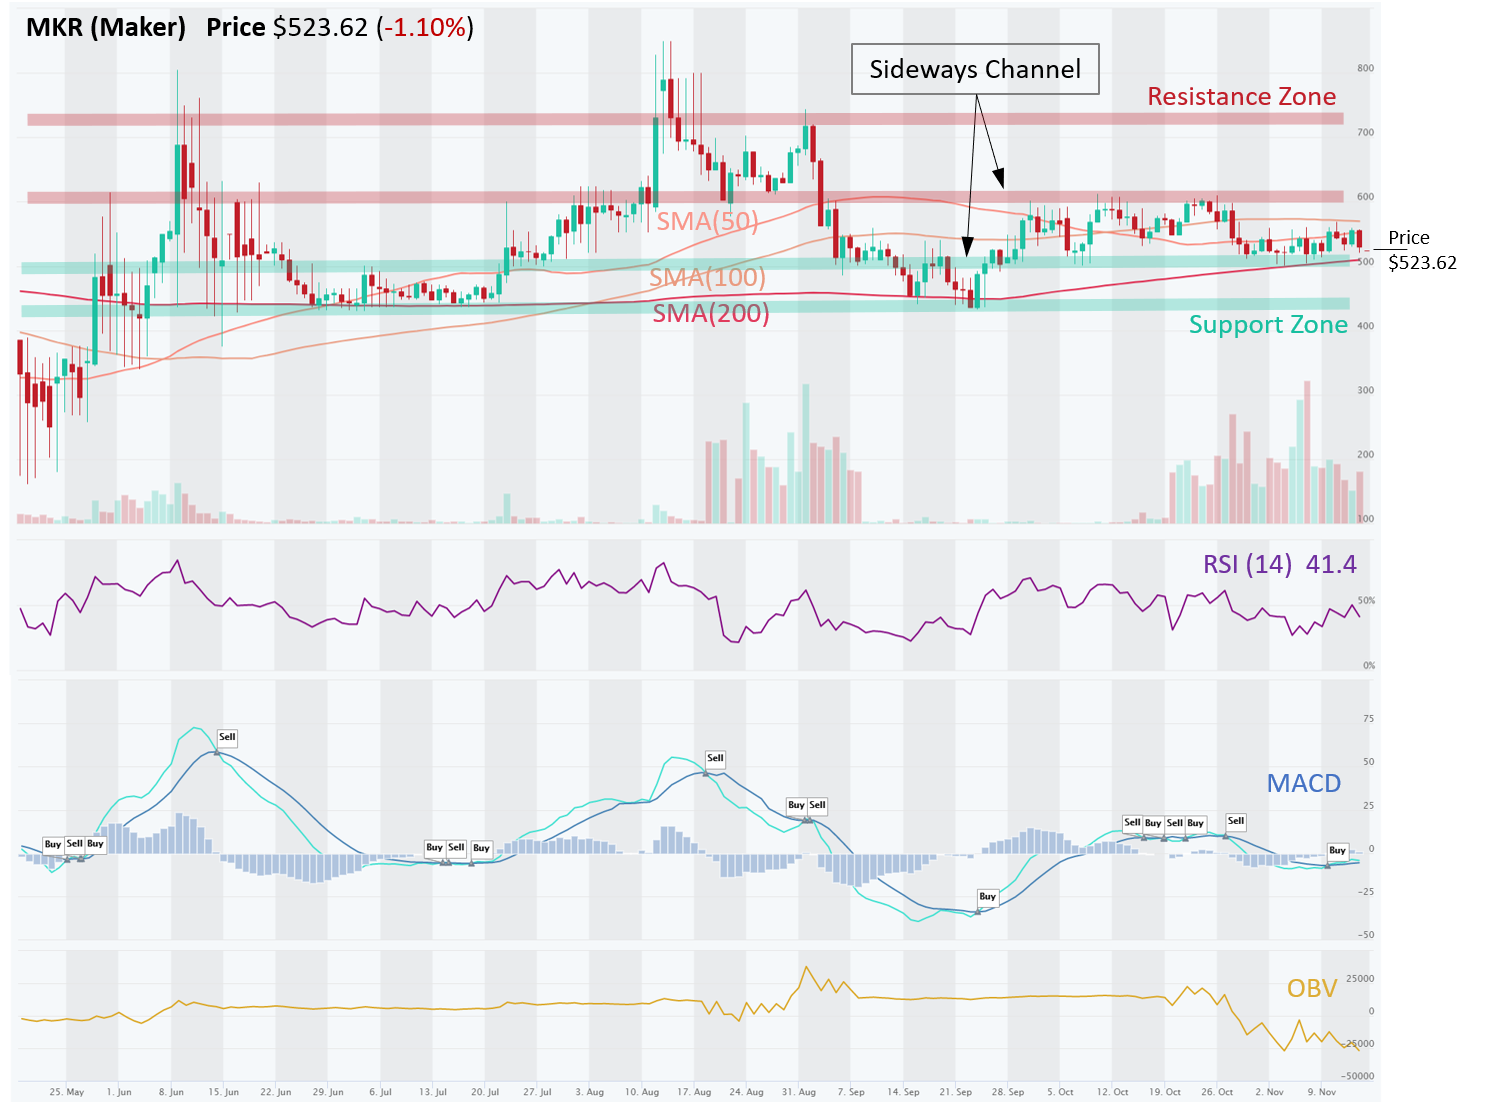
MKR (Maker), one of the earliest DeFi projects, is trading in a sideways Channel between $500 and $600. This Channel can be traded (Buy Support, Sell Resistance) and currently the price is near a Support Zone (~$500) as well 200-Day SMA, which also reinforced the Support level. In fact, price has respected the 200-Day SMA on several occasions this year. OBV (volume on Up days vs. Down days) has been trending down, indicating that sellers are overwhelming buyers. While MACD has turned bullish recently, it is not that reliable in a sideways price action (lots of whipsaws), especially in light of bearish signals from RSI and OBV. Price is likely to bounce off the strong Support Zone and 200-Day SMA, but if not, the next Support is at around $430.
Risk management – Stop Loss and trade size. In all of these setups, traders should use Stop Loss orders to manage their downside risk, in case the trade goes against us, as it often will. Trading is about probabilities and even though these setups have a high win rate, one must be prepared to minimize losses on the trades that go bust. If Stop Loss order types are not supported by they exchange, at least set up a price alert (see video). Also, trade size should be such that you never risk losing more than 2% of your total equity. Keeping the trade size small allows the trader to setup a wider Stop Loss, which gives the trade more room and time to complete with success. Setting Stop Loss levels too tight can often result in getting knocked out of a trade prematurely.
Disclaimer: This content is for informational purposes only, you should not construe any such information or other material as investment, financial, or other advice. There are risks associated with investing in cryptocurrencies. Loss of principal is possible.