Technical analysis of OMG, DOGE, WAVES, CEL
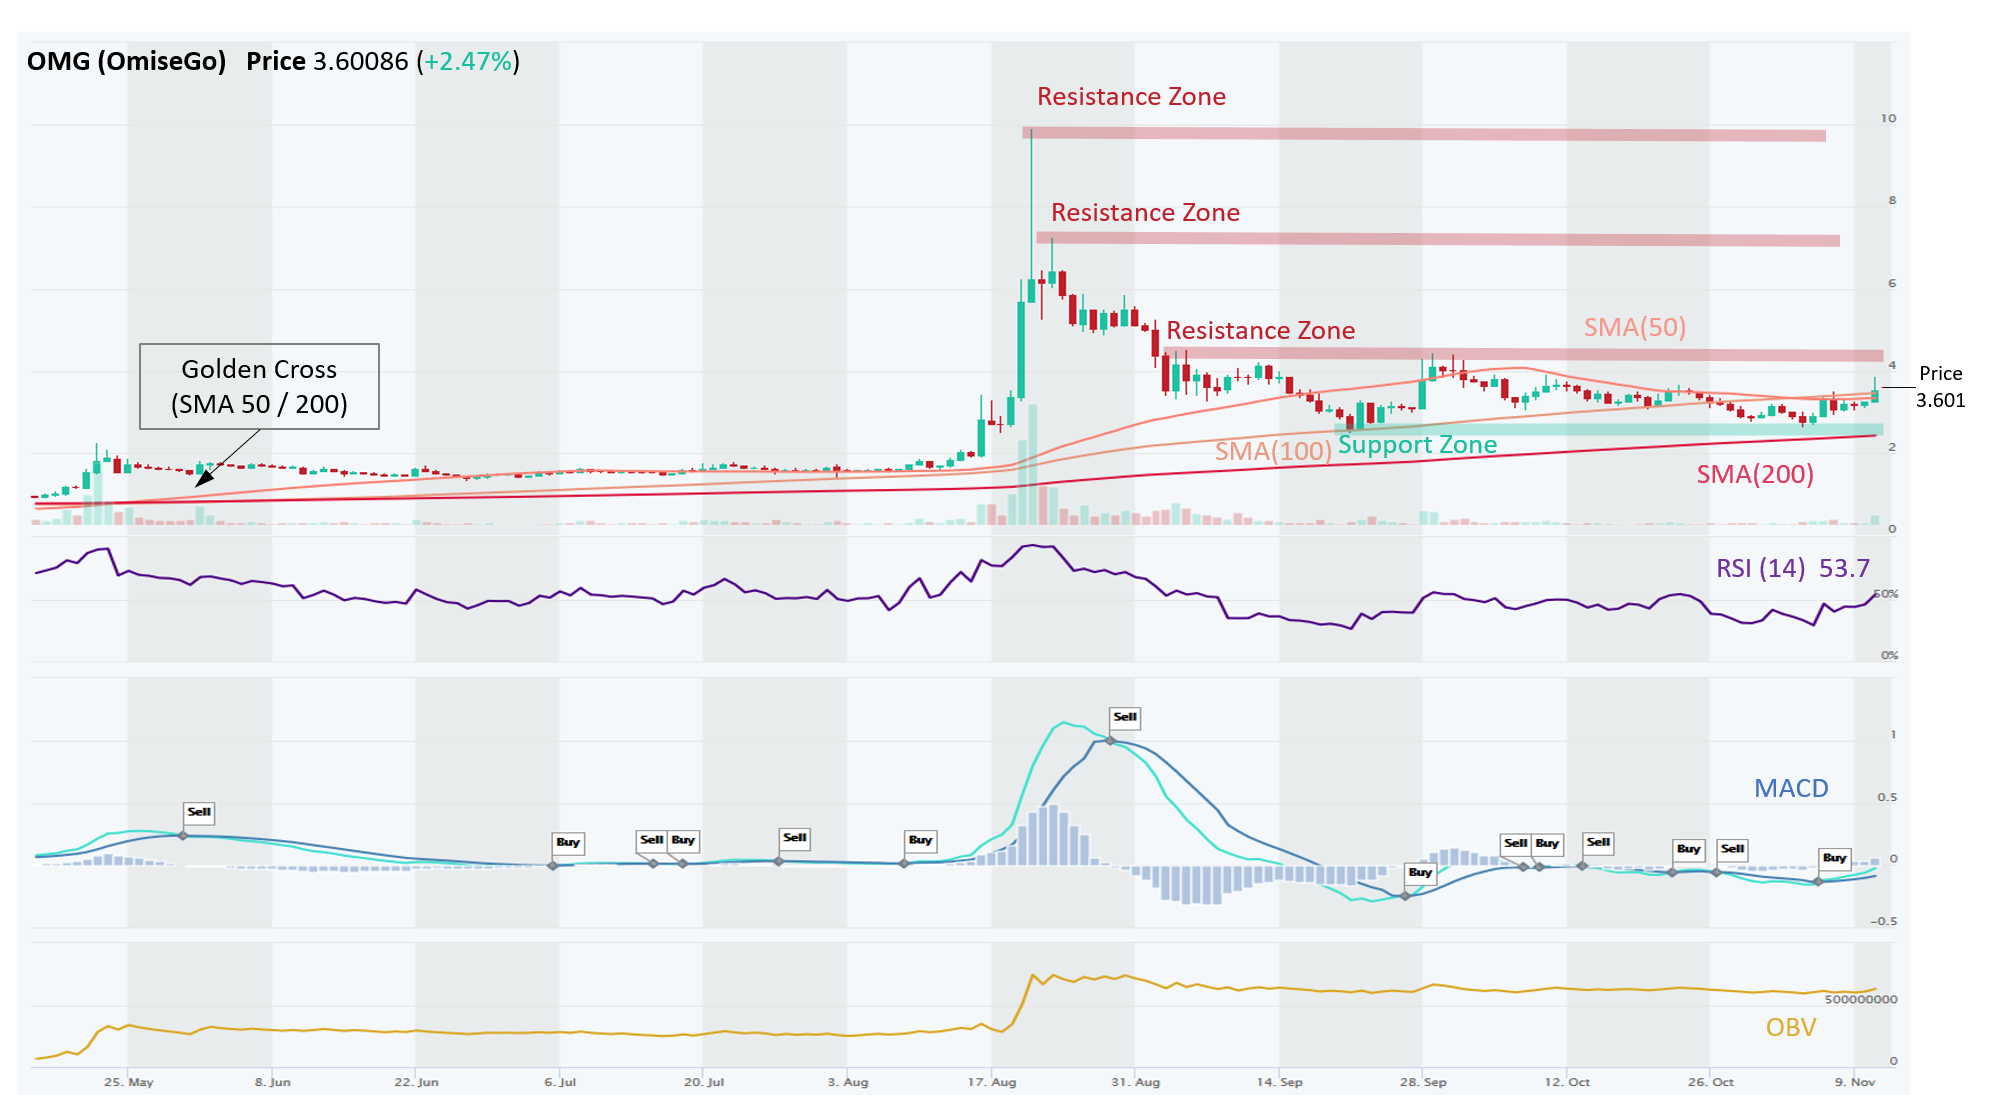
OMG – Stuck in a Range Without Offering Clues Which Way is Next; Just Trade the Range
OMG (OmiseGo) has uncertain Long-Term trend (Neutral), while Medium-Term is down. OMG has experienced lots of action since May. There was a long period of consolidation until mid-August, then it went parabolic and produced a blow-off top at $10.00. Then it sharply fell by 75% and is consolidating again in a sideways range. Since OMG had a wild price action, it has many resistance levels over its head (~$4.40, ~$7.30 and ~$10.00). The question is whether OMG is ready to break out of its consolidation range. Both, MACD and RSI momentum indicators had bullish crossovers recently, but those have not been reliable crypto signals in a sideways trading range, as momentum quickly faded several times in the last two months. The price needs to break the first resistance zone at ~$4.40, which is holding steady since September. OBV has been flat, indicating that volume on Up days and Down days have been mostly equal. Neither buyers nor sellers have had much conviction. All major SMAs are losing width, for example SMA(50) already crossed SMA(100) from above, which is bearish. Based on ADX, current trend is weak, which also suggests that consolidation phase for OMG is not over. Traders can trade the range (Buy Support, Sell Resistance) until there is a breakout (Up or Down).
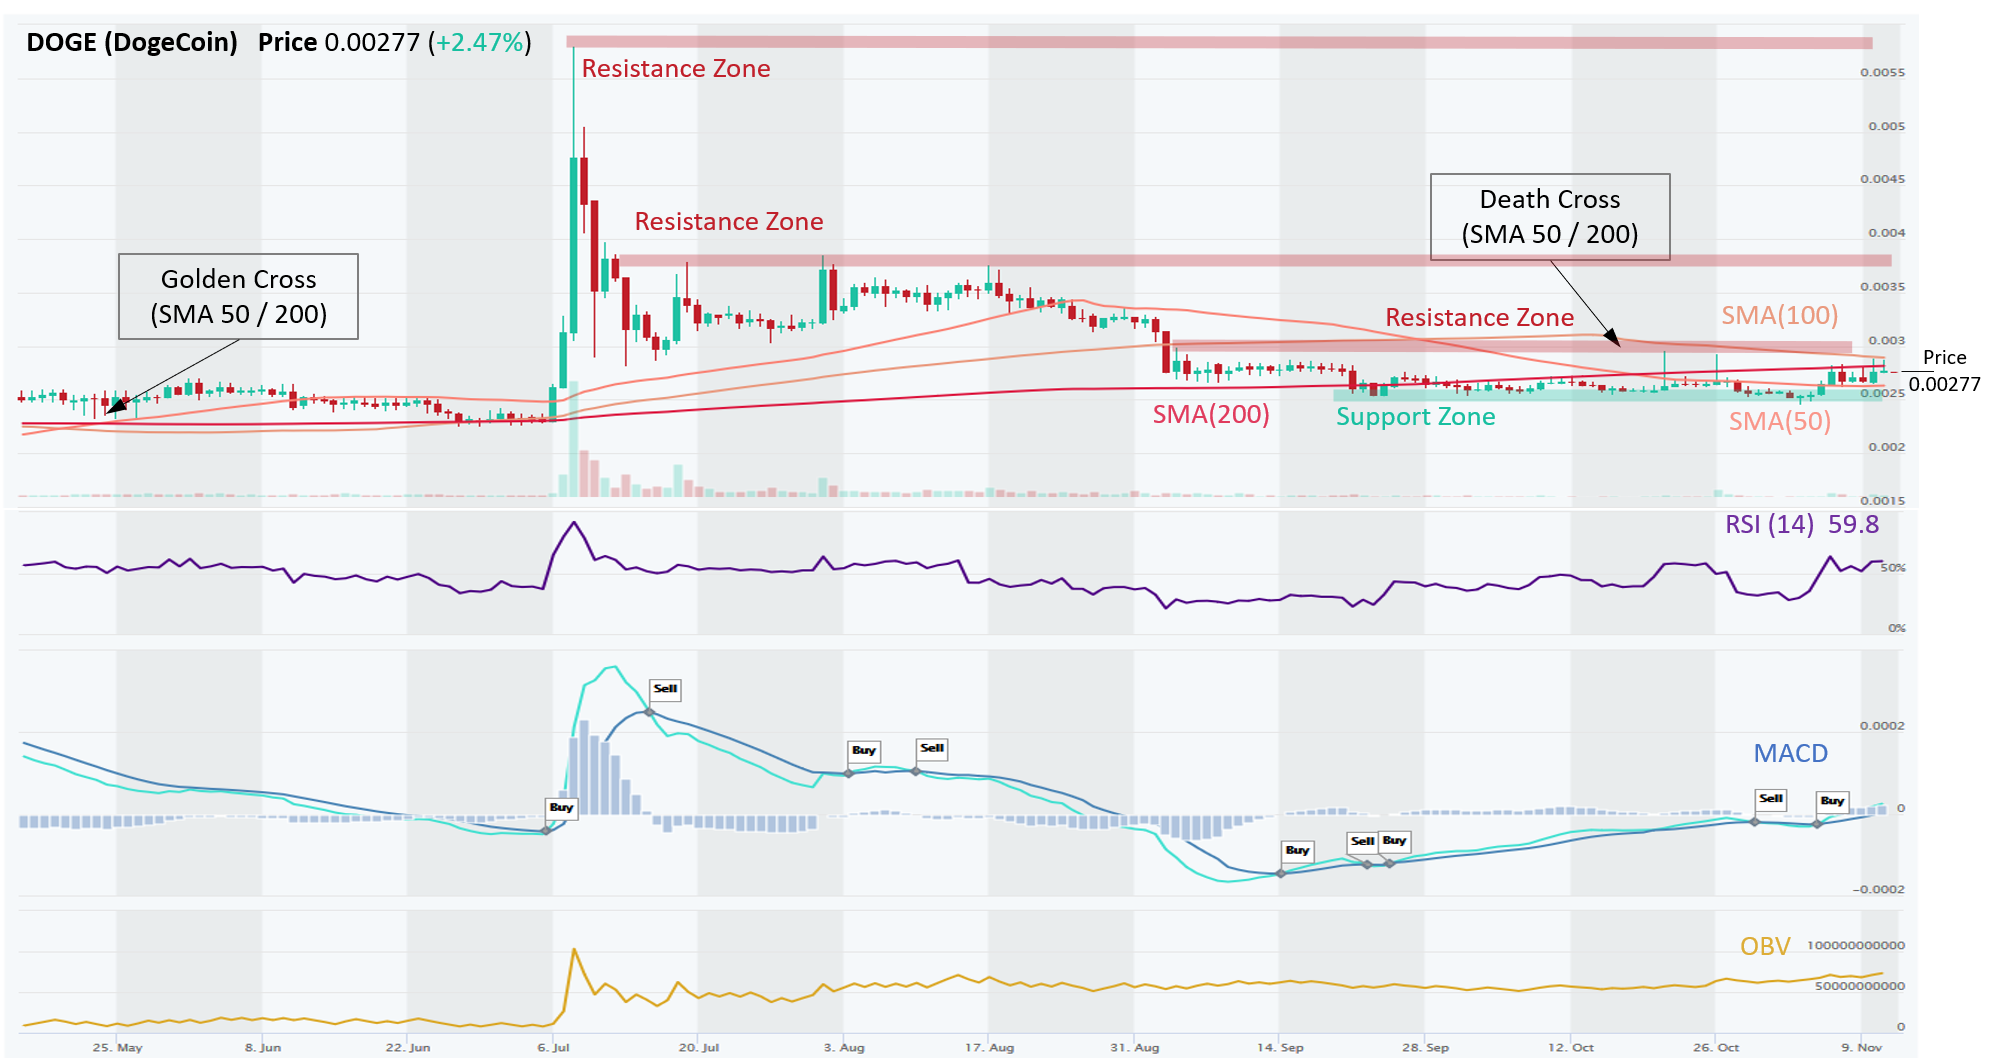
DOGE – Can Recent Momentum Push Price Above a 2-month Old Resistance?
DOGE (DOGE) is in aLong-Term Downtrend, while the Medium- and Short-Term trends have stabilized. Since September, DOGE has been trading in a narrow range ($0.0025 – 0.0030), which can be traded (Buy Support, Sell Resistance) until there is a breakout (Up or Down). Recently, momentum indicators, RSI and MACD, had bullish crossovers, which together with improving OBV (higher volume on Up days vs. Down days) and ADX above 40 (strong trend) all pain a positive picture Short-Term. Recent Death Cross (SMA 50/200) keeps us skeptical, but if price breaks above $0.003, the next Resistance is ~ $0.0037, or 20%+ higher.
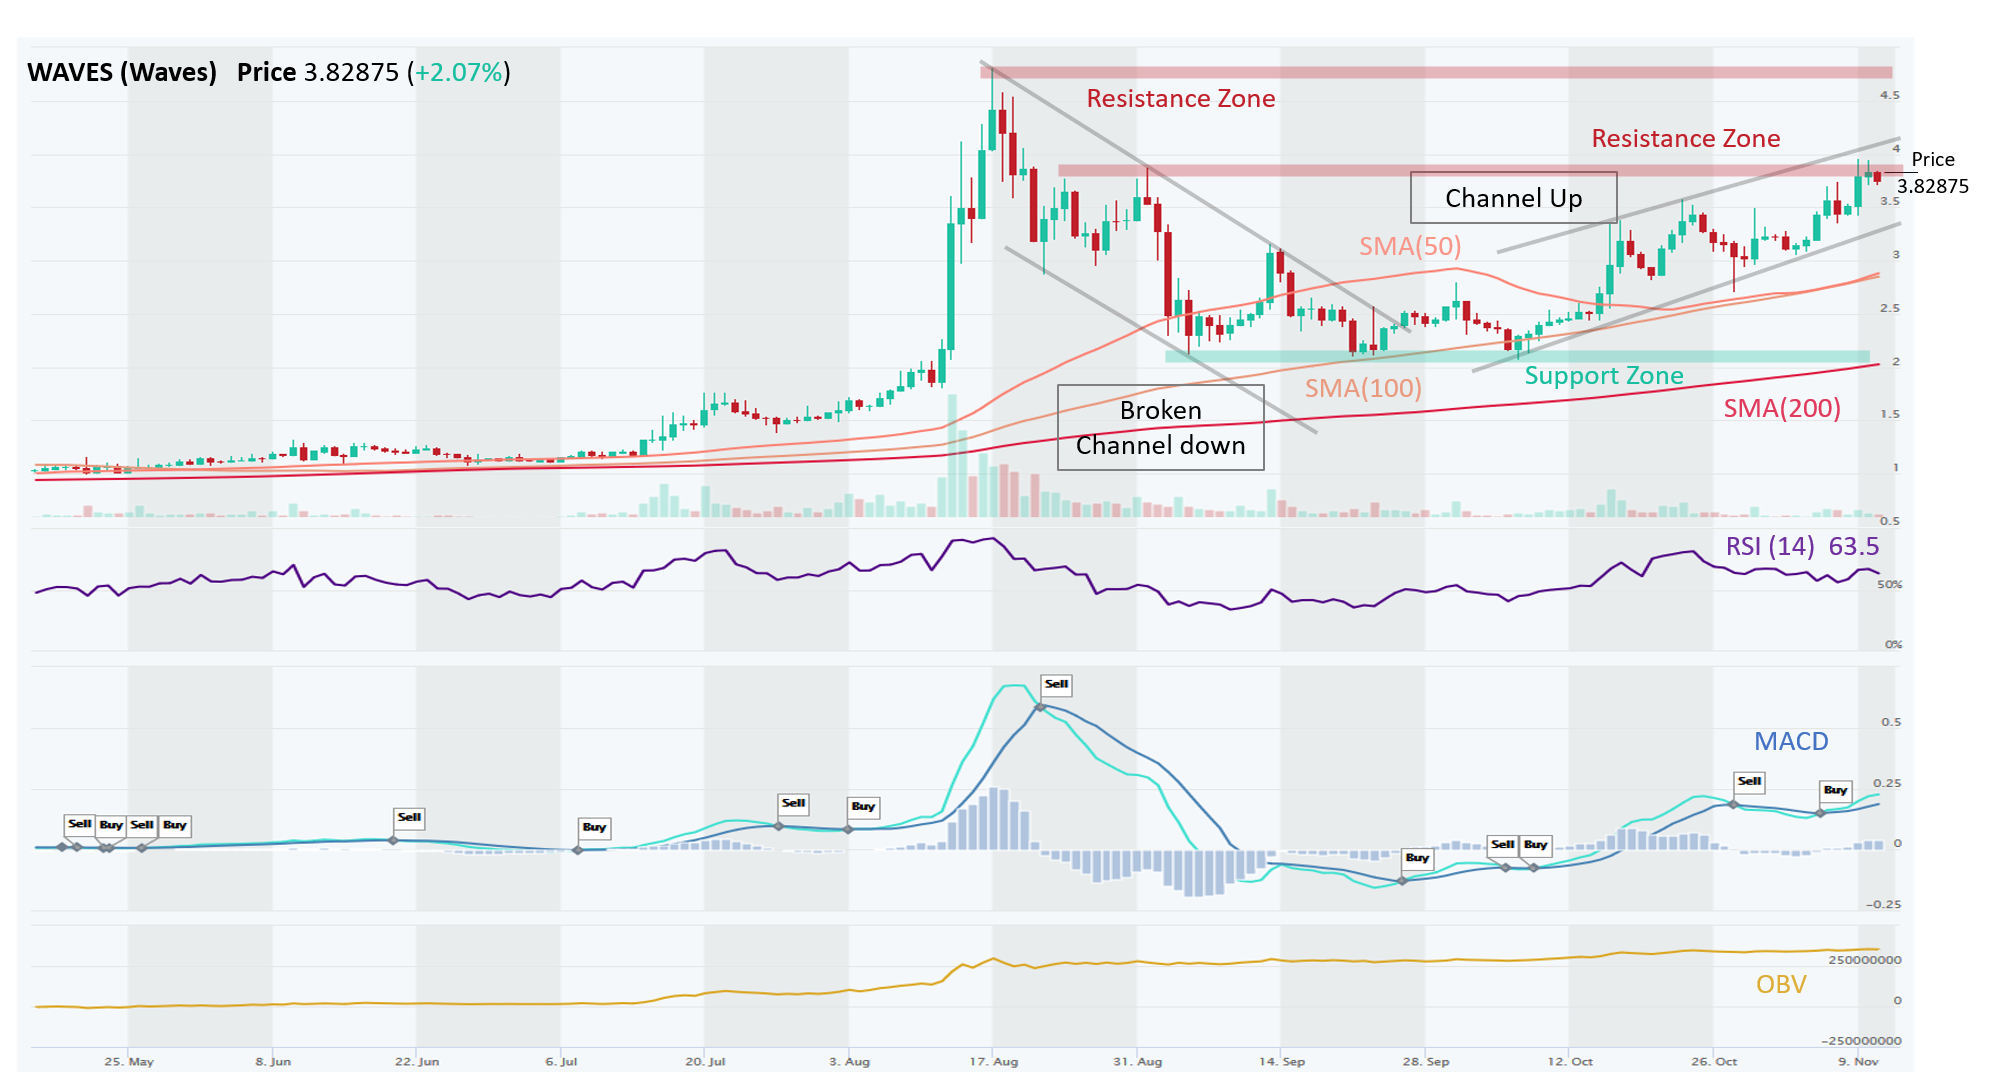
WAVES – Solid Uptrend and Up Channel, but Could Get Tested at Resistance Level; Plus Bearish RSI Divergence
WAVES (Waves) is in a solid Uptrend across all time horizons (Short-, Medium-, Long-Term). WAVES is currently trading in an Up Channel. Price is above major SMAs, confirming the Uptrend. What is concerning is that RSI is trending downwards since Oct-23, while price has made higher highs. This is known as a bearish divergence. OBV also seems flattish lately as volume on Up days is about the same as on Down days. So price has made higher highs but without convincing volumes from buyers. According to ADX, trend strength is neutral. Having reached a horizontal Resistance Zone at ~$3.80 and the Upper Channel Trendline resistance, price is likely to consolidate for a few days and maybe approach the Support Trendline around $3.50, before resuming Upward trajectory. If it clears the $3.80 level, the next stop is likely $4.50 Resistance.
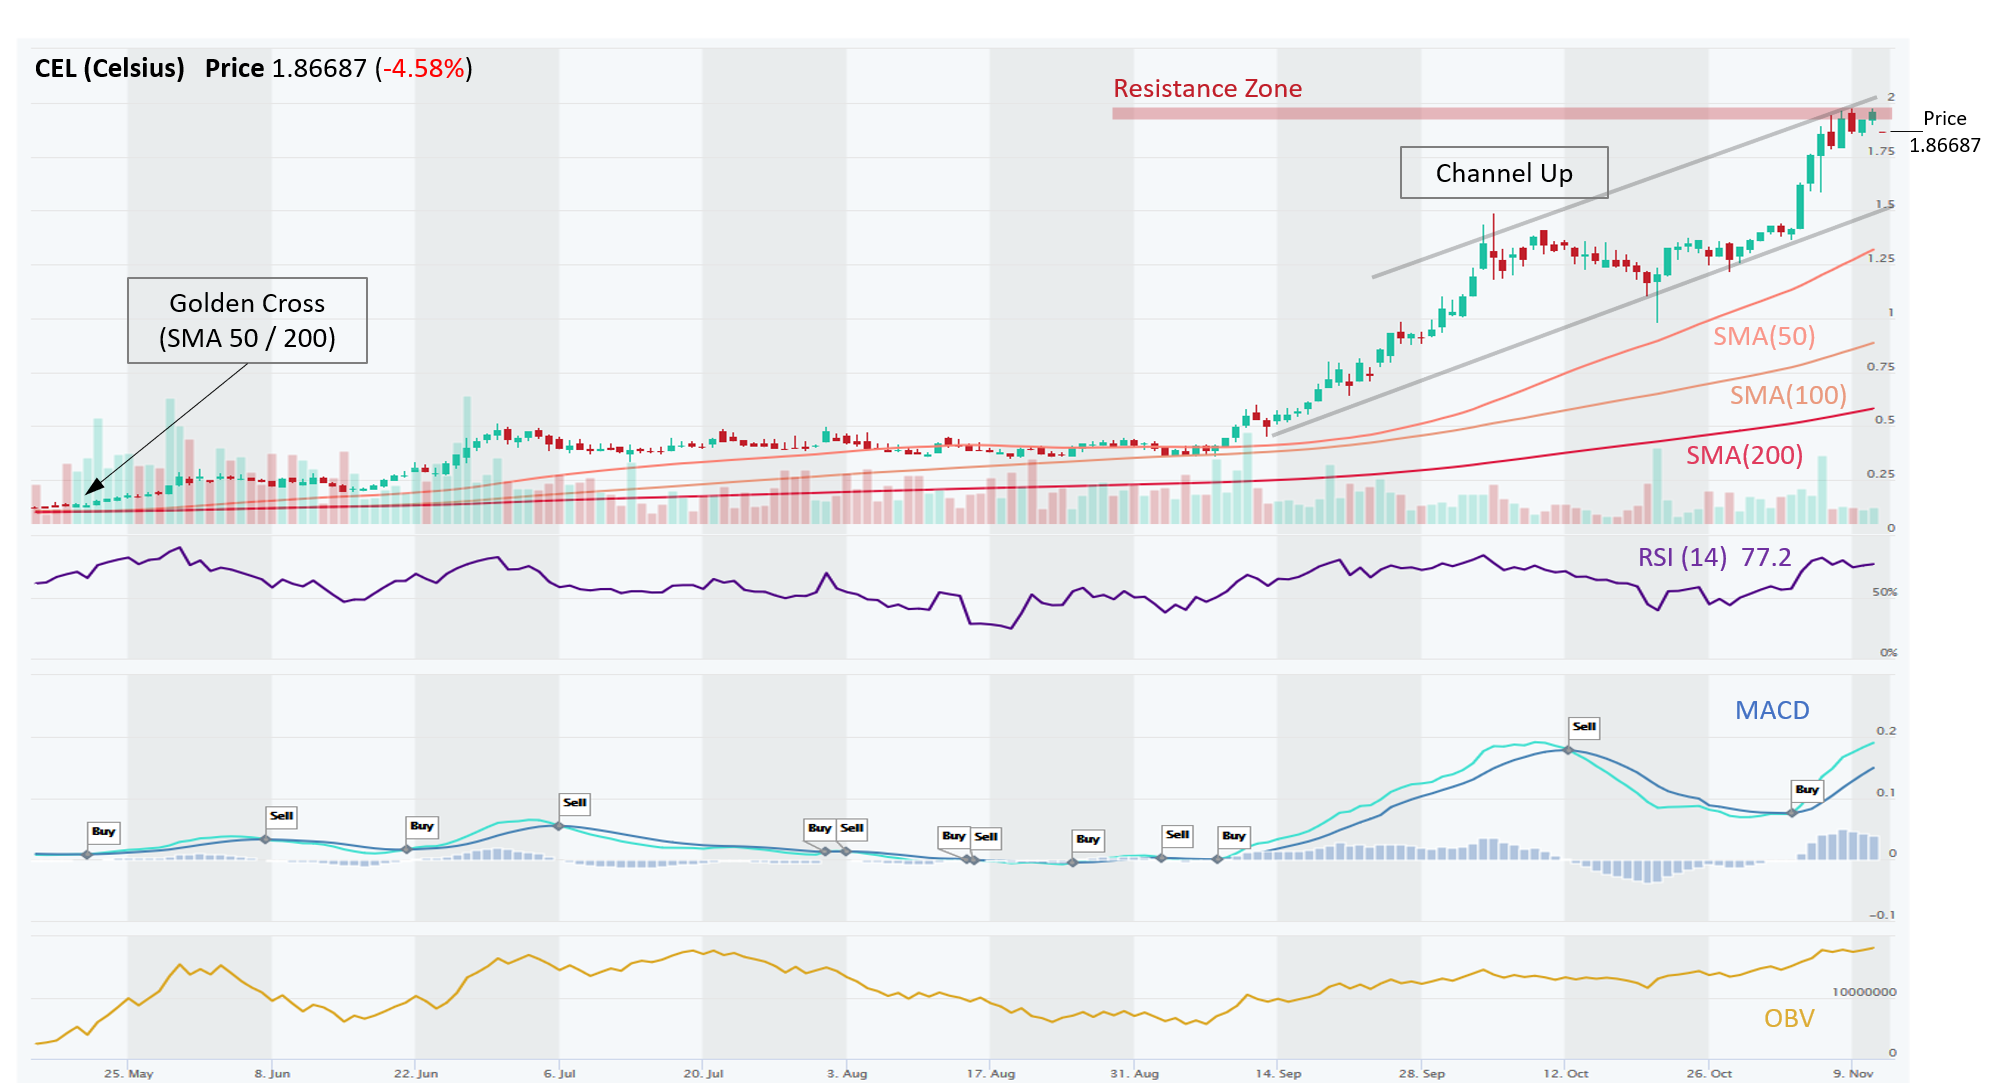
CEL – Strong Uptrend and Up Channel Likely to Continue After a Brief Breather
CEL (Celsius) is in a strong Uptrend across all time horizons. CEL is trading in a beautiful Up Channel; all major SMAs are below the price, which provides lots of support for the coin, along with Channel Trendline support. Also, major SMAs seem to expand from each other, which along with bullish MACD and RSI crossovers indicate that momentum is still growing. CEL paused its march upwards at ~$2.00, hitting the Channel Trendline resistance. Even though CEL has paused, OBV is increasing (volume on Up days exceeding volume on Down days), which adds confidence that this consolidation may be brief and price could continue marching upwards. Based on ADX the trend is strong. CEL’s price action has been very swift since September and its nearest major Support Zone sits at ~1.375 (which was previously a Resistance Zone – this switch is known as Polarity), which is about 30% lower.
Risk management – Stop Loss and trade size. In all of these setups, traders should use Stop Loss orders to manage their downside risk, in case the trade goes against us, as it often will. Trading is about probabilities and even though these setups have a high win rate, one must be prepared to minimize losses on the trades that go bust. If Stop Loss order types are not supported by they exchange, at least set up a price alert (see video). Also, trade size should be such that you never risk losing more than 2% of your total equity. Keeping the trade size small allows the trader to setup a wider Stop Loss, which gives the trade more room and time to complete with success. Setting Stop Loss levels too tight can often result in getting knocked out of a trade prematurely.
Disclaimer: This content is for informational purposes only, you should not construe any such information or other material as investment, financial, or other advice. There are risks associated with investing in cryptocurrencies. Loss of principal is possible.