Technical analysis of BNB, LTC, ADA, EOS, XMR
We’ve decided to crank through the top 100 coins and curate their charts. We’re starting with these five, we’ll have 5-10 each day for the next…well many days. We’ll also add these to our platform in the near future, and keep them updated as the price action evolves. Let us know if you find these valuable or not.
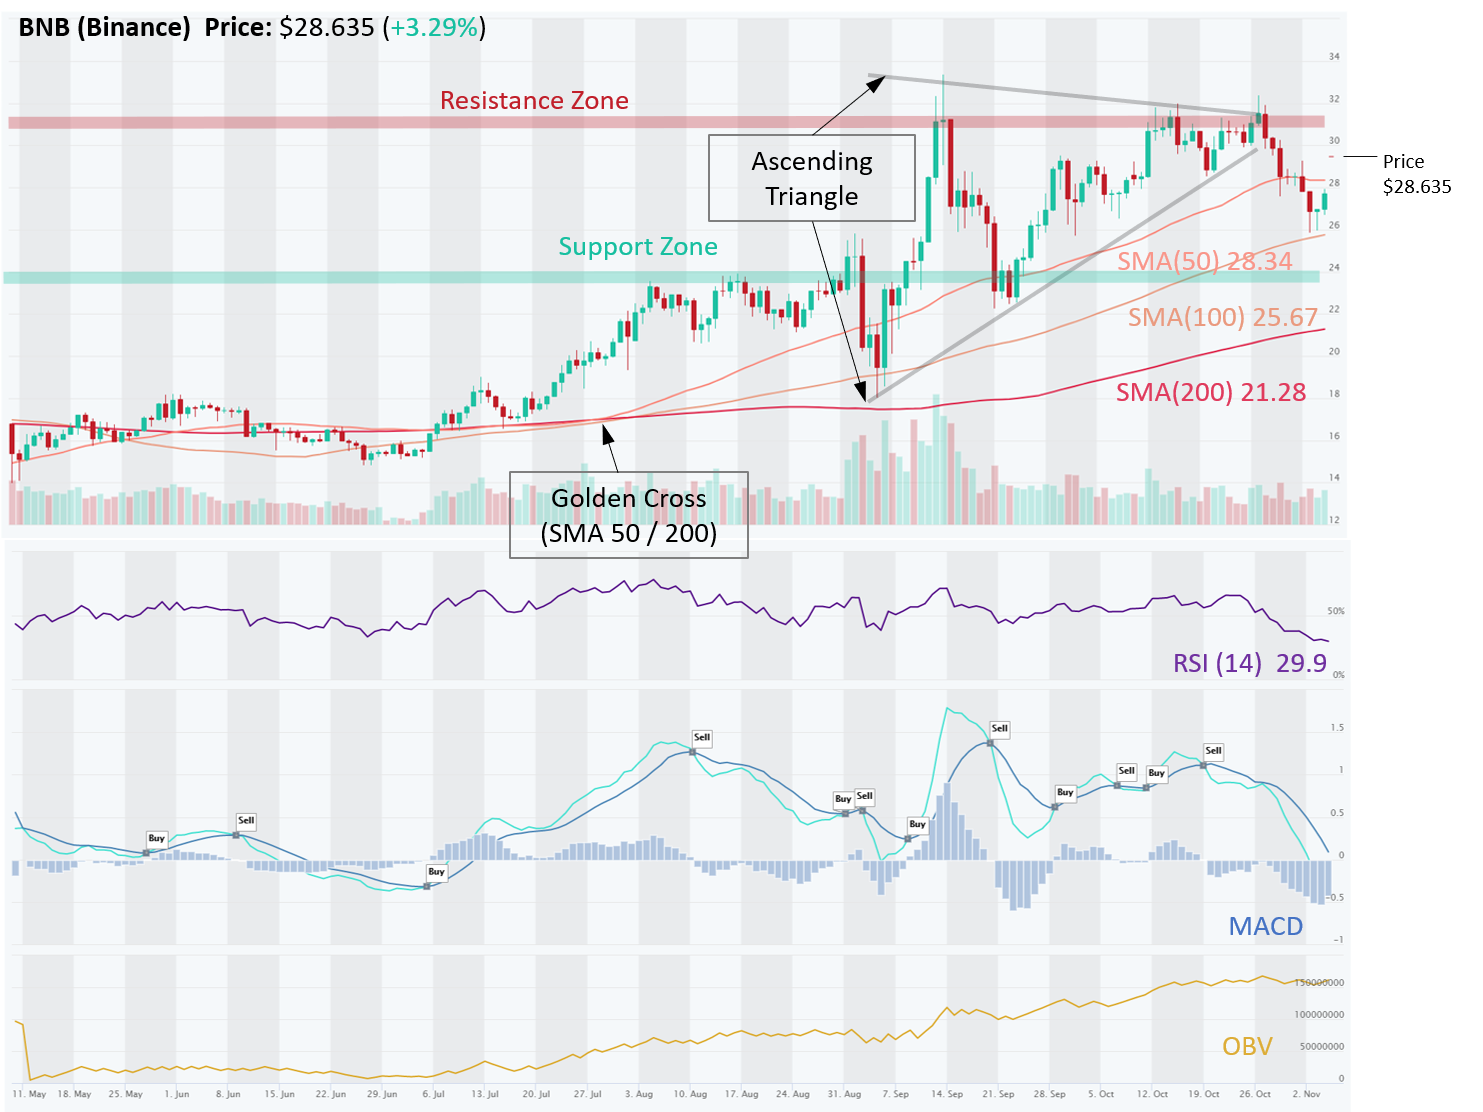
BNB (Binance Coin) is in a Strong Long-Term Uptrend although Short Term Downtrend. After forming an Ascending Triangle, it broke through the lower triangle trendline. Ascending Triangles are typically bullish continuation patterns, meaning they typically resolve in an upward breakout. This one did not. It also formed a Double and later a Triple Top, which are bearish reversal patterns, which coupled with a Sell signal from MACD crossover provided an early warning of a likely reversal.
More recently, it rebounded from its 100 day SMA, which it has respected on multiple occasions in the past. There remains a strong Resistance Zone around $31, which the price needs to break before it can resume its uptrend. It does appear oversold (RSI < 30, CCI < -100) and also interestingly the OBV is rising, indicating that volume on Up days has exceeded volume on Down days. That’s a bullish indication of demand exceeding supply.
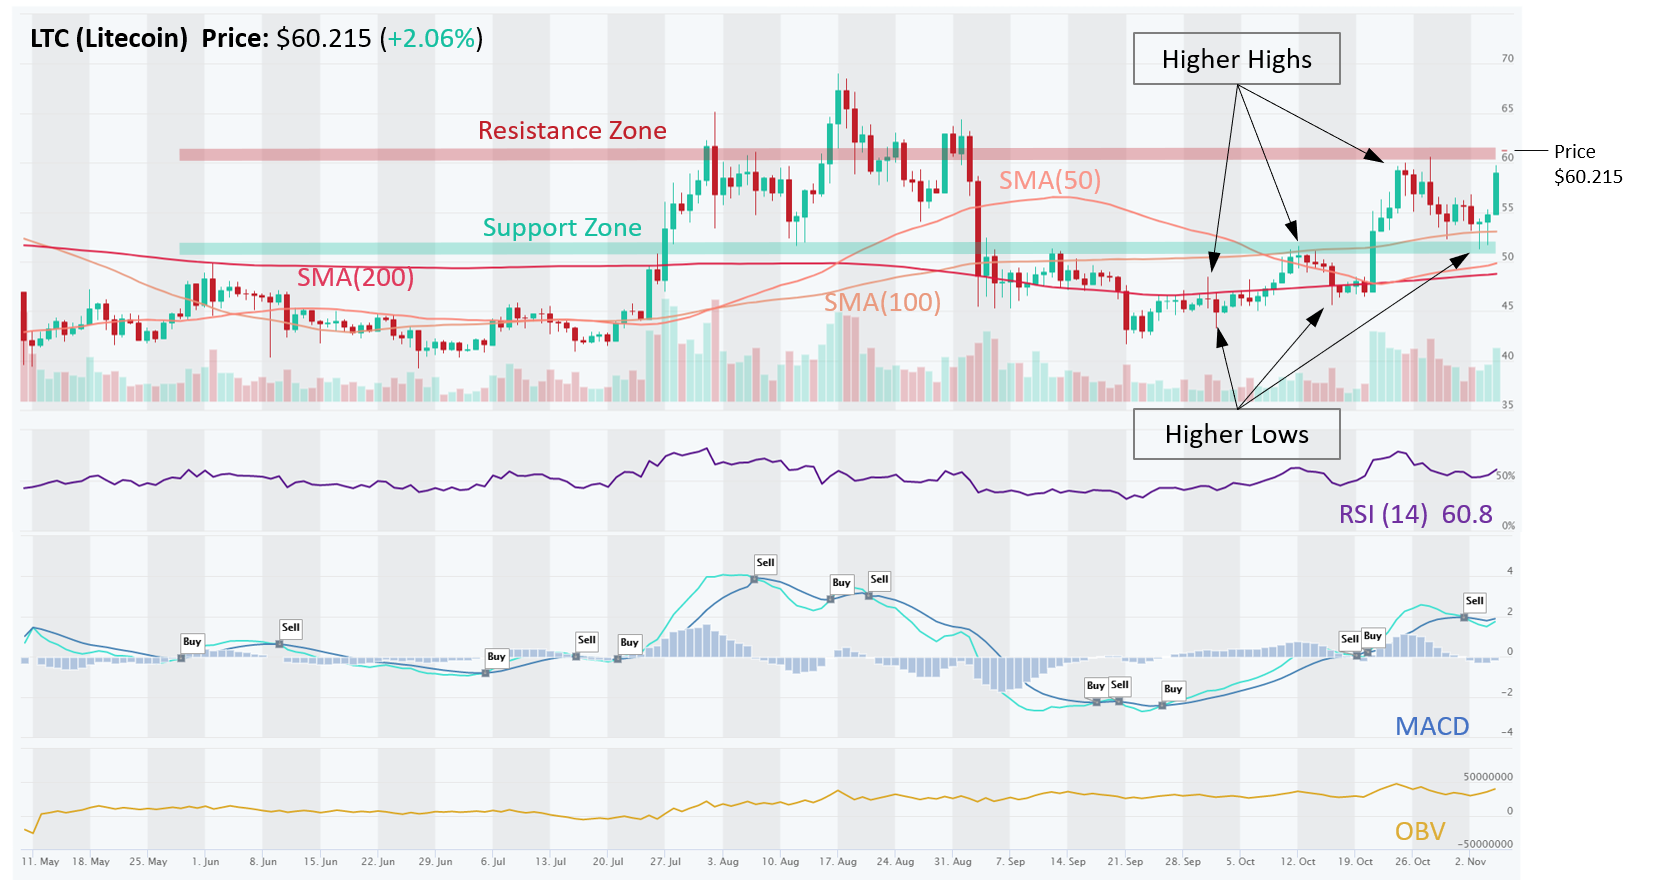
LTC (Litecoin) is in an Uptrend across all three time horizons (Short, Medium, Long). Short term trend is highlighted by Higher Highs and Higher Lows, a text-book definition of an Uptrend. Following a PayPal announcement on Oct 21st (to enable its 350M users to trade four coins including LTC), the price broke through the Resistance Zone (~ $50 – $52), which then turned into a Support Zone, a critical TA concept known as Polarity.
After a short pullback last week, the price is pushing against its Resistance Zone ($60- $62). Also, it appears that MACD is about to crossover into a Buy signal, indicating renewed bullish momentum.
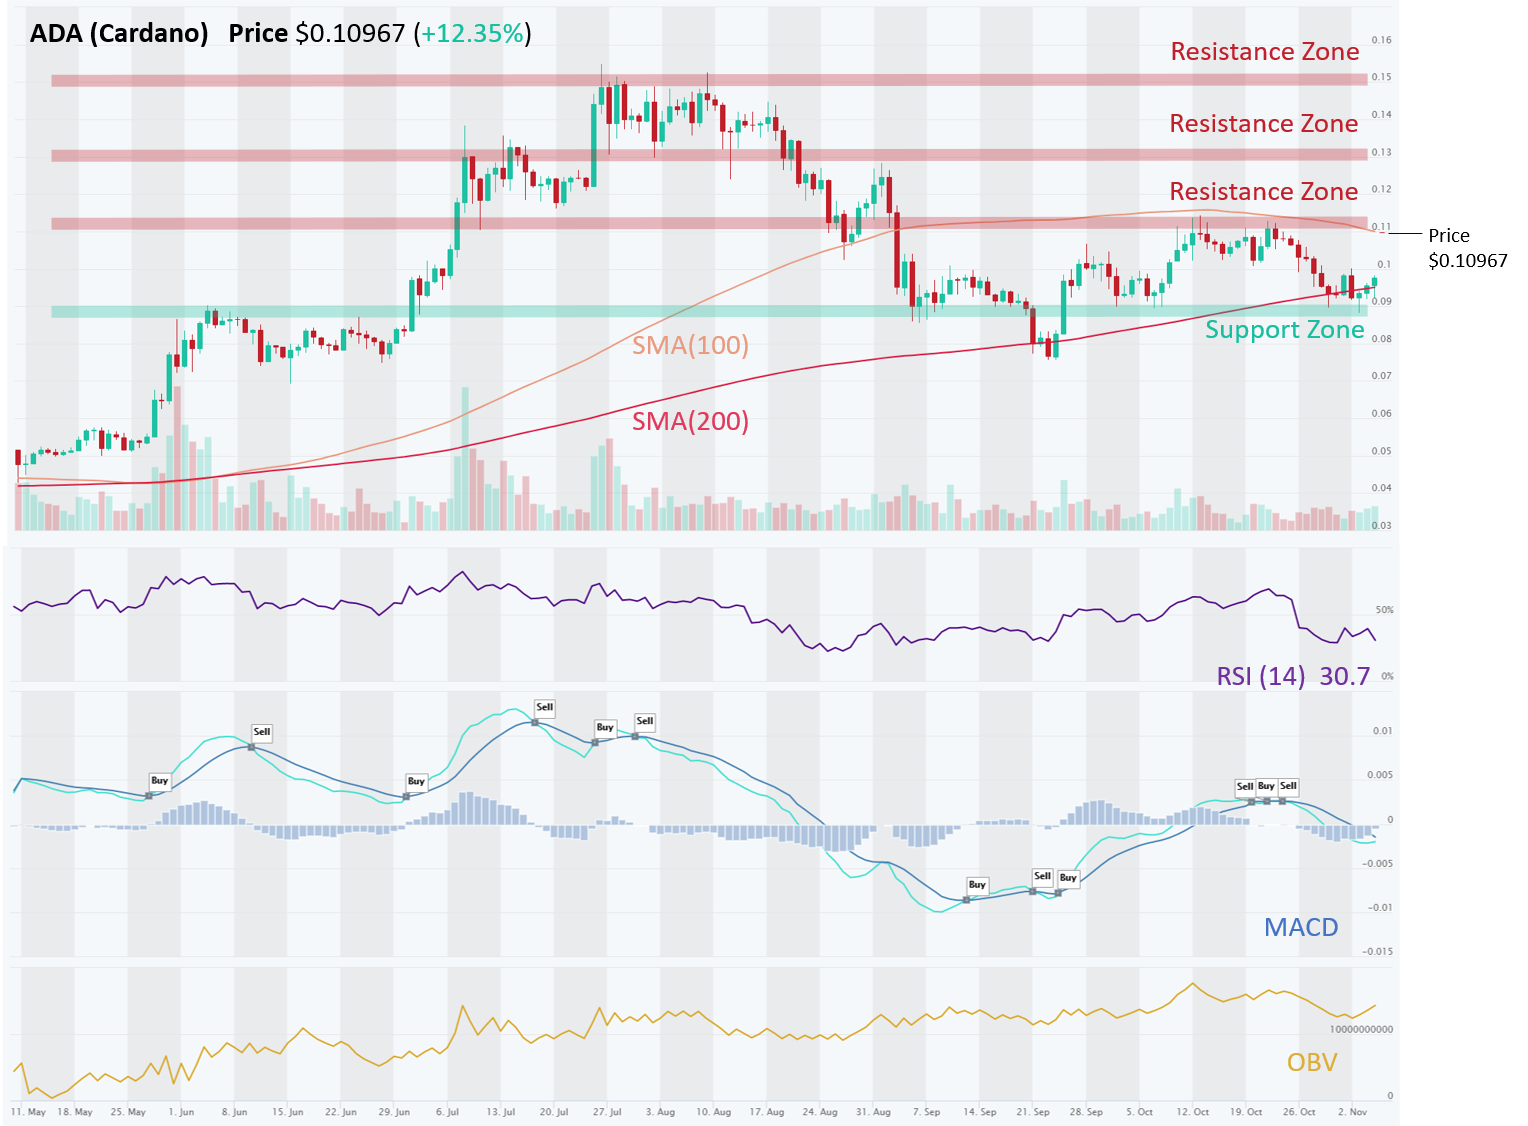
ADA (Cardano) remains in an Uptrend on a Long-Term basis, but Medium and Short-Term trends have been broken, and the coin appears stuck in a sideways channel between a Resistance Zone (~ $0.11) and Support Zone (~$0.09). These also happen to be the levels for 100 day and 200 day SMAs currently, reinforcing the sideways channel pattern.
If it manages to break through $0.11, it could then rise to the next resistance of $0.13 and then $0.15. Momentum is weak (MACD, RSI), although it appears to be turning a corner to more bullish reading soon.
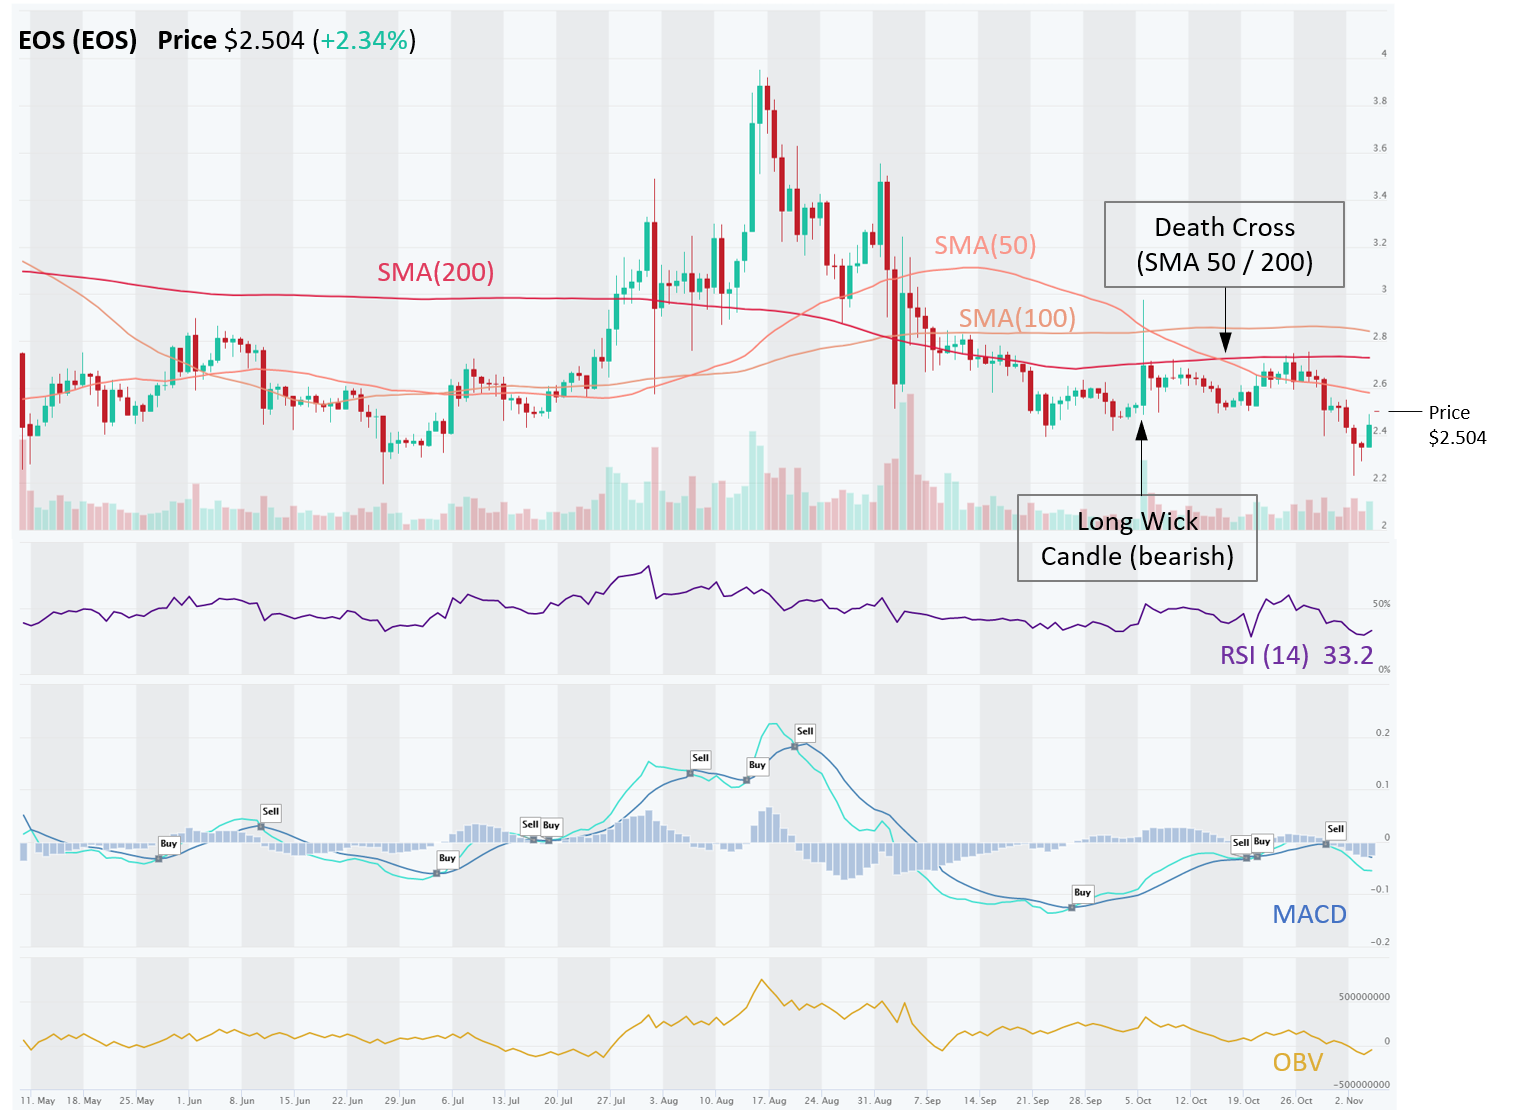
EOS (EOS) is in a clear Downtrend across all three time horizons (Short, Medium, Long-Term). 200 day SMA is acting as a strong Resistance (~ $2.70) where price was rejected twice in October. Notice a long wick candle on Oct 6. Price tends to go in the opposite direction thereafter. A long tail on the top part of a candle suggests that the market made a significant rise then quickly retreated because sellers overwhelmed the buyers. This is a bearish signal.
That was followed by a Death Cross (SMA 50 / 200) on Oct 17 and the price was again rejected at the 200 day SMA, the Resistance zone. It’s been all downhill for EOS thereafter and it’s hard to find any support from here.
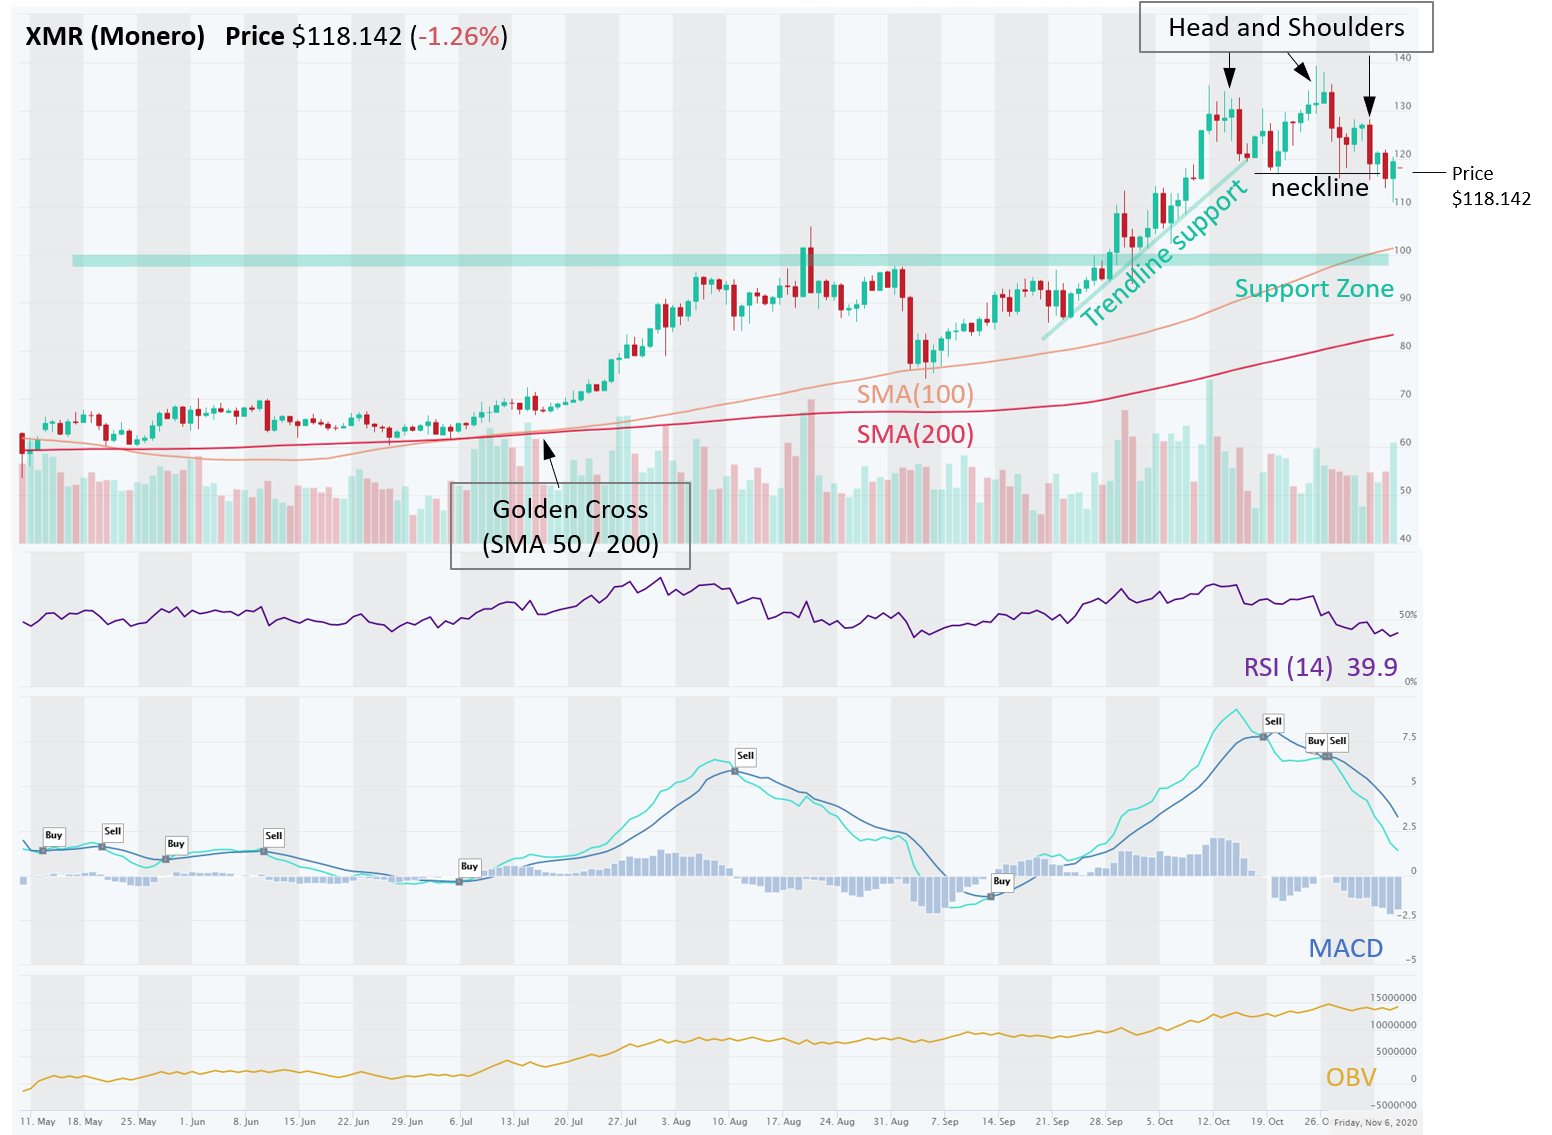
XMR (Monero) is in a solid Uptrend on Medium- and Long-Term basis, but Downtrend on Short-Term basis as the coin is experiencing a correction after a great run in October. A similar consolidation happened after its July run, so be prepared to jump back in. There’s a solid Support Zone around $97-$103, where it could fall to before it heads back to its highs this year of $140.
It also appears to have made a Head and Shoulders pattern, which tends to signal a trend reversal or at least a pause. That again points to a better entry point around the above mentioned Support Zone. Momentum (MACD, RSI) is also bearish currently. On the positive side, note the rising OBV, indicating that Up days have had higher volume than Down days – bulls are still eager to own it on this pullback.
Risk management – Stop Loss and trade size. In all of these setups, traders should use Stop Loss orders to manage their downside risk, in case the trade goes against us, as it often will. Trading is about probabilities and even though these setups have a high win rate, one must be prepared to minimize losses on the trades that go bust. If Stop Loss order types are not supported by they exchange, at least set up a price alert (see video). Also, trade size should be such that you never risk losing more than 2% of your total equity. Keeping the trade size small allows the trader to setup a wider Stop Loss, which gives the trade more room and time to complete with success. Setting Stop Loss levels too tight can often result in getting knocked out of a trade prematurely.
Disclaimer: This content is for informational purposes only, you should not construe any such information or other material as investment, financial, or other advice. There are risks associated with investing in cryptocurrencies. Loss of principal is possible.