Are we there yet? (crypto bottom) - BTC, ETH, BNB, ADA analysis
Reading tea leaves to see where this crypto correction could bottom out…BTC, ETH, BNB, ADA analysis
After an extraordinary end of 2020 and start of 2021, crypto markets have followed BTC’s lead (-21% week) and then some. Total capitalization of DeFi basket of coins is also down about 20%.
We believe we are close to a local bottom, ripe for a bounce as several top 50 coins are nearing major support zones and are oversold on oscillator indicators.
That may not mean we’re ready to march to new highs yet. Market is likely to bounce sideways for a while, consolidating. Swing traders will have their day now, after Trend traders ruled for months.
During a correction phase, it is critical to
1) identify areas of Support and Resistance,
2) watch where the bearish momentum (MACD Histogram) reaches a trough,
3) watch thinning volumes (diminishing selling pressure) and
4) check whether oscillators are reaching extreme oversold levels.
When these indications line up, traders can place some bets on an upcoming bounce with reasonable odds in their favor.
Let’s review the top 4 coins by market cap:
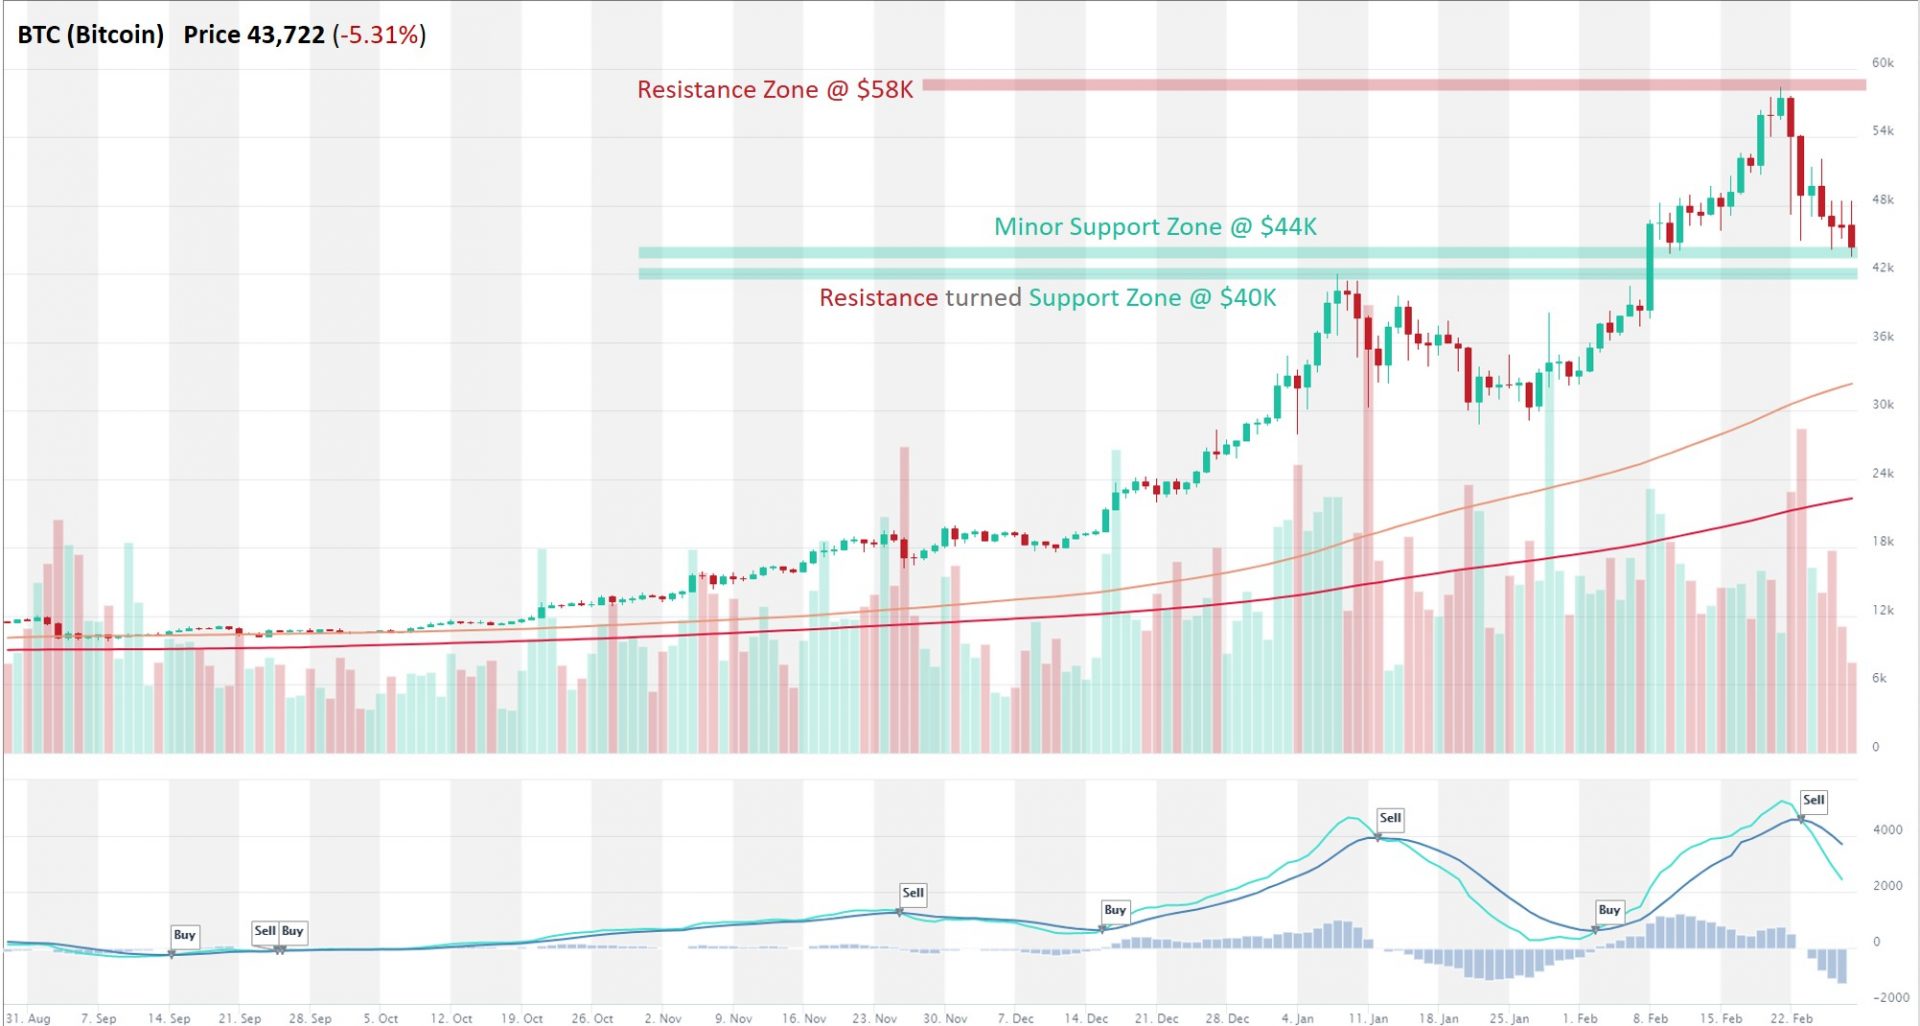
Bitcoin (BTC) – Approaching a Minor Support at $44K and a Robust Support Zone at $40K; BTC Appears Oversold and Ripe for a Bounce.
Despite a 21% correction, BTC is still in an Uptrend across all time horizons (Short-, Medium-, and Long-Term), as determined by our trend scoring system.
Momentum (MACD, RSI) has clearly swung into bearish territory, with MACD Line crossing below MACD Signal Line (Sell) and RSI dipping below 50.
Some oscillator indicators are already showing BTC in oversold territory (STOCH, CCI, Williams), which could suggest it’s ripe for a bounce if not a full reversal as it approaches support zones.
Support zones are at $44K (minor one – didn’t see that much volume here in the past) and $40K (this one is far more robust based on prior touch points in early January 2021).
Next Resistance zone is at ATH of $58K
Source: altFINS.com
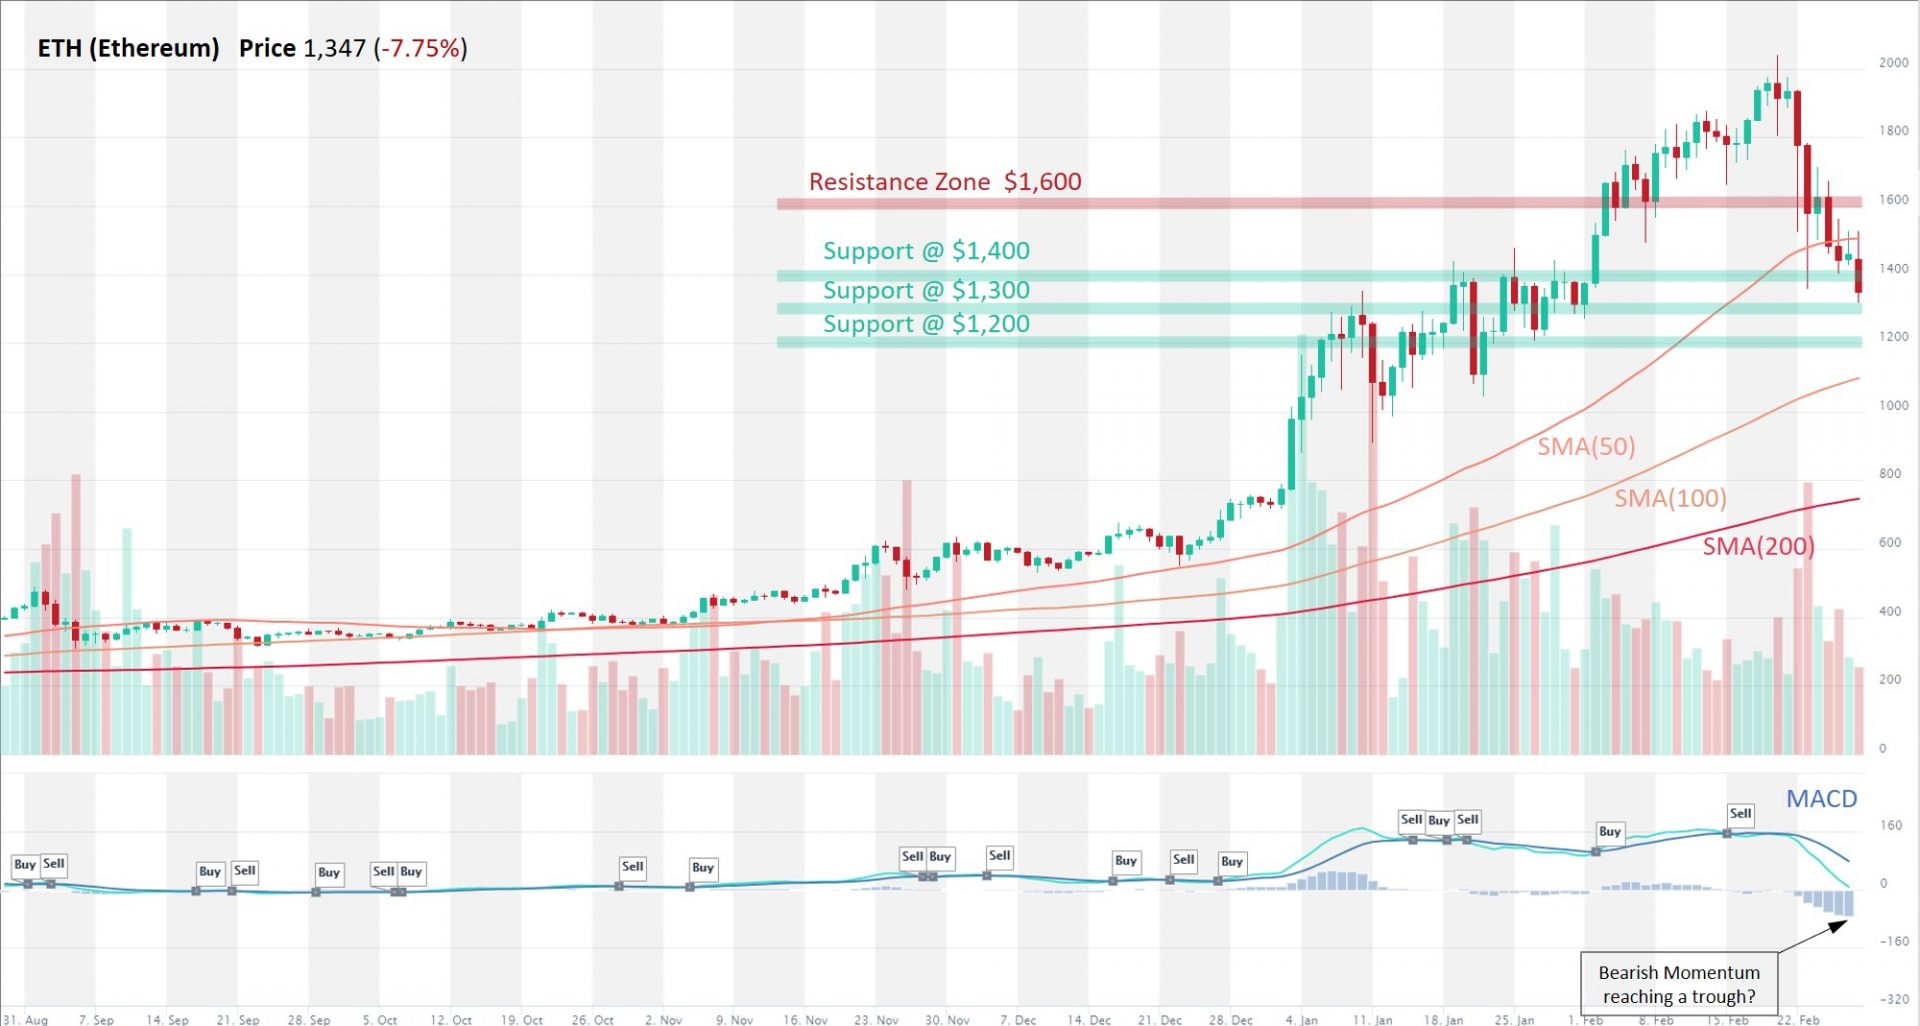
Ethereum (ETH) – Oversold and Near Major Support Zones; Bearish Momentum Reaching a Trough, Setting up a Bounce
ETH is in an Uptrend in a Medium- and Long-Term horizons, but the correction has taken a clear toll on the Short-term trend (Down).
Not surprisingly, Momentum turned bearish (MACD Line below MACD Signal Line and RSI < 50). In fact, RSI has dipped to 30, after a very long time, which suggests Very Oversold levels. Also, looking closely at the MACD Histogram bars, the bearish momentum appears to be reaching a trough.
With several oscillator indicators flashing Oversold (RSI, CCI, Williams, Bollinger Bands) and MACD Histogram approaching a trough, there’s a good chance for a bounce around these levels.
Support zones. ETH broke through the $1,600 and $1,400 support zones, and is now pressing against a couple of formidable Support zones at $1,300 and $1,200, where we could see sellers exhausting and buyers stepping up.
Also, notice that volumes have normalized, suggesting that selling pressures are easing up.
Looking at the Fibonacci retracement levels, the first level (78.6% retracement from ATH of ~ $2,000) was around $1,570 and the second level (61.8%) is about $1,236, which about coincides with the above identified Support Zones of $1,300-,1200.
Source: altFINS.com
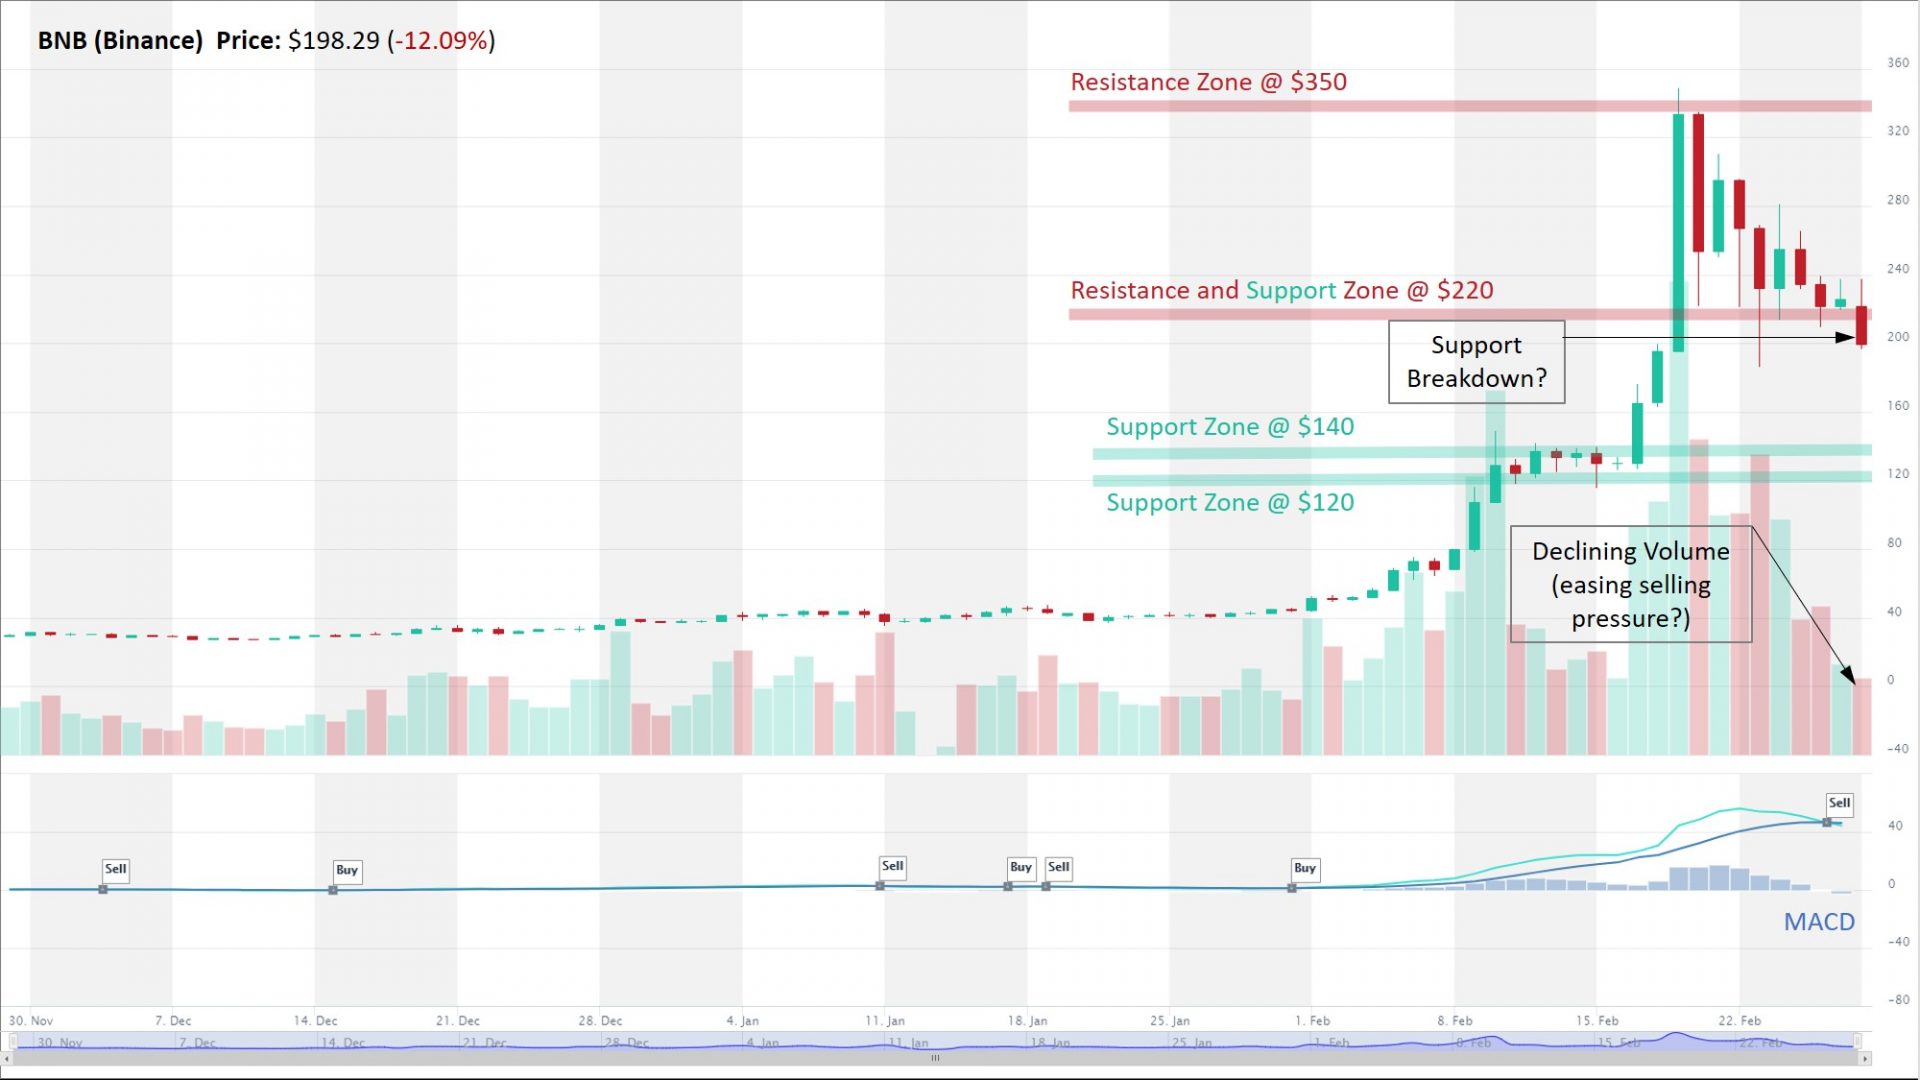
Binance (BNB) – Cautious Near-Term Outlook, Despite a Significant Retracement
Despite a significant retracement from ATH ($350), BNB is still technically in an Uptrend across all three time horizons (Short, Medium, Long). Clearly, it is undergoing a correction. Where will it stabilize?
BNB was one of the biggest gainers in 2021, driven in part by 1) Coinbase IPO filing with $70-100B valuation, and 2) adoption of Binance blockchain layer.
Since the price rose so quickly, it made few noticeable Resistance / Support areas. Prior price action and Fibonacci (61.8%) retracement would suggest that $220 could be a solid support area, however, it appears to have just broken in.
Plus, MACD has just signaled Sell (MACD Line dipped below MACD Signal Line) and RSI is breaching 50 level. Both suggesting more pain is in store and there’s good chance price will retrace all the way to $120-140 levels.
On the positive side, selling pressure could be drying up, as noted in declining trading volumes.
Oscillator indicators are not yet in Oversold territory, including STOCH, RSI, CCI, Williams and Bollinger Band, which again suggests that BNB is more likely to go lower before it stabilizes.
Source: altFINS.com
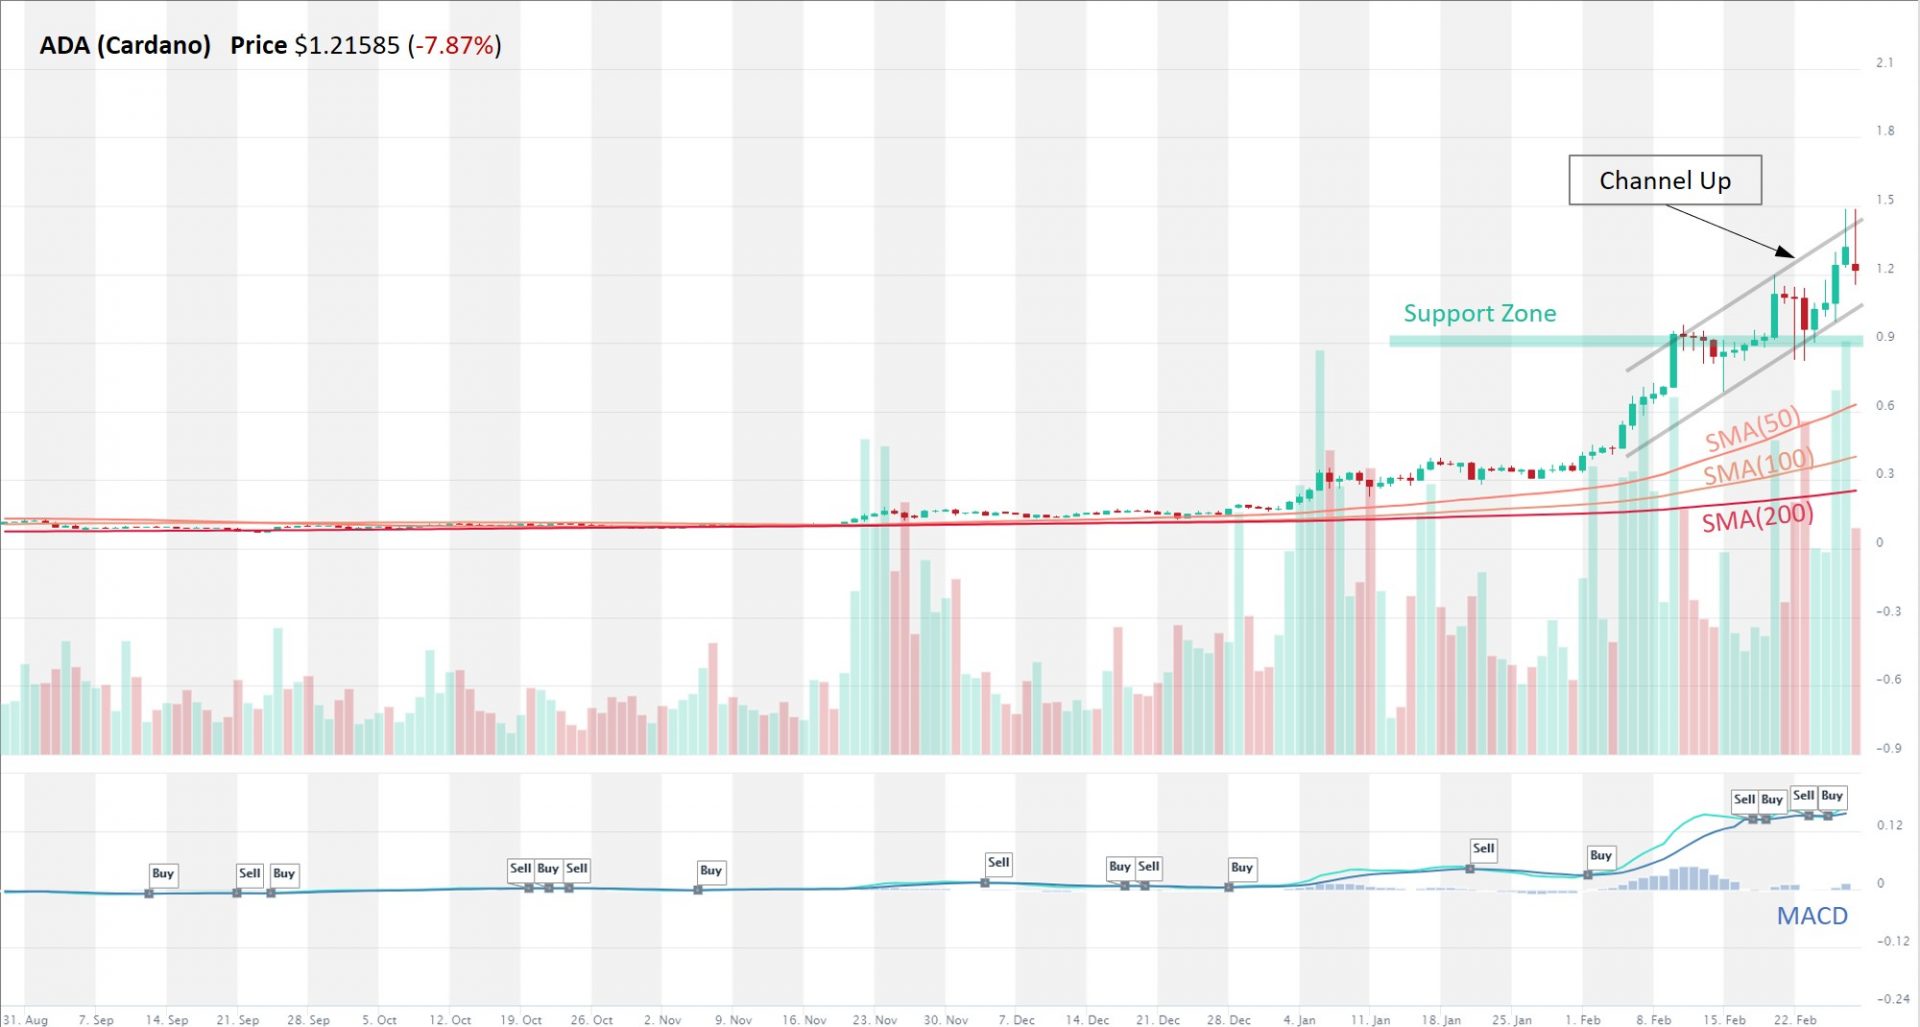
Cardano (ADA) – Strong Uptrend in Channel Up, Bucking The Recent Market Correction
ADA is in an Uptrend across all three time horizons (Short, Medium, Long).
Price is steadily rising in a Channel Up pattern.
Momentum is Bullish currently (MACD Line is above MACD Signal Line) and RSI above 50.
Traders could join this trend on minor pullbacks within the Channel Up, when price approaches the lower trendline.
OBV (On Balance Volume) is rising, indicating that volume on Up days is exceeding volume on Down days, hence bulls are still in control.
 Source: altFINS.com
Check our unique automated chart pattern recognition for fresh trading ideas. Also, during market corrections, it’s always good to revisit coins in an Uptrend but with a pullback. Our Signals Summary has this and other pre-defined filters ready for action.
Subscribe to our newsletter to receive future blog updates in your inbox and make sure you add altfins.com to your email whitelist.
Disclaimer: This content is for informational purposes only, you should not construe any such information or other material as investment, financial, or other advice. There are risks associated with investing in cryptocurrencies. Loss of principal is possible.