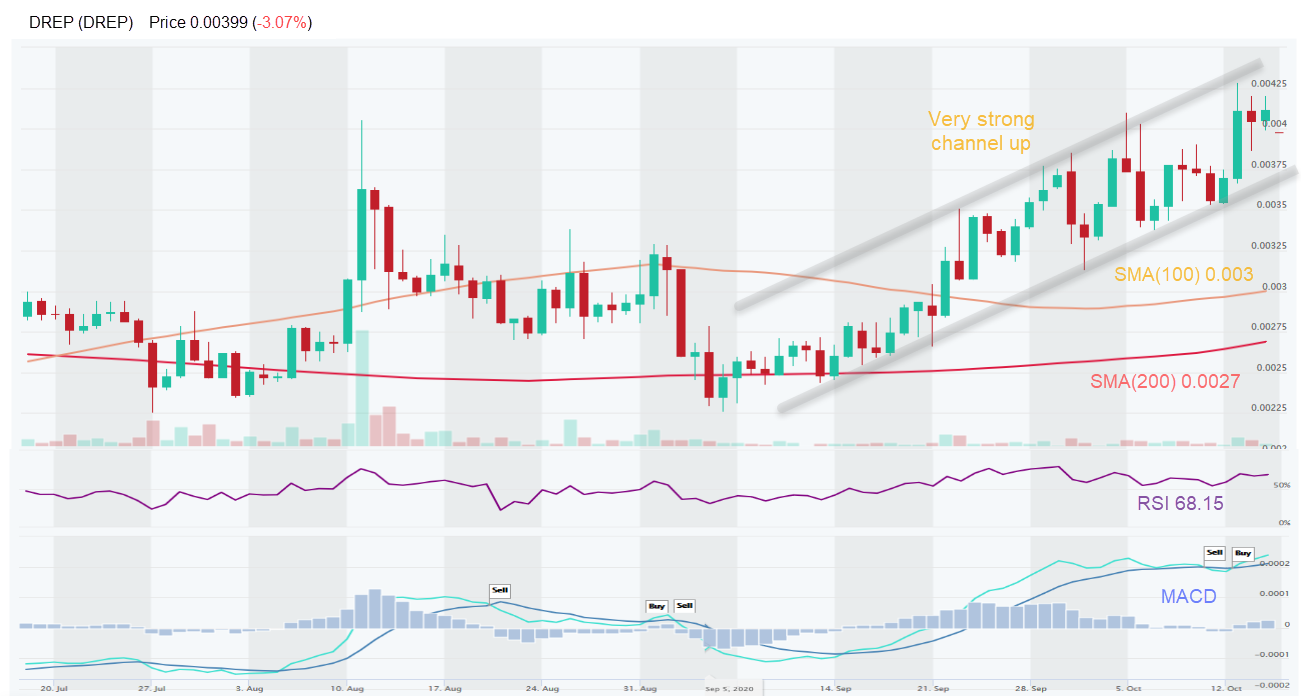
Strategy Screen updates - featuring ETH, TRX, DREP, OXT, MLN
We’re highlighting results for five popular strategy screens, and featuring new picks.
These screens are now accessible in our Signals Summary tab to all users. You can run these screens anytime (watch 3 min video) and create alerts to get notified with coins or pairs that match the screen criteria.
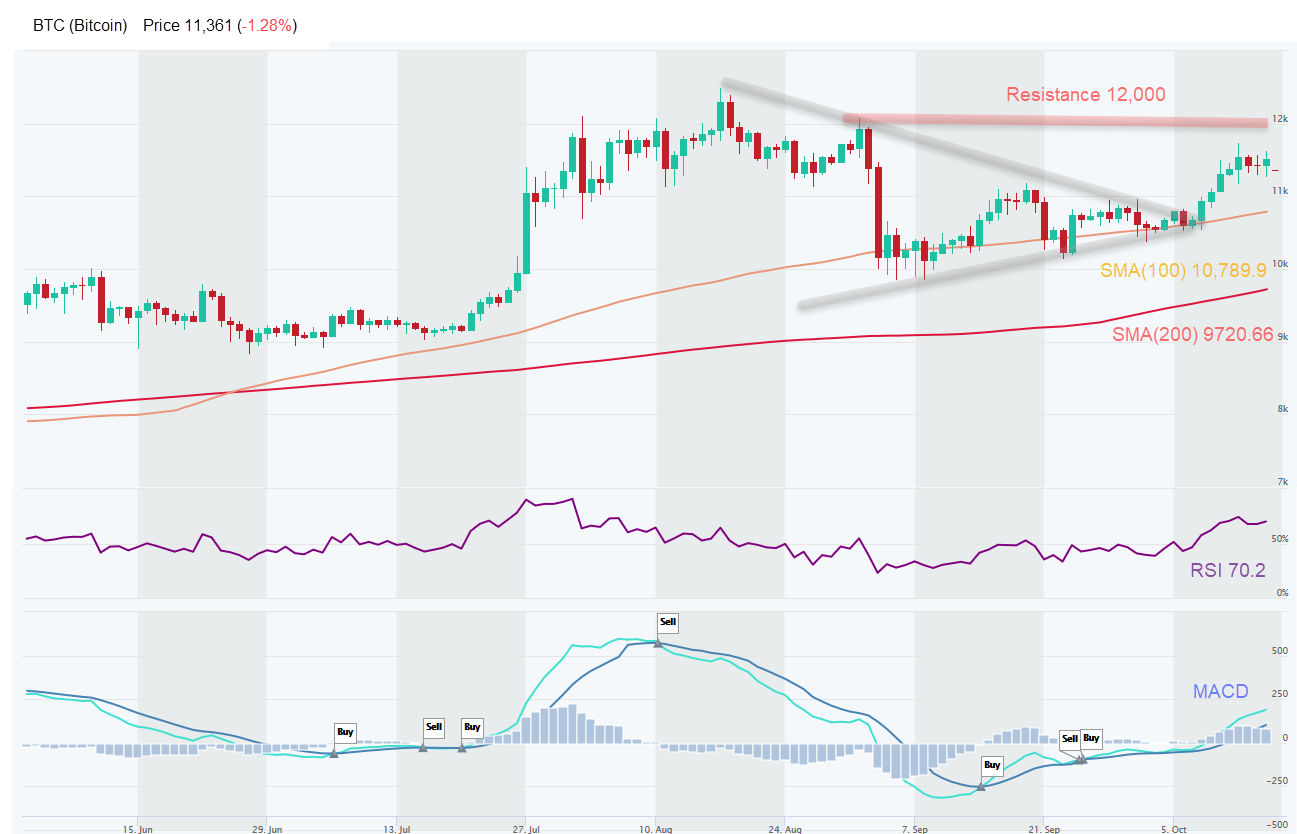
Below we highlight one specific setup for each strategy screen, but let’s start with Bitcoin (BTC), because it sets the tone for the entire market.
Recently it broke upwards from a symmetrical triangle and had very decent gains. Now it’s consolidating. Resistance is around $12,000 and there’s potential to take out this year’s high ($12,500). RSI above 70 signals that it’s a bit overbought and we may continue to consolidate, but remember that RSI can stay overbought/oversold for an extended period.
Now onto the five strategy screens. Here are the highlights:
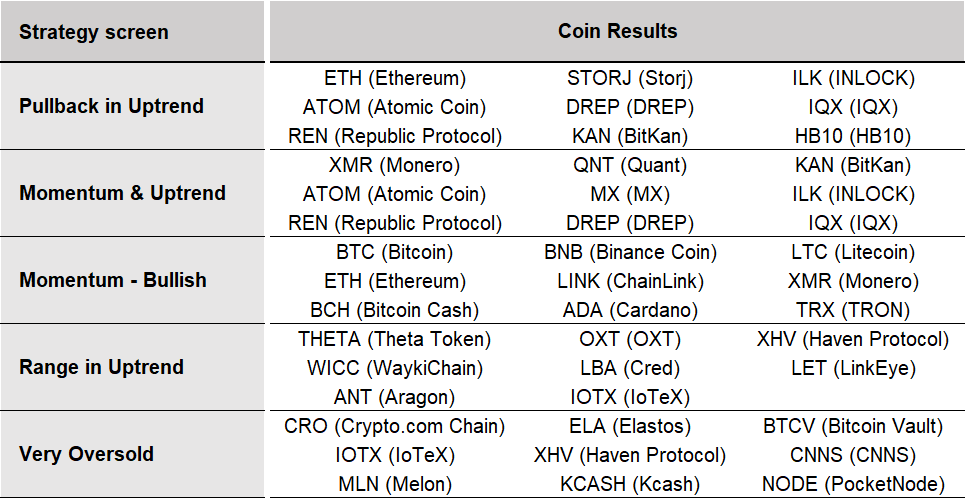
1. Pullback in Uptrend. This is a trend following strategy. Pullbacks can often provide opportunities to jump on an established trend.
ETH (Ethereum) has had decent momentum in an emerging uptrend, and recently it’s pullled back, which may give trend followers an opportunity. Moreover, it’s now at its 100 day SMA, which the price has respected on three recent occasions as Support (see red circles).
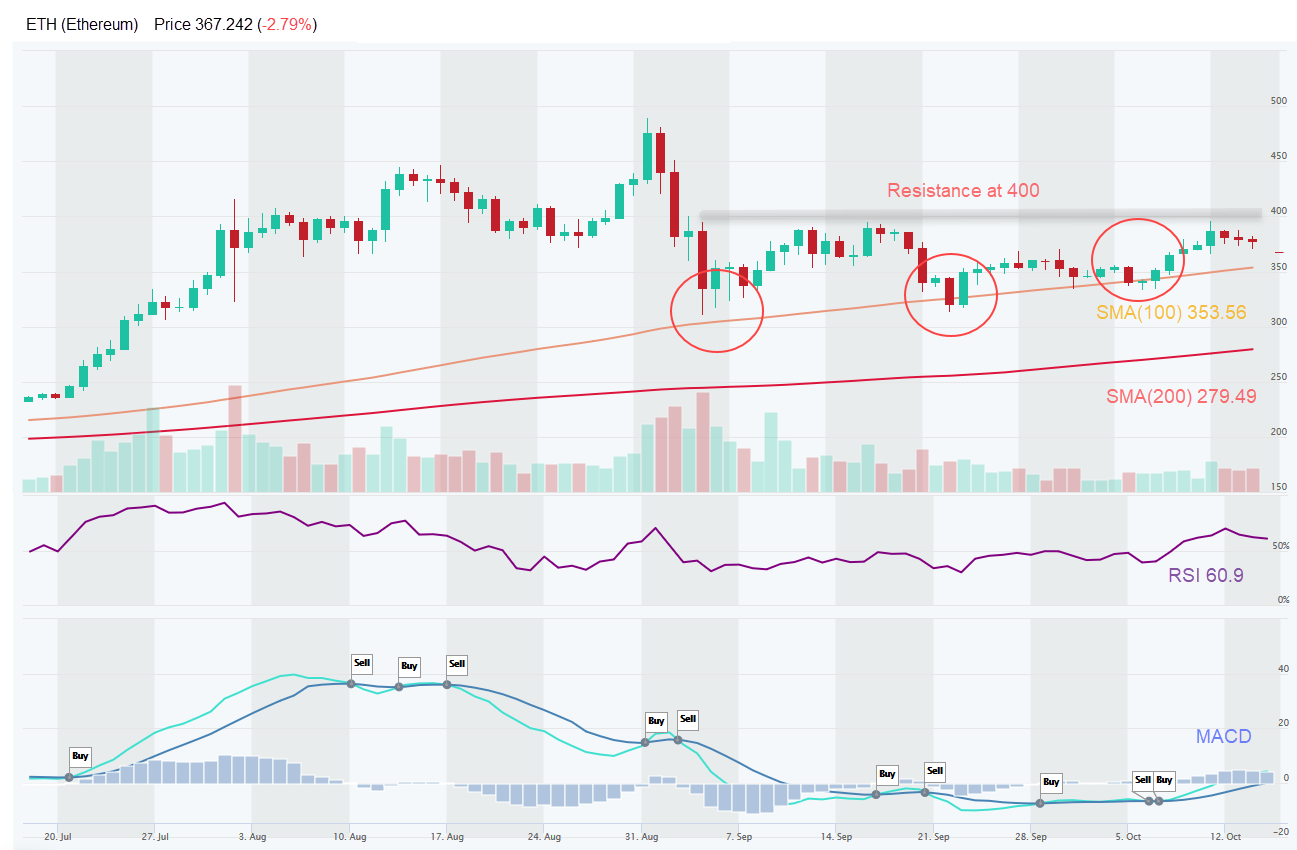
2. Momentum & Uptrend. This screen looks for coins in a long-term uptrend and a recent bullish momentum upswing.
Recently, DREP (DREP) has had a steady series of higher highs and higher lows, a text book uptrend. And momentum again picked up (MACD and RSI crossoves). Today’s pullback could give trend followers an opportunity to join in.
Notice that it’s also trading in an Up Channel, which swing traders could have fun with – buy at the Support Trendline and sell at Resistance Trendline.
Buyers beware, however, that if price breaks through the channel’s support trendline, it could indicate a reversal or at least a change in the slope of the current trend. More on chart patterns here.
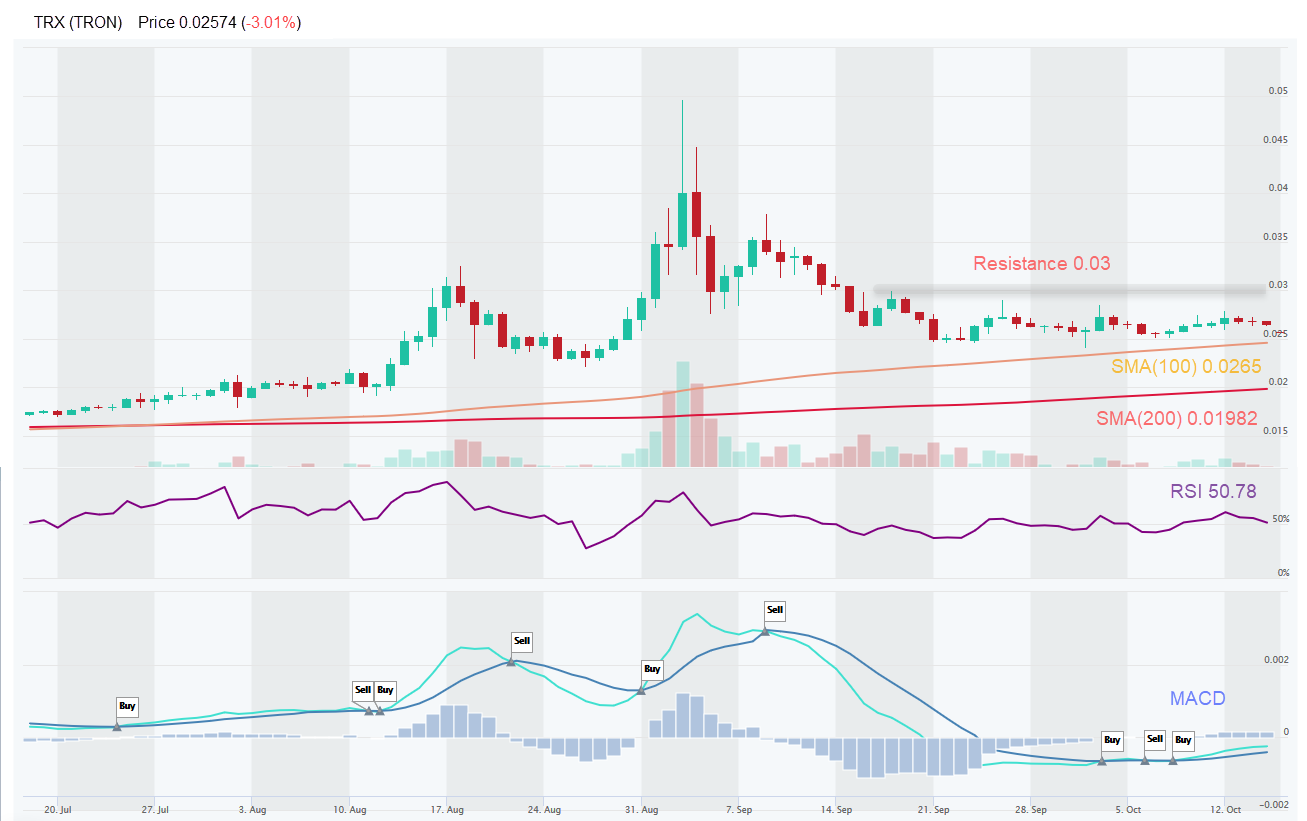
3. Momentum – bullish. This screen looks for coins with bullish momentum, regardless of trend direction.
- Confirmation of a trend. If the momentum signals are bullish and the general uptrend is Up, then this can serve as a confirmation.
- Reversal indication. If the momentum signals are bullish but the general trend has been Down, then this could signal a trend reversal (from Down to Up in this case). Vice versa, if the coin has been in an UpTrend, but momentum signals turn bearish, this could indicate a correction / pullback or a trend reversal.
In this strategy, we highlight the price action of TRX (Tron). It appears to be trading in a $0.025 to $0.030 horizontal channel for a month now, but recently MACD and RSI produced a buy signal. Coincidentally, it’s also sitting at its SMA 100, which could act as decent Support at $0.025 level.
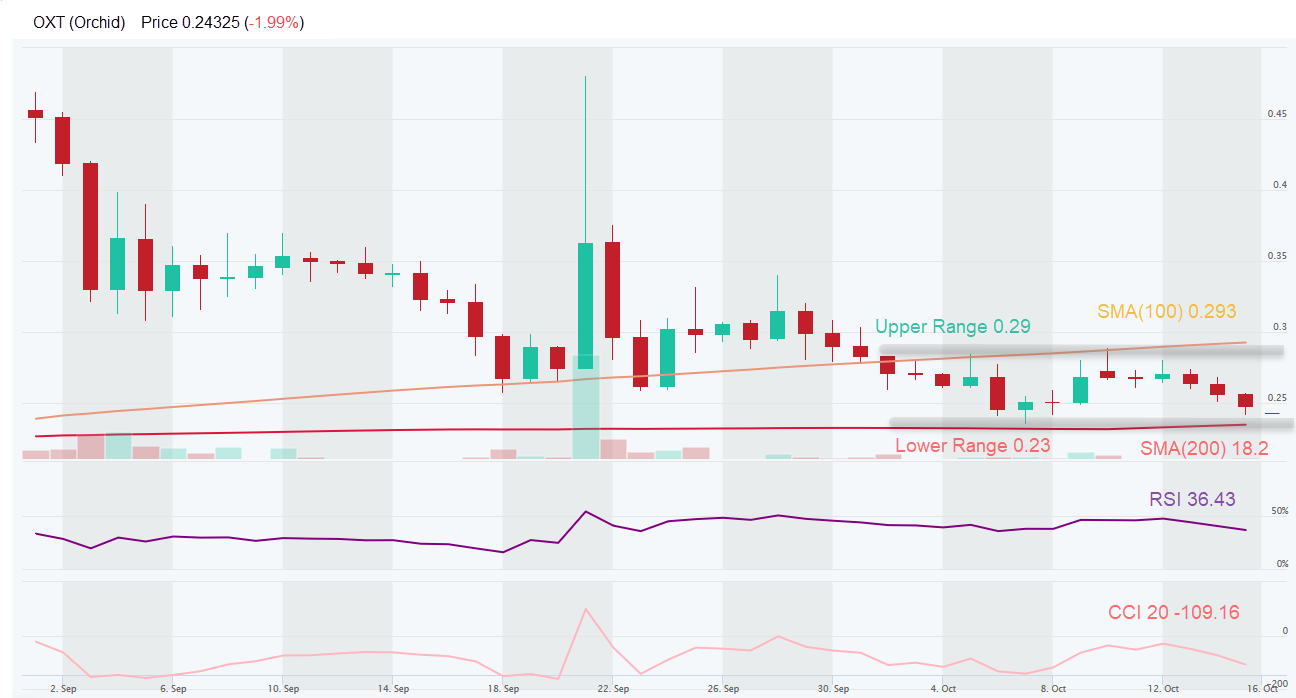
4. Range in Uptrend. Range-bound trading is a trading strategy that seeks to identify and capitalize on coins trading in price channels.
OXT (Orchid) is in a long-term uptrend, but it’s been trading in a range of $0.23 to $0.29 lately. It is now close to its Support and the 200 day SMA, which could be an opportunity for swing traders to go long for another swing higher to the upper channel boundary (resistance zone) around $0.29. It’s also modestly oversold with RSI at 36.4 and CCI at -109, which means it’s due for a bounce.
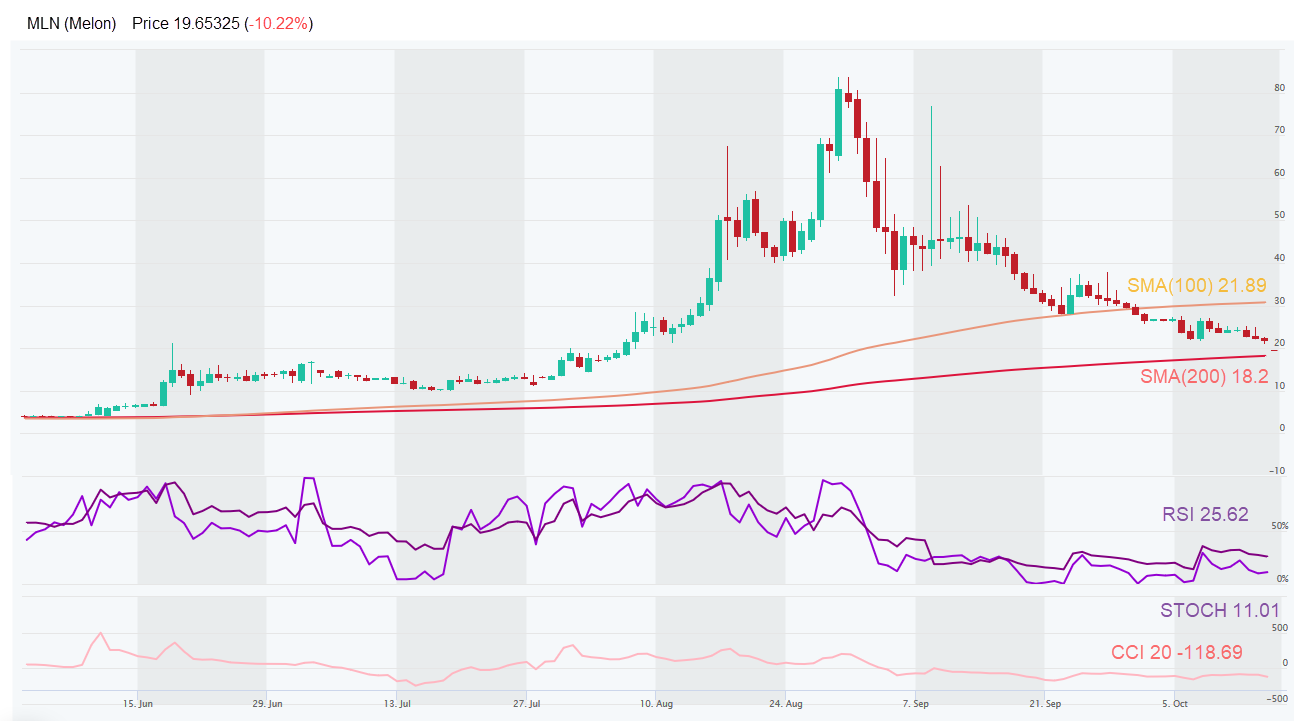
5. Very Oversold. This screen looks for extremely oversold situations that could be ripe for a bounce as sellers get exhausted and value hunters step in. This type of situation ain’t for the faint of heart and is clearly intended for swing traders looking for a reversal. But it could turn into one of those “catching a falling knife” situations.
MLN (Melon)has been getting pounded beyond recognition lately, but it’s way ovesold (RSI < 30, STOCK < 30, CCI < -100) and just reached it’s 200 day SMA, which could act as a support for a near-term bounce.
Risk management – Stop Loss and trade size. In all of these setups, traders should use Stop Loss orders to manage their downside risk, in case the trade goes against us, as it often will. Trading is about probabilities and even though these setups have a high win rate, one must be prepared to minimize losses on the trades that go bust. If Stop Loss order types are not supported by they exchange, at least set up a price alert (see video). Also, trade size should be such that you never risk losing more than 2% of your total equity. Keeping the trade size small allows the trader to setup a wider Stop Loss, which gives the trade more room and time to complete with success. Setting Stop Loss levels too tight can often result in getting knocked out of a trade prematurely.
Disclaimer: This content is for informational purposes only, you should not construe any such information or other material as investment, financial, or other advice. There are risks associated with investing in cryptocurrencies. Loss of principal is possible.