Strategy Screen updates (BTC, OCEAN, MANA, IOTX, XRP)
We’re highlighting results for five strategy screens, and featuring new picks.
These screens are accessible in our Signals Summary tab to all users. You can run these screens anytime (watch 3 min video) and create alerts to get notified with coins or pairs that match the screen criteria.
Honestly, it’s been slim pickings lately when looking for bullish setups (but there’s plenty of Shorts candidates). While Bitcoin (BTC) has been pushing to new highs, altcoins remain in a bearish sentiment ever since the DeFi hype fizzled in late August / early September. We see that on Signals Summary page, where the ratio of coins in uptrend vs. downtrend is 1:5.
Lot of coins have even broken their 200 day SMA levels (see here), entering a space without any support levels.
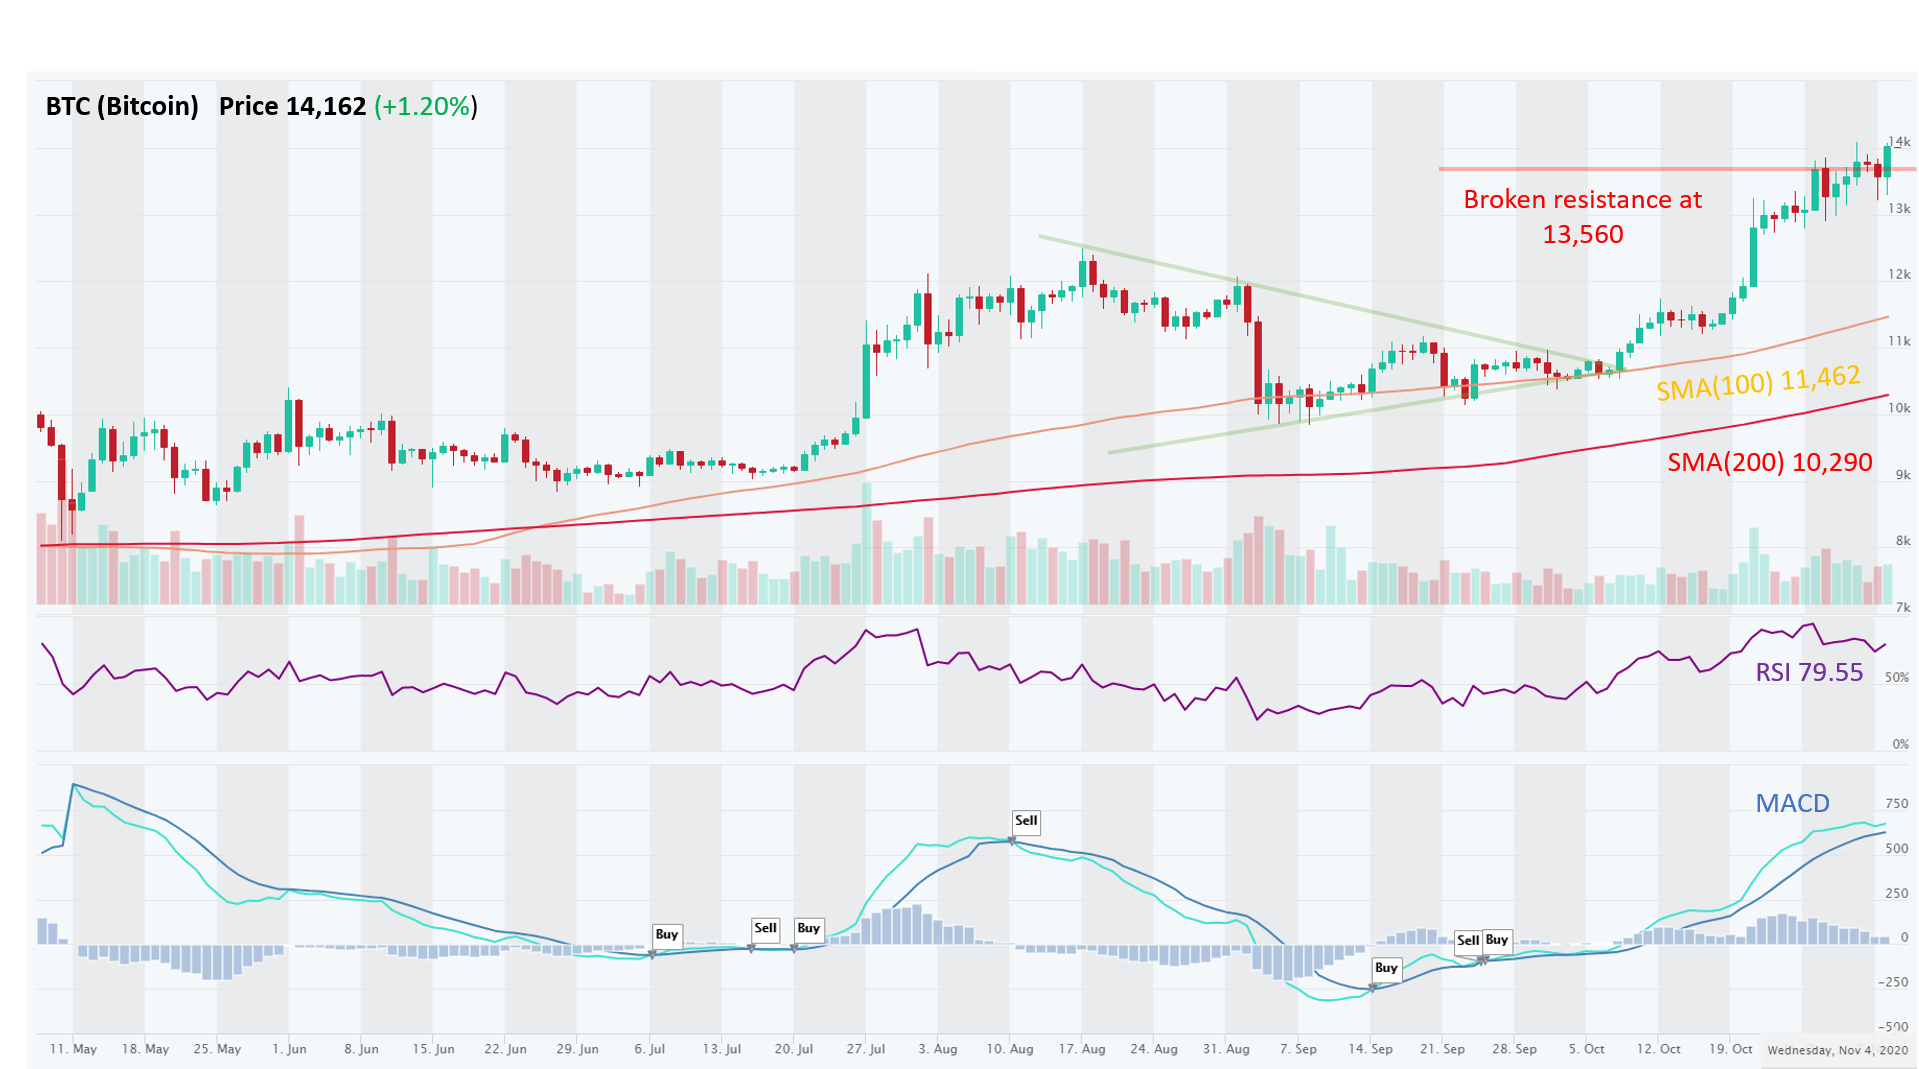
Below we highlight one specific setup for each strategy screen, but let’s start with Bitcoin (BTC), because it sets the tone for the entire market.
Bitcoin posted slight gains this week, but these gains were important for two reasons. First is that last week BTC blasted through 12K and 13K and was able to hold this advance. Second reason is that 61.8% retracement from 2017 high & June 2019 top seems to be broken. This means that path to $16,300 is clear!
Now onto the five strategy screens. Here are the highlights:
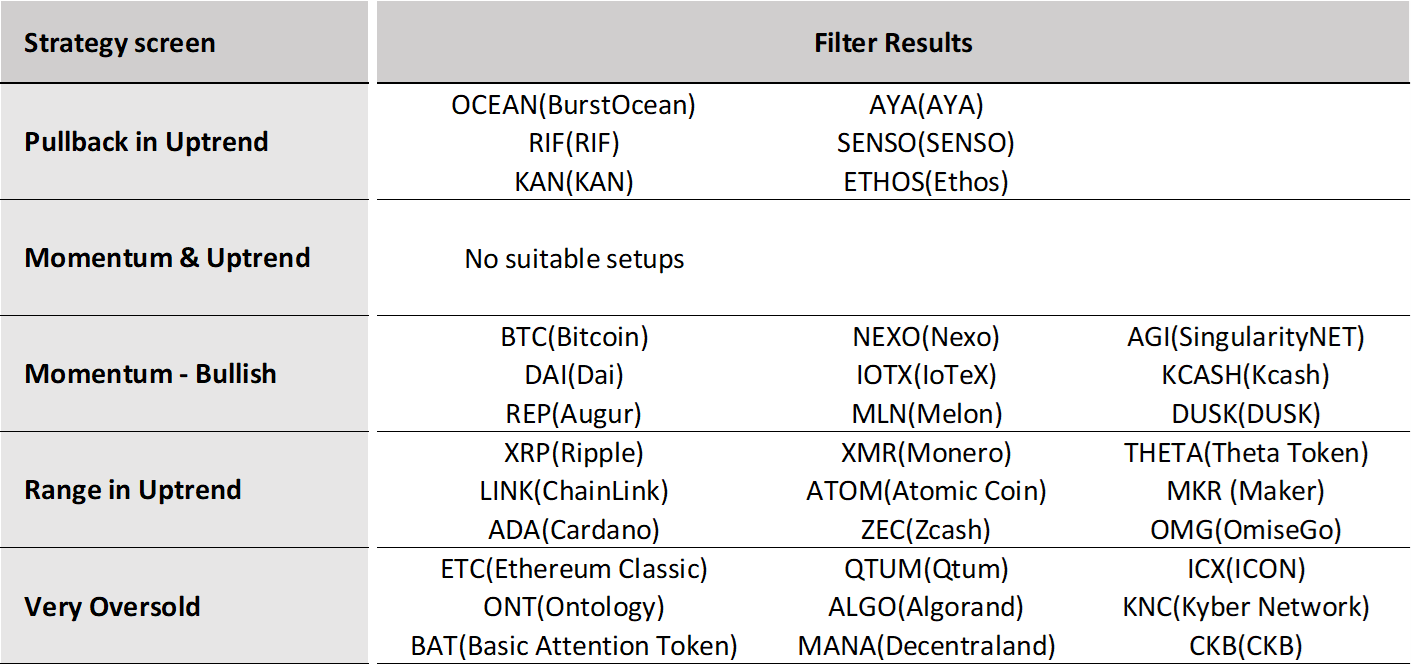
1. Pullback in Uptrend. This is a trend following strategy. Pullbacks can often provide opportunities to jump on an established trend.
This week we’re highlighting price action of OCEAN. It is trading at a very interesting point, at SMA(100), which acts as support, at trendline support and also at resistance, which turned to support. Remember the more indicators point toward something, the greater the probability of it being true. Coin is still in long-term uptrend and recent sell-off may be a good opportunity to jump in on established trend.
2. Momentum & Uptrend. This screen looks for coins in a long-term uptrend and a recent bullish momentum upswing.
This week no coin was found in this filter, because recently many coins lost momentum. Only BTC was able to hold its ground somewhat.
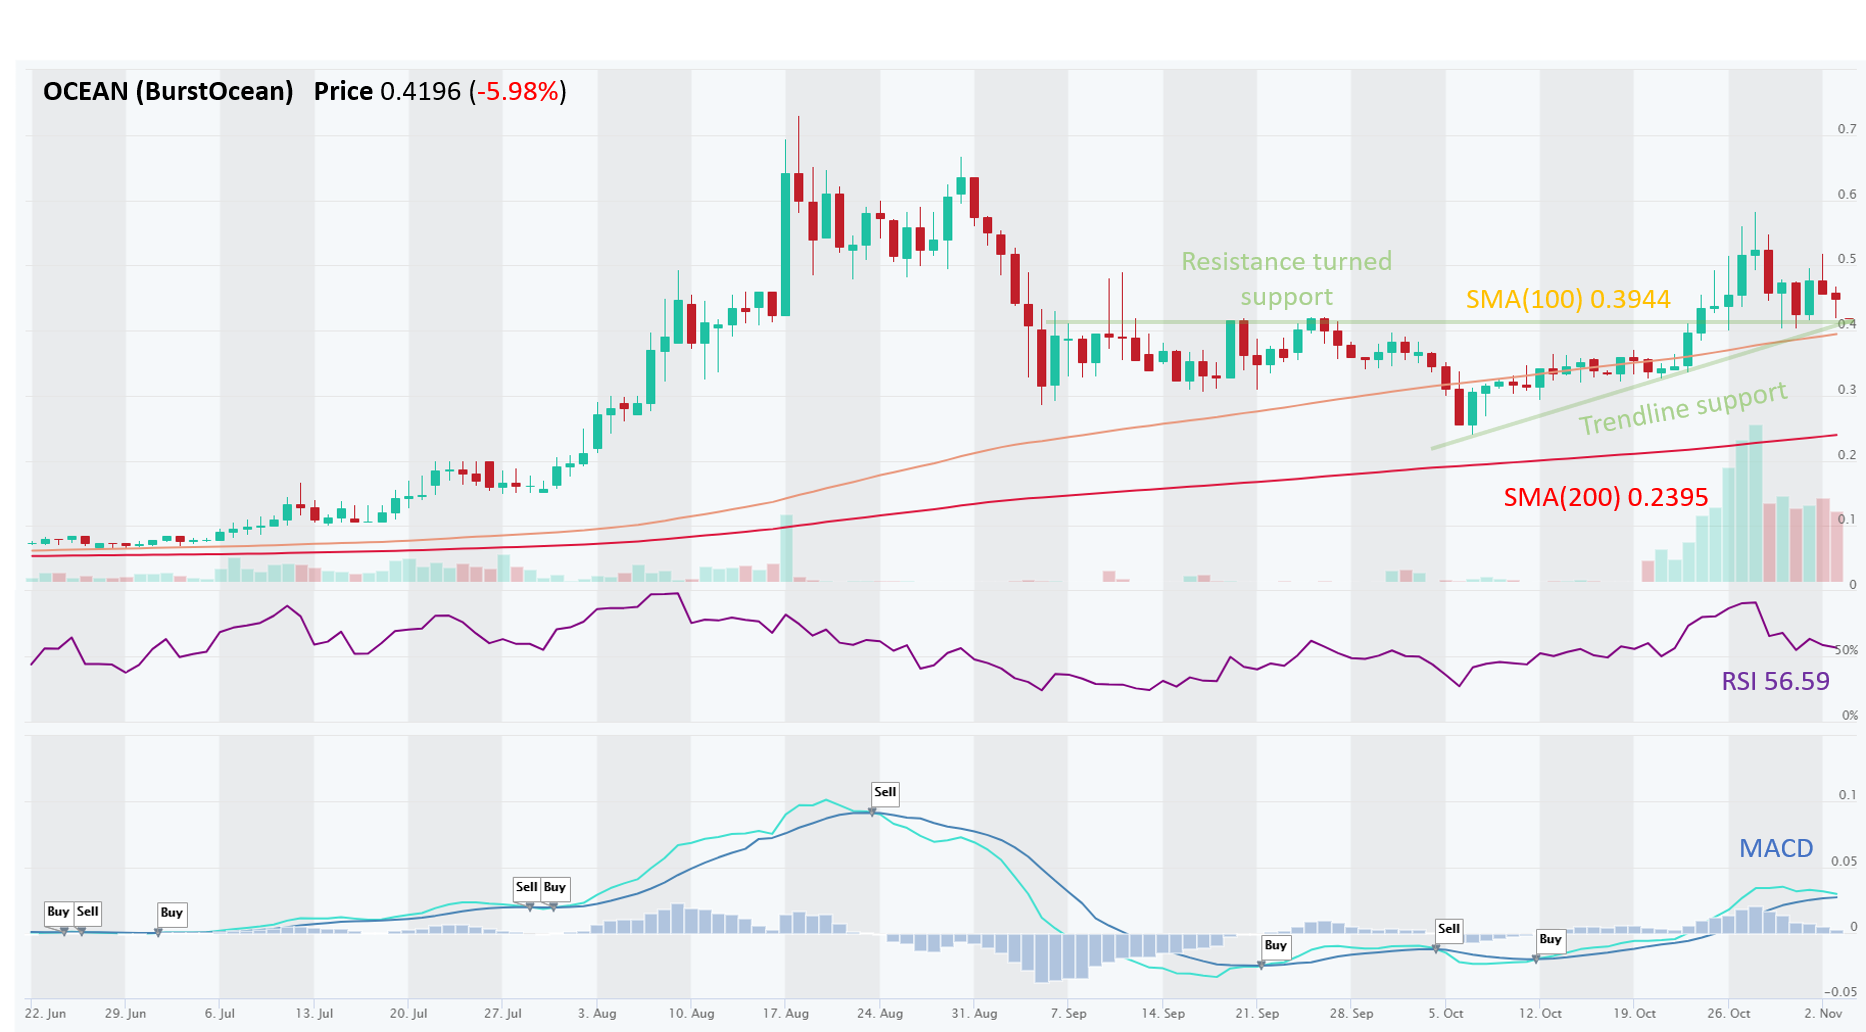
3. Momentum – bullish. This screen looks for coins with recent bullish momentum, regardless of trend direction.
- Confirmation of a trend. If the momentum signals are bullish and the general uptrend is Up, then this can serve as a confirmation.
- Reversal indication. If the momentum signals are bullish but the general trend has been Down, then this could signal a trend reversal (from Down to Up in this case). Vice versa, if the coin has been in an UpTrend, but momentum signals turn bearish, this could indicate a correction / pullback or a trend reversal.
IOTX is an interesting example this week. It posted MACD buy signal in late October, RSI is gaining traction and it is trading on trendline support. SMA(100) is hoovering above the price, but the coin has not respected SMA(100) in the past, therefore one may not give huge importance to SMA(100) being a strong resistance.
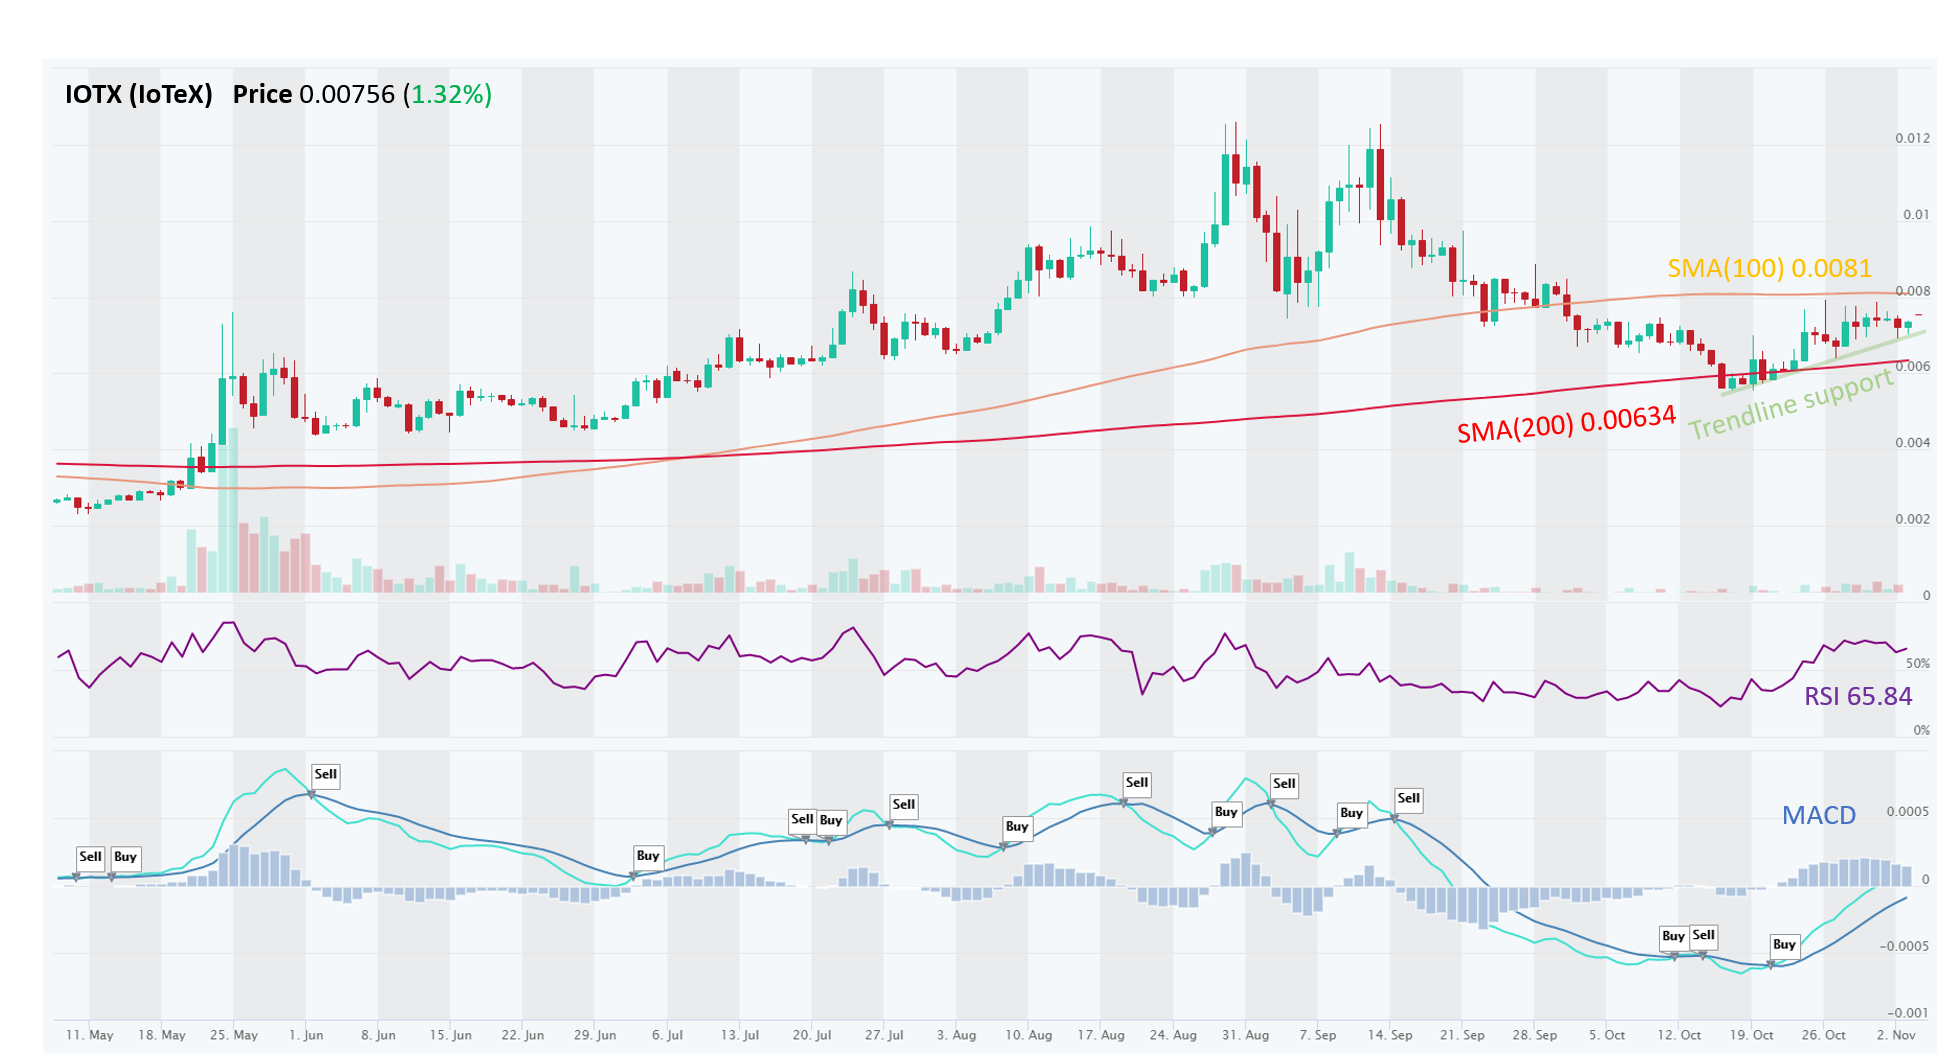
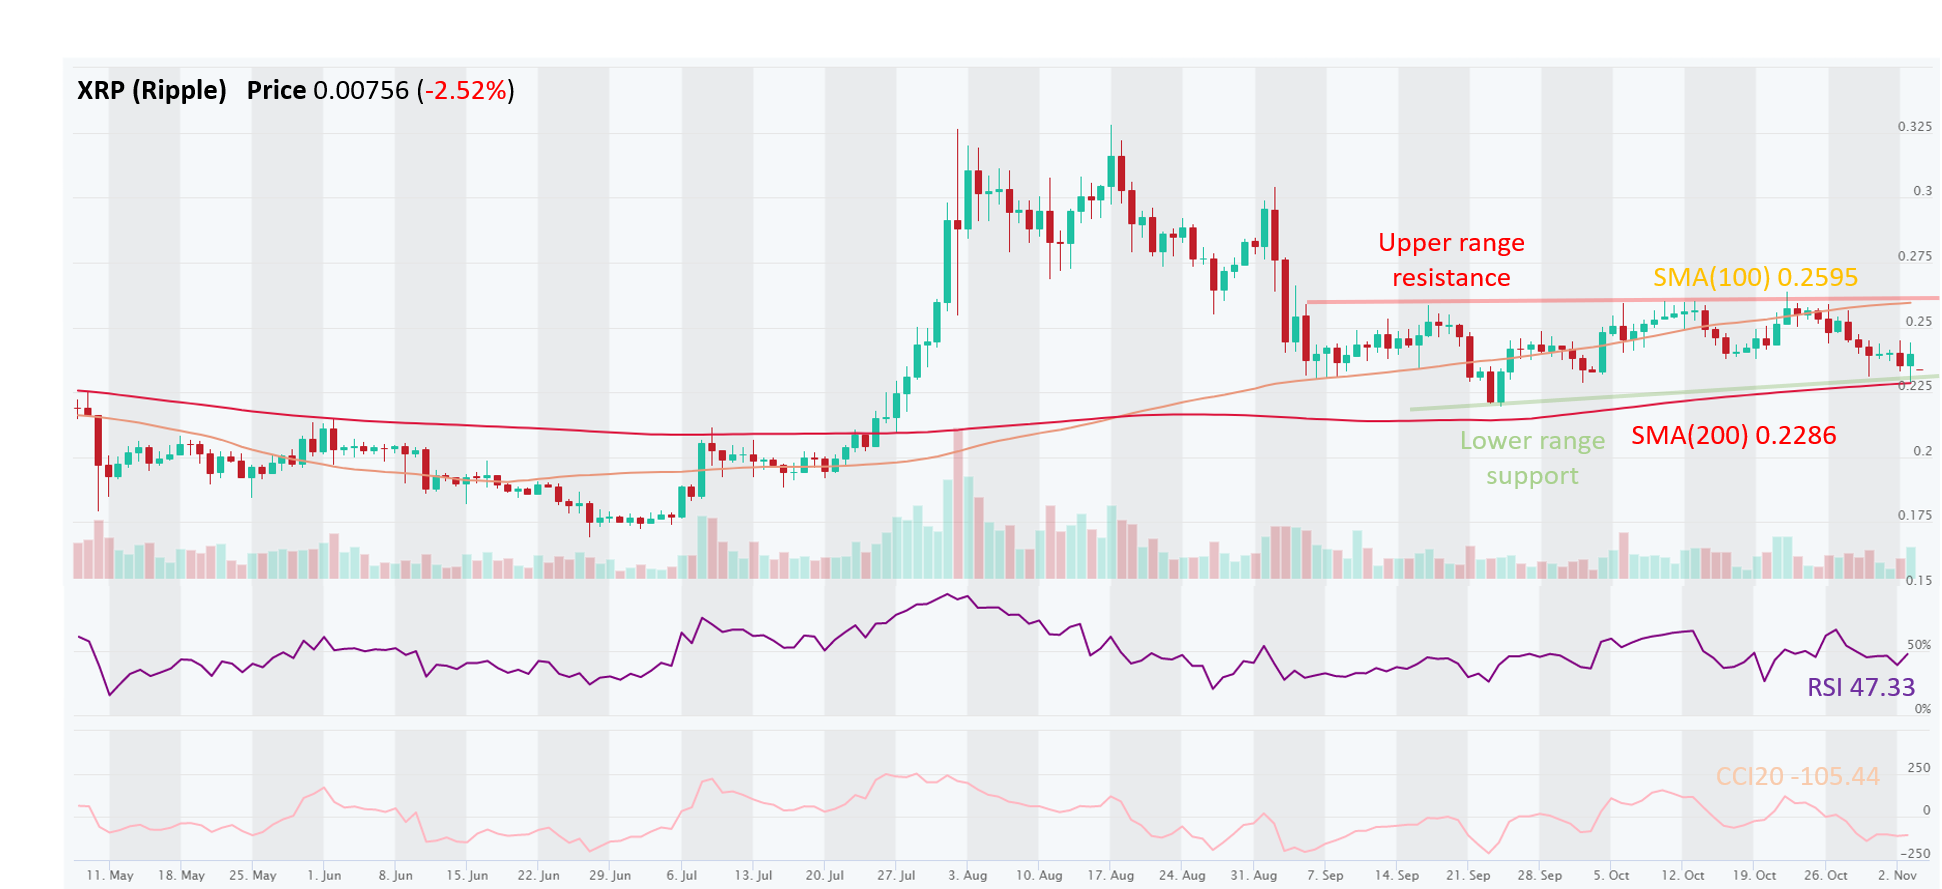
4. Range in Uptrend. Range-bound trading is a trading strategy that seeks to identify and capitalize on coins trading in price channels.
This week we’re highlighting XRP in this strategy, because since August it is trading within 0.22-0.26 range. Lower range consists of SMA(200) and trendline acting as support and upper range resistance is made of trendline resistance. Price is slowly reaching lower range support and with RSI is gaining traction, it could indicate a bounce and grind towards upper range resistance @ 0.26
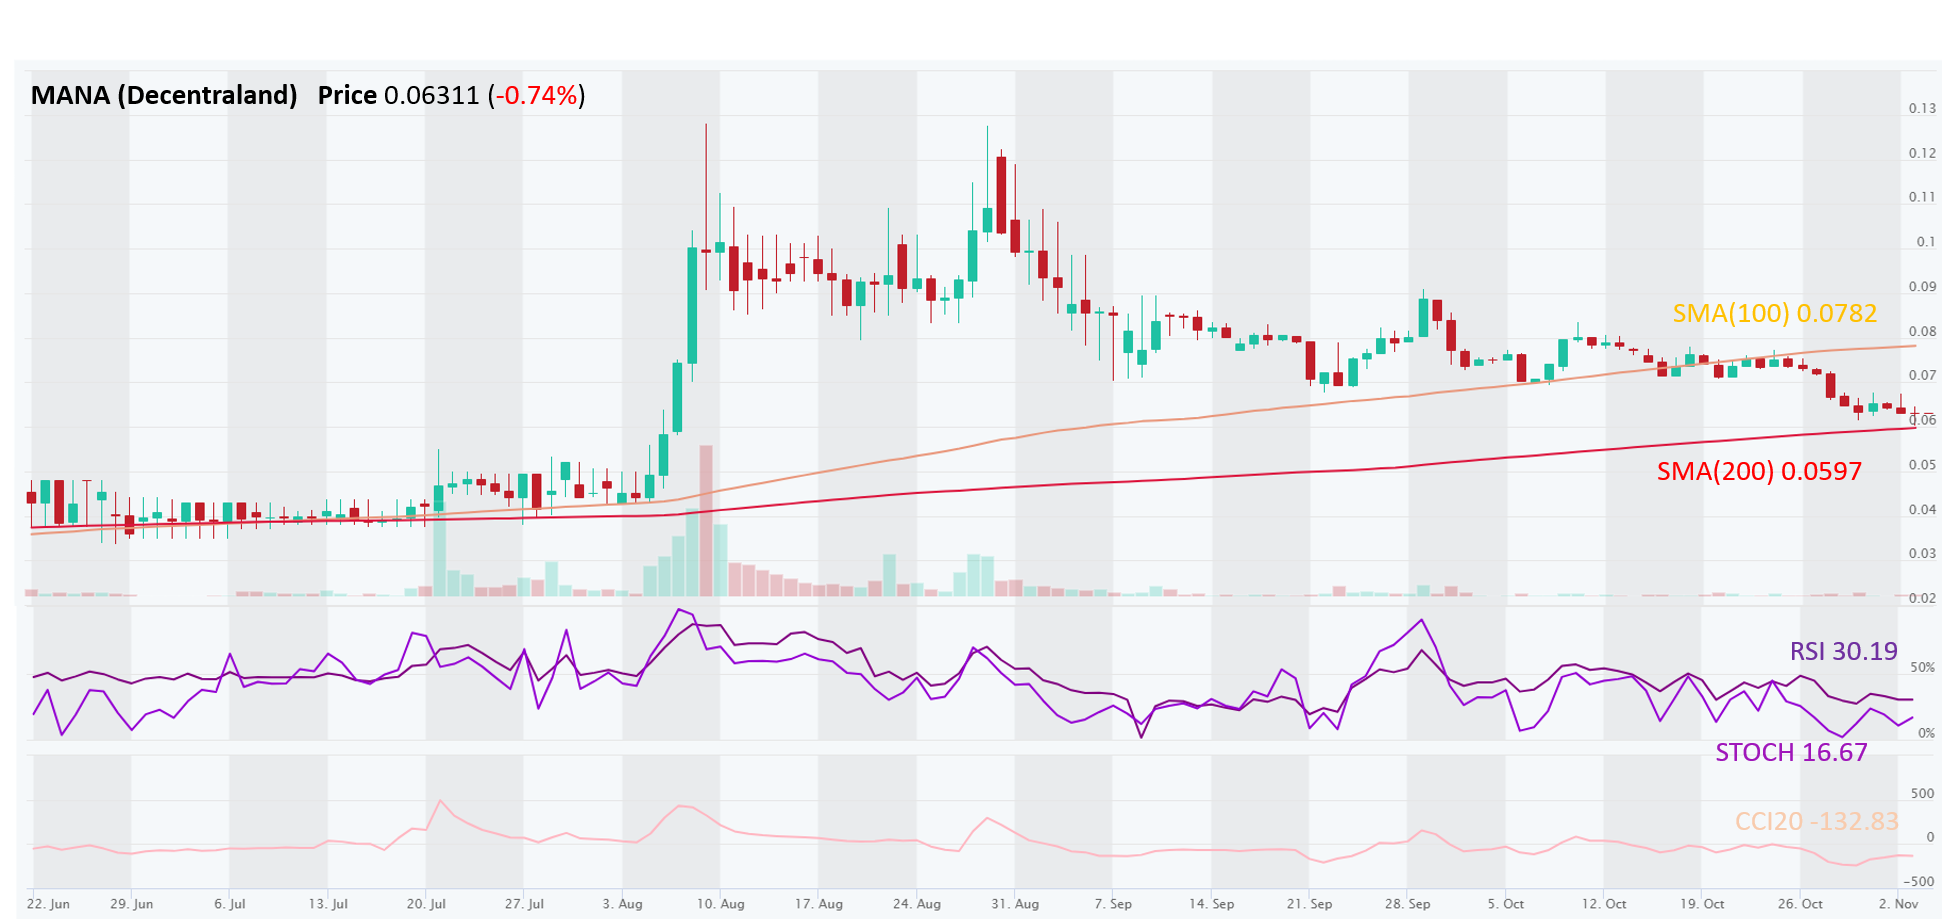
5. Very Oversold. This screen looks for extremely oversold situations that could be ripe for a bounce as sellers get exhausted and value hunters step in. This type of situation ain’t for the faint of heart and is clearly intended for swing traders looking for a reversal. But it could turn into one of those “catching a falling knife” situations.
This week we’re highlighting price action of MANA. It is oversold on STOCH, CCI20, almost oversold on RSI and slowly reaching towards SMA(200), which acted as strong support all-the time.
Risk management – Stop Loss and trade size. In all of these setups, traders should use Stop Loss orders to manage their downside risk, in case the trade goes against us, as it often will. Trading is about probabilities and even though these setups have a high win rate, one must be prepared to minimize losses on the trades that go bust. If Stop Loss order types are not supported by they exchange, at least set up a price alert (see video). Also, trade size should be such that you never risk losing more than 2% of your total equity. Keeping the trade size small allows the trader to setup a wider Stop Loss, which gives the trade more room and time to complete with success. Setting Stop Loss levels too tight can often result in getting knocked out of a trade prematurely.
Disclaimer: This content is for informational purposes only, you should not construe any such information or other material as investment, financial, or other advice. There are risks associated with investing in cryptocurrencies. Loss of principal is possible.