How to spot a trend change: THETA, CEL
Every trend comes to an end, or at least a pause. Here’s how you can tell:
- Price forms a Double or Triple Top
- Declining volume
- MACD flashes a Sell signal
- Long wick candles
We examine THETA and CEL to demonstrate how price action revealed clues about a changing dynamic between buyers and sellers.
Both coins had great runs in September, even when most altcoins, especially DeFi names, were getting crushed. THETA gained ~100% and CEL gained ~350% in September! Sadly, all trends come to an end, except Bitcoin of course :), or at least a pause.
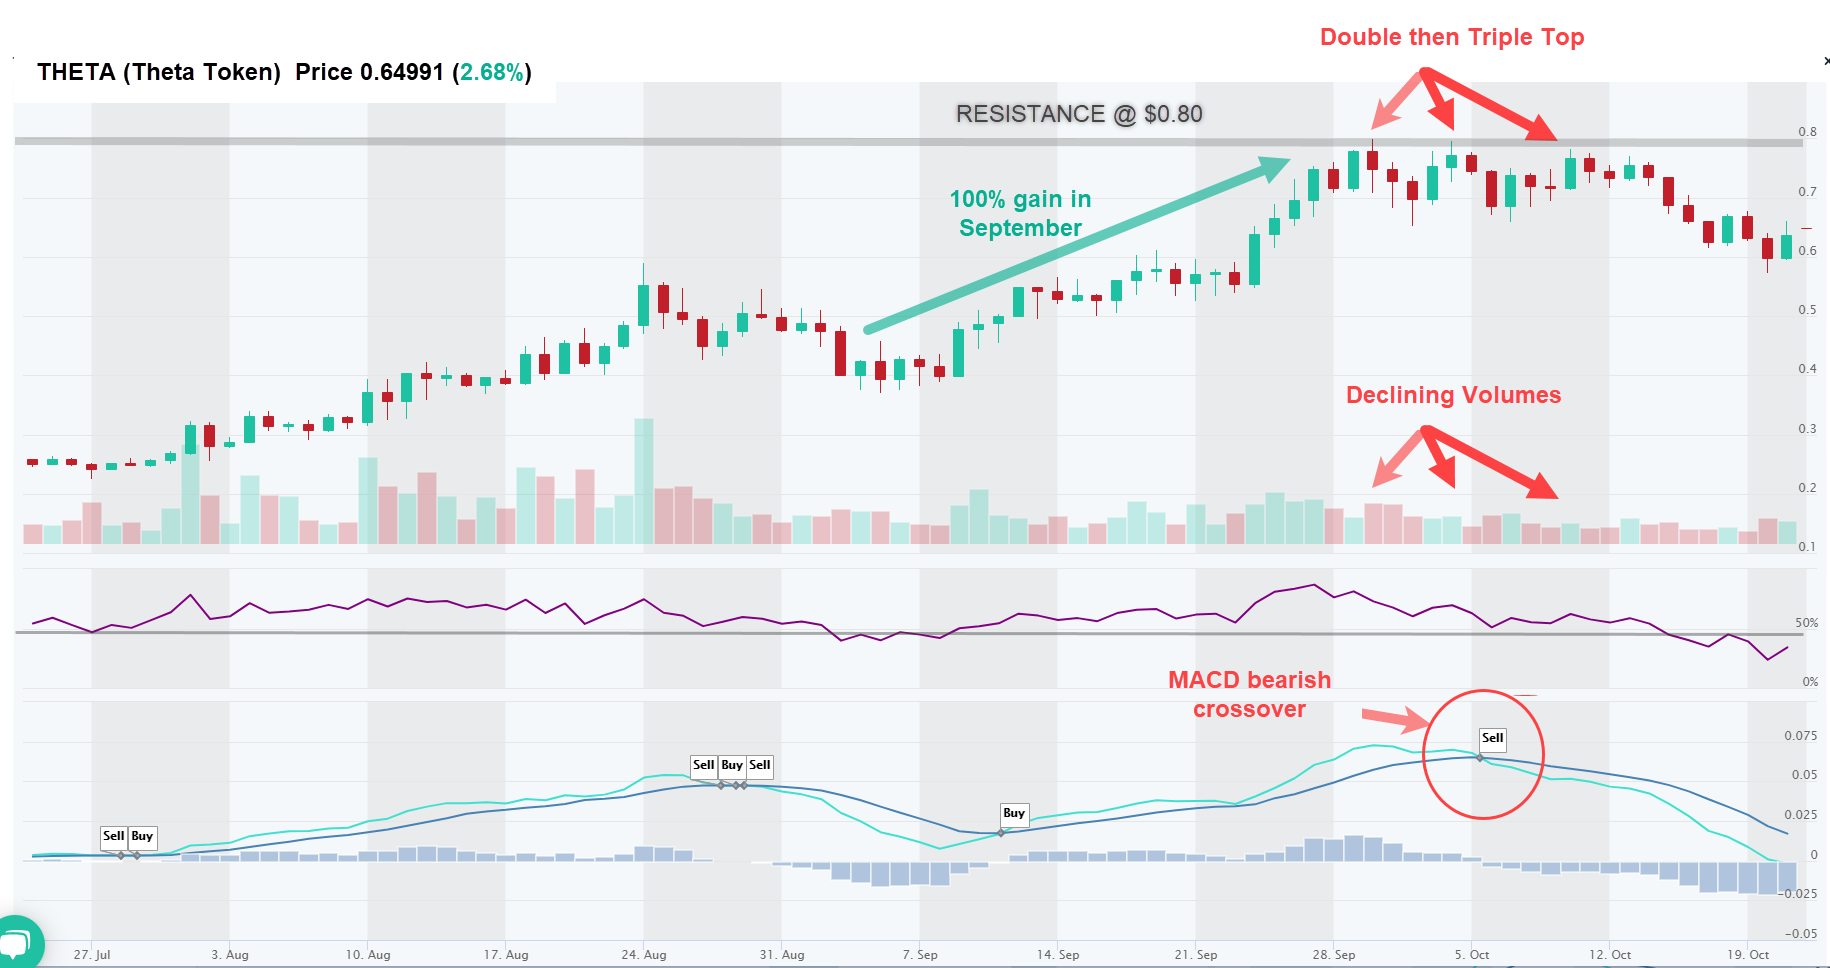
THETA (Theta Coin) ran up to $0.80 on Sep 29, encountered resistance and pulled back, then made another attempt to break and pulled back again. That’s a Double Top, a first clear clue that buyers are running out of strength.
Also, notice that MACD had a bearish crossover on Oct 6, shown in the chart with a “Sell” signal, which indicated a loss of momentum. (You can create alerts for MACD crossovers here). By now, alarms should be going off for any holders of THETA.
That was followed by another unsuccessful attempt to break through $0.80 on Oct 10, which formed a Triple Top! These peaks represent failed attempts to break through an area of resistance. The Double and Triple Top formation were accompanied with a declining volume, which confirms the validity of the chart pattern.
Double and Triple Top chart patterns are powerful chart patterns that occur after an extended uptrend and often represents a reversal pattern that indicates a minor, if not long term, change from a uptrend to an downtrend (i.e. bearish).
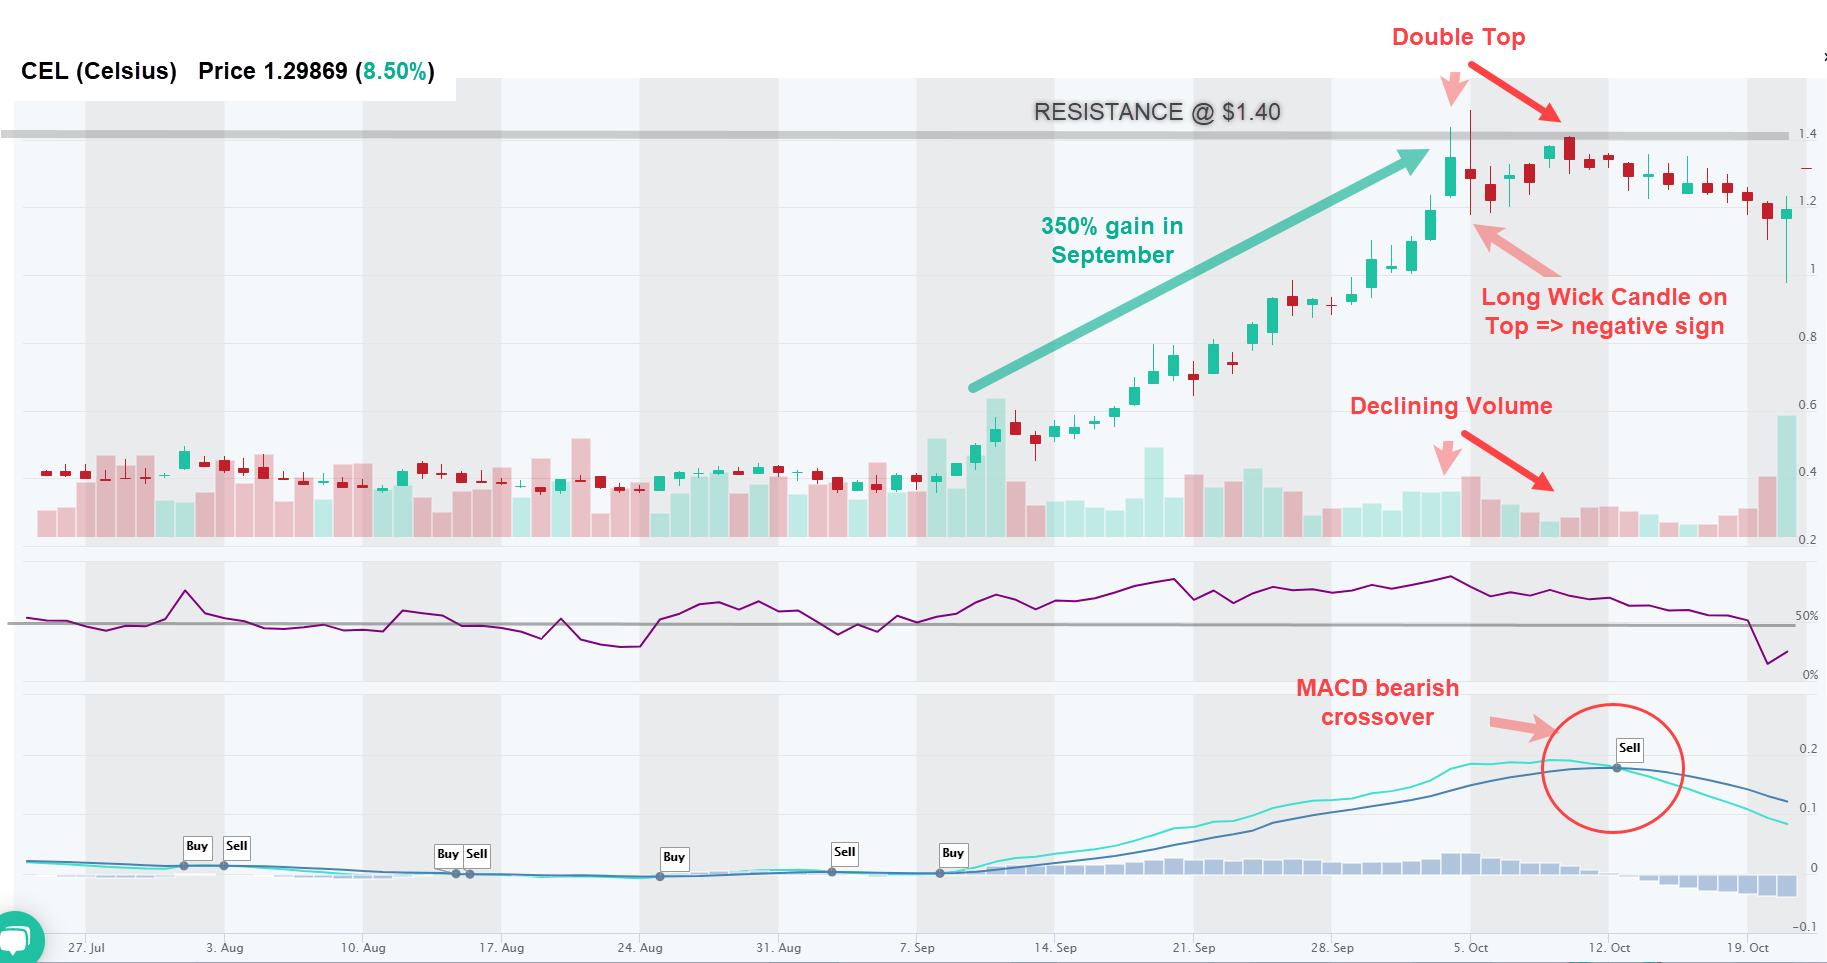
CEL (Celsius) had a similar timeline of events. It had a monster 350% gain in September reaching $1.40 resistance where it formed a Double Top, also confirmed with declining volumes. That was followed by a Sell signal from MACD on Oct 13. By now, holders should be alarmed.
Another interesting clue was on Oct 4, when the price formed a candle with a long wick on top. A long wick that extends above a candle signifies that buyers pushed the price up significantly, however, sellers drove price back down. Hence, there’s a lot of supply at $1.40 level. Since sellers overpowered the buying pressure from bulls, it’s likely that their strength will carry forward leading to a downward movement in price.
Having said all this, it does not mean that the long term trend is broken. We could very well resume that uptrend. But it’s unclear now and buyers should wait for price to break through the resistance levels of $0.80 and $1.40, respectively.
Risk management – Stop Loss and trade size. In all of these setups, traders should use Stop Loss orders to manage their downside risk, in case the trade goes against us, as it often will. Trading is about probabilities and even though these setups have a high win rate, one must be prepared to minimize losses on the trades that go bust. If Stop Loss order types are not supported by they exchange, at least set up a price alert (see video). Also, trade size should be such that you never risk losing more than 2% of your total equity. Keeping the trade size small allows the trader to setup a wider Stop Loss, which gives the trade more room and time to complete with success. Setting Stop Loss levels too tight can often result in getting knocked out of a trade prematurely.
Disclaimer: This content is for informational purposes only, you should not construe any such information or other material as investment, financial, or other advice. There are risks associated with investing in cryptocurrencies. Loss of principal is possible.