TRON (TRX) Analysis
TRON (TRX) Analysis
In addition to automated chart patterns, altFINS’ analysts conduct technical chart analyses of top 30 cryptocurrencies. We call these Curated Charts and they evaluate 5 core principals of technical analysis: Trend, Momentum, Patterns, Volume, Support and Resistance.
TRON (TRX) technical analysis:
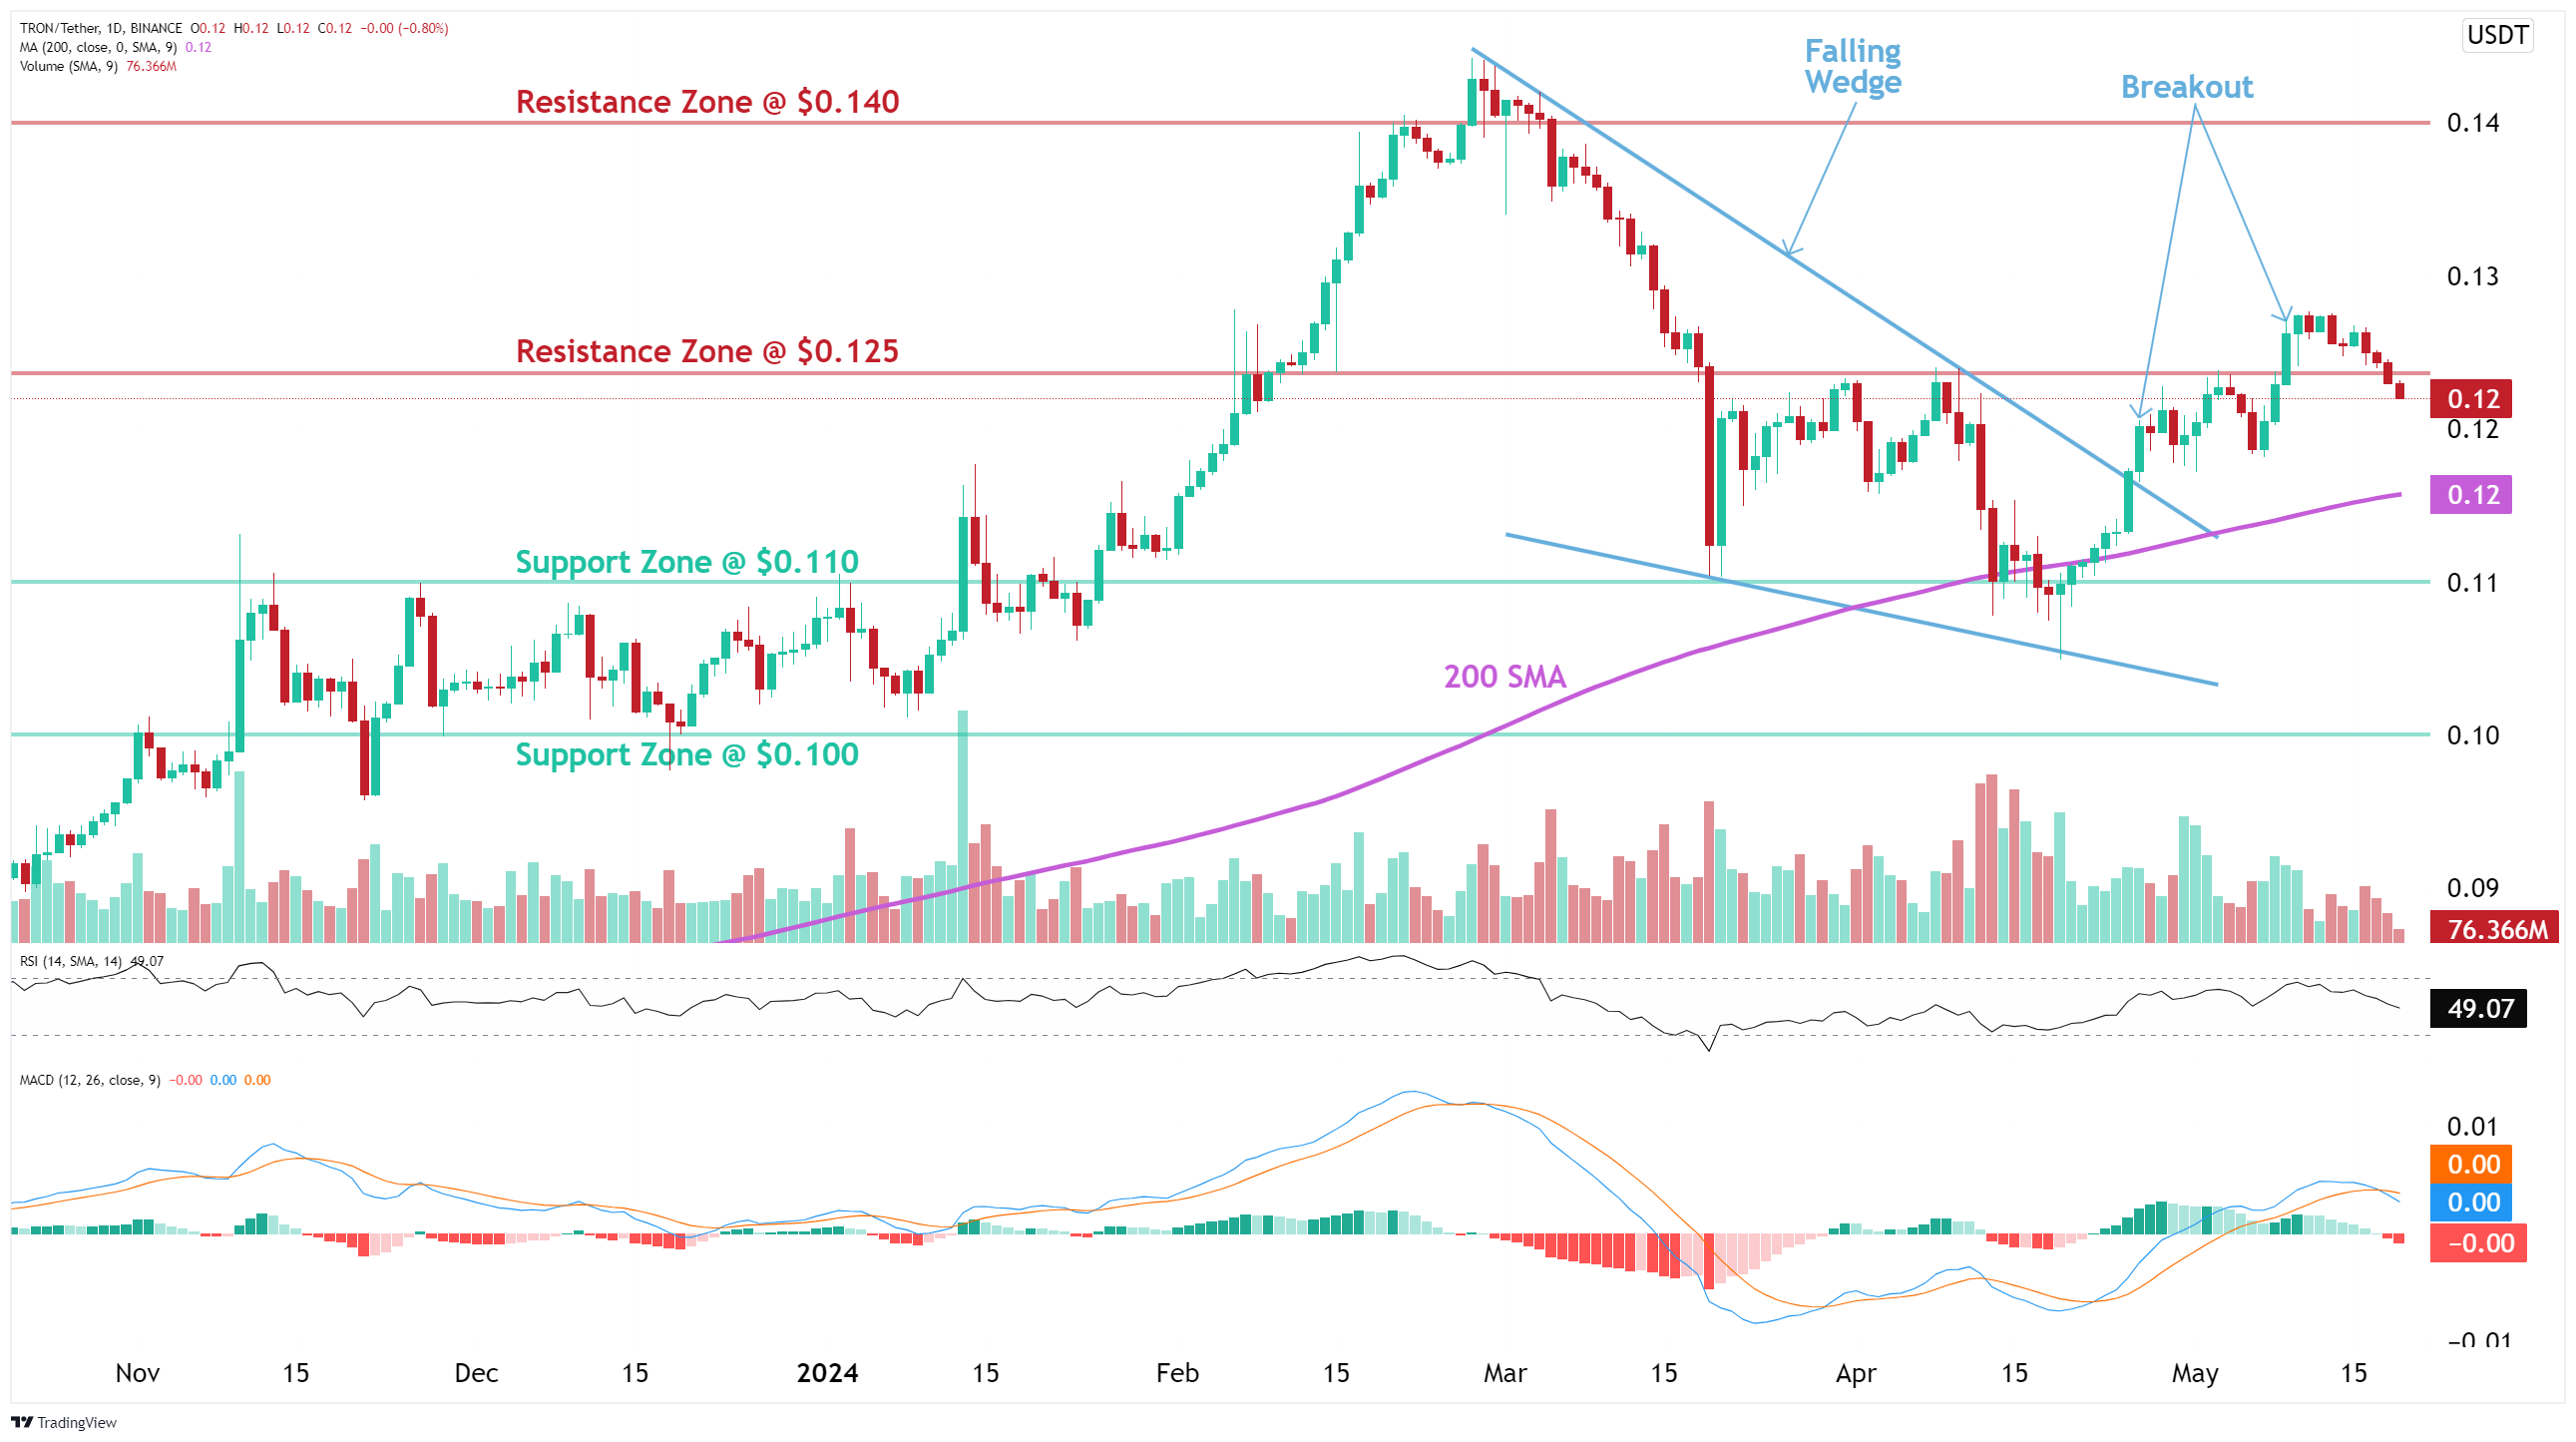
Trade setup: Trends are mixed. Price broke out of Falling Wedge pattern and above 200-day moving average, which could signal resumption of uptrend. Pullback near $0.12 could be a swing trade entry opportunity in uptrend, with+15% upside potential to $0.14. Stop Loss (SL) level at $0.117. (Set a price alert).
Trend: Neutral on Short-Term basis and Uptrend on Medium- and Long-Term basis.
Momentum is Mixed as MACD Line is below MACD Signal Line (Bearish) but RSI ~ 50 (Neutral).
Support and Resistance: Nearest Support Zone is $0.110, then $0.100. The nearest Resistance Zone is $0.125, then $0.140.
See live TRON (TRX) chart here
See more curated charts of coins with technical analyses.
Recent news and research:
TRON Founder H.E. Justin Sun Announces the Launch of USDD — A Decentralized Stablecoin
Centre to Expand USDC to Ten More Blockchains; Launches on Tron
Tron (TRX) Blockchain Starts Supporting Major Tether Rival USDC
Find more real-time news here.