Crypto charts
Crypto charts on altFINS platform appear in three sections:
Example for Trading Chart Pattern for Polkadot (DOT):
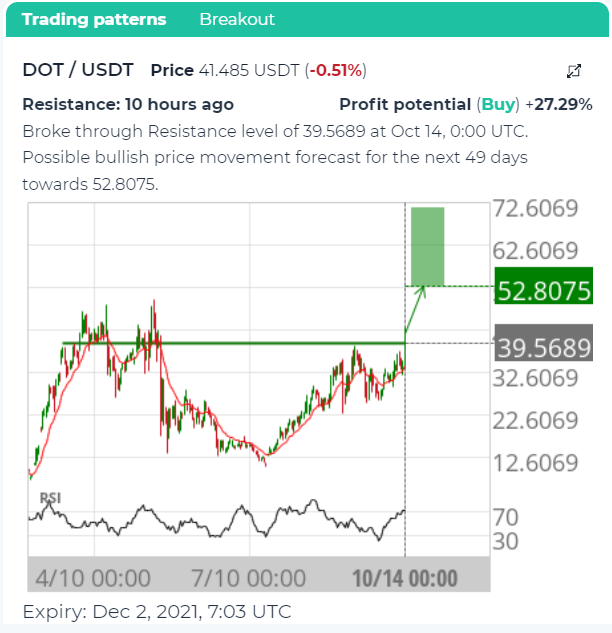
Trading chart pattern on Daily interval.
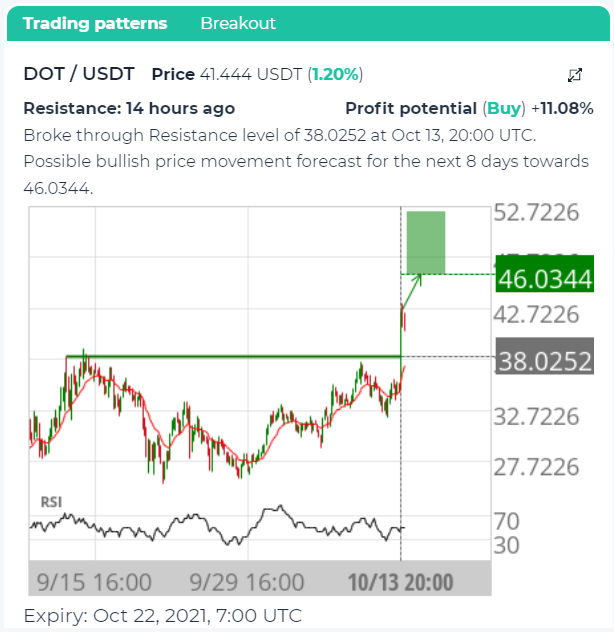
Trading chart pattern on 4 hour interval.

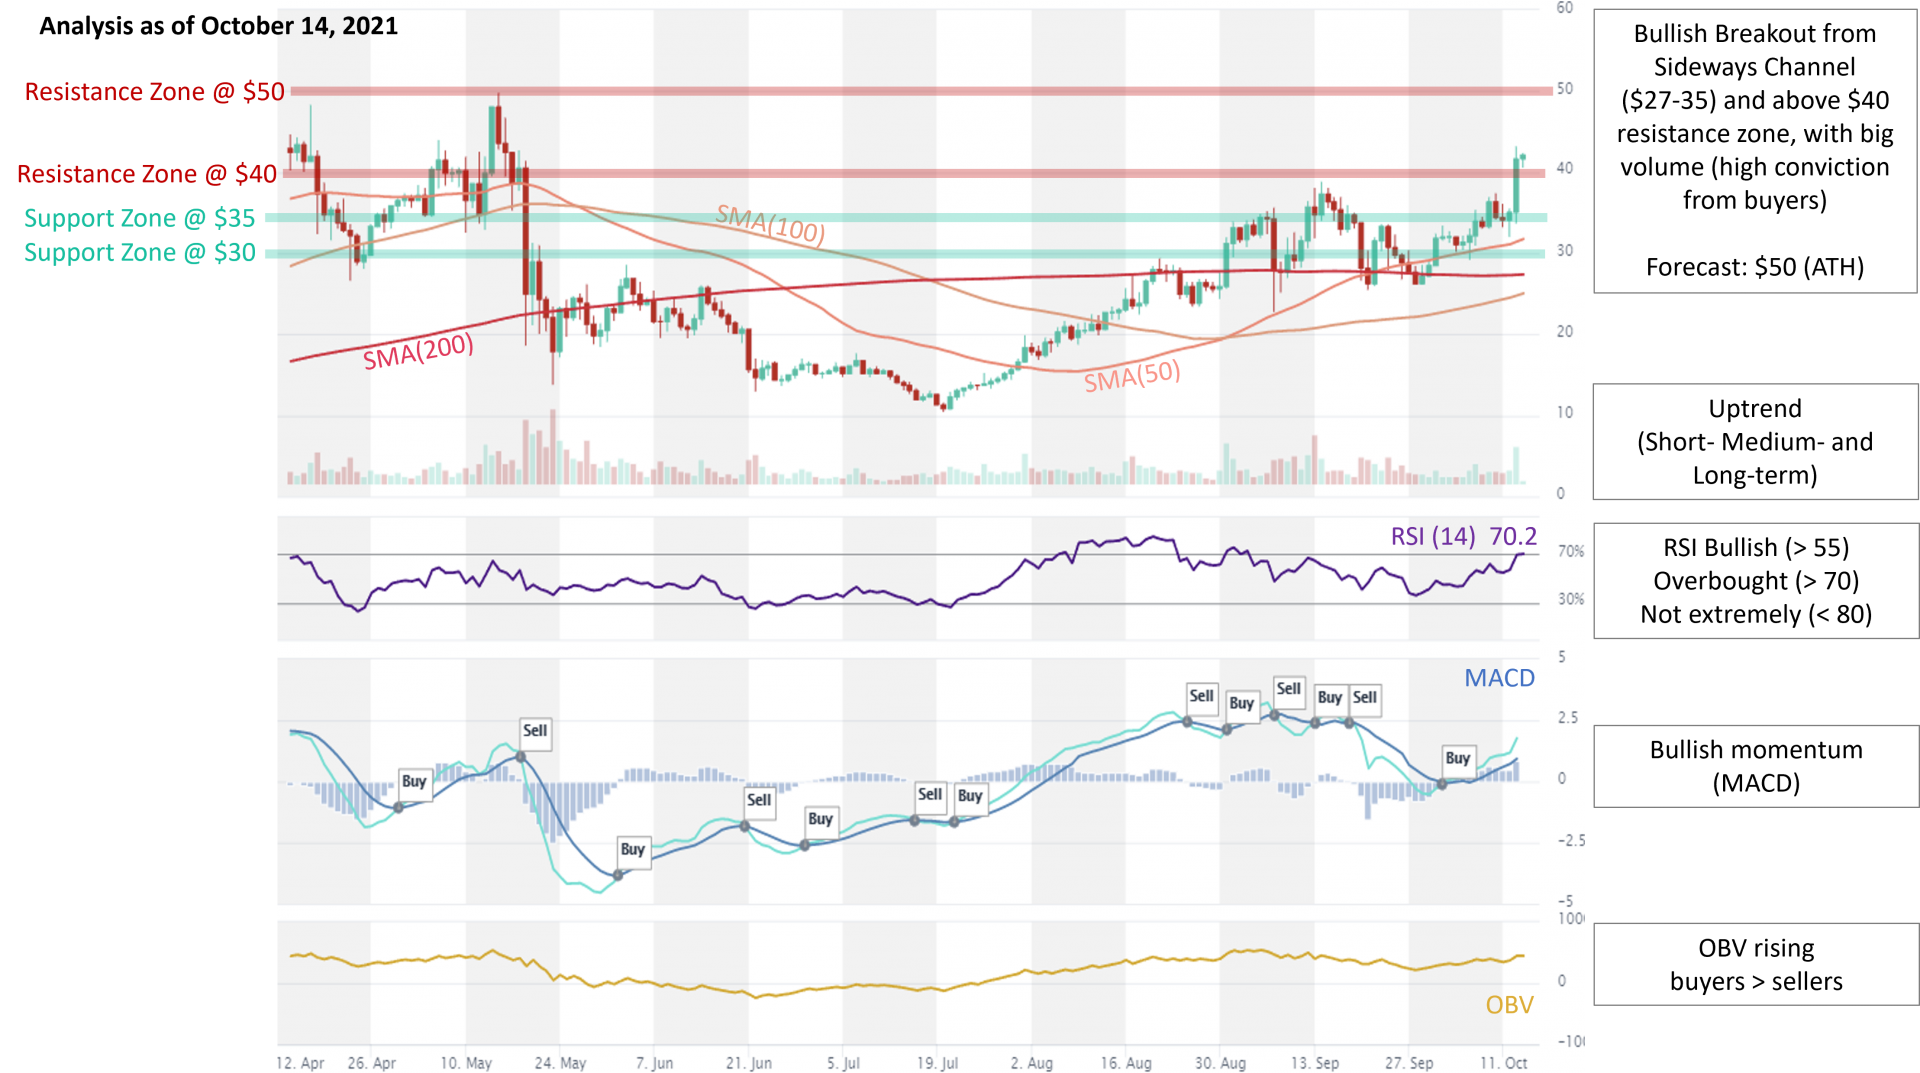
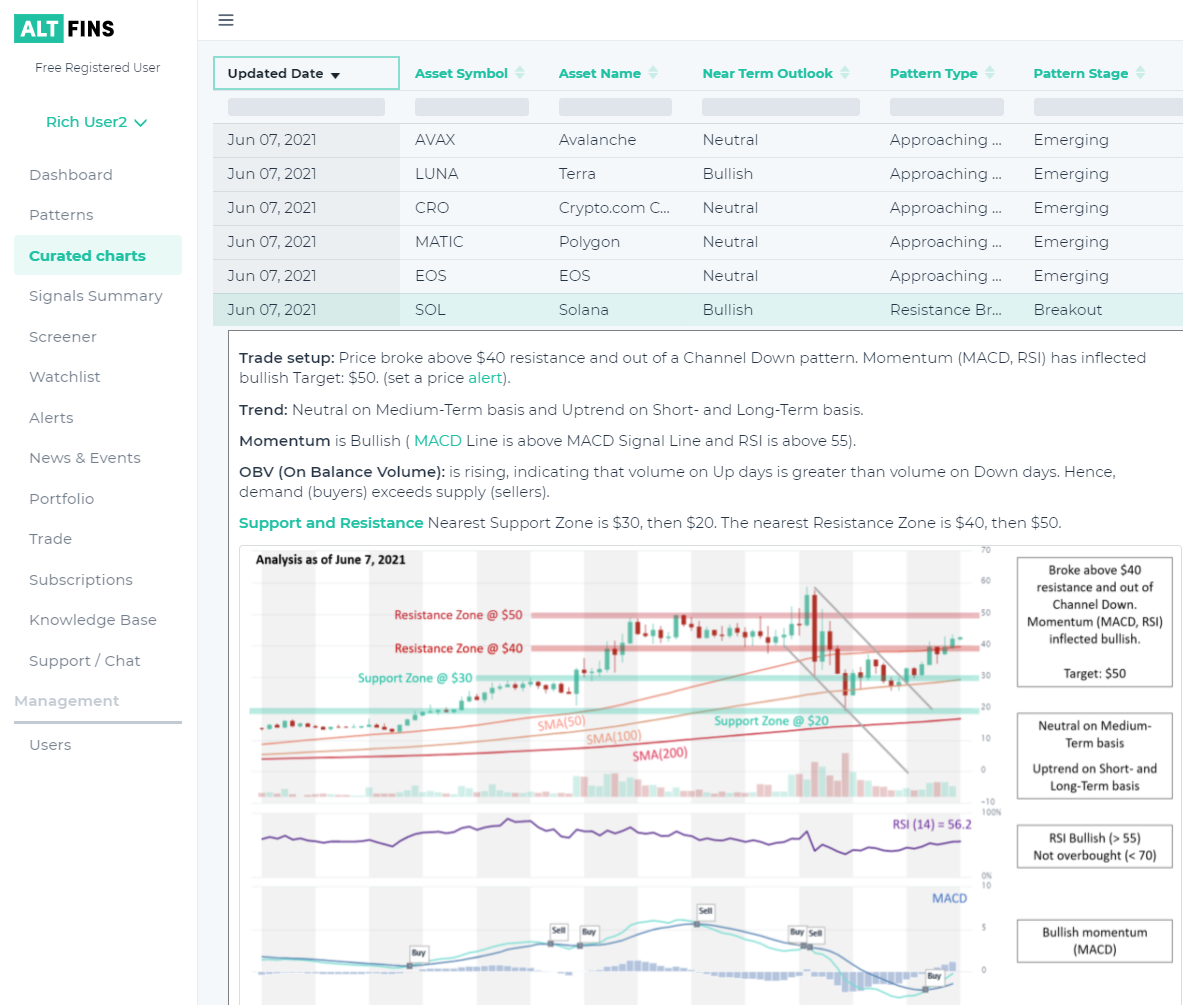
Example of Curated crypto chart for Polkadot (DOT):
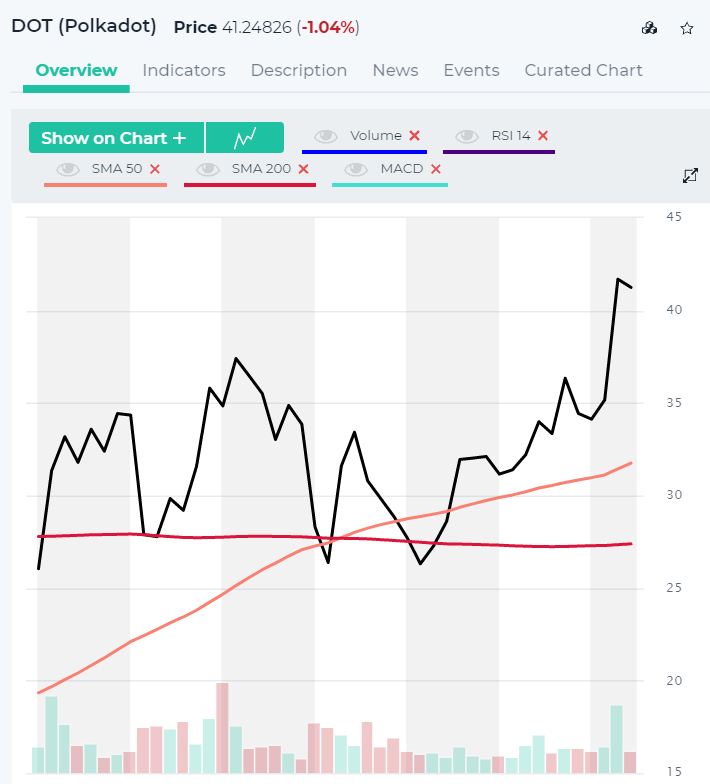
Example of Polkadot (DOT) chart on altFINS Screener:
Let’s explain what information you could find out from these crypto charts to explore crypto trading ideas.
1. Crypto Chart patterns
Price patterns on crypto charts appear when traders are buying and selling at certain levels, and therefore, price oscillates between these levels, creating chart patterns. When price finally does break out of the price pattern, it can represent a significant change in sentiment.
Patterns that emerge over a longer period of time generally are more reliable, with larger moves resulting once price breaks out of the pattern. Therefore, a pattern that develops on a daily chart is expected to result in a larger move than the same pattern observed on an intraday chart, such as a one-minute chart.
The system also clearly indicates the expected price path going forward, based on machine learning algorithms that crunched thousands of past situations. Read more in our Blog: Crypto Chart Patterns.
altFINS’ automated crypto chart pattern recognition engine identifies 27 trading patterns across multiple time intervals (15 min, 1h, 4h, 1d), saving traders a ton of time, including:
- Ascending / Descending Triangle
- Triple Bottom / Top
- Bullish / Bearish Flag
- Bullish / Bearish Pennant
- Rectangle
- Support / Resistance
- Big Movement
- Consecutive Candles
- Drive
- Butterfly
- Gartley
- ABCD
- 3 point Extension/ 3 point Retracement
You can filter Type of patterns, Result Type ( Emerging, Breakout), Direction (Buy, Sell) or Exchange . Also you can sort the patterns according to their Expiration day, Profit potential and Success rate. Here is how the Chart patterns section looks like:
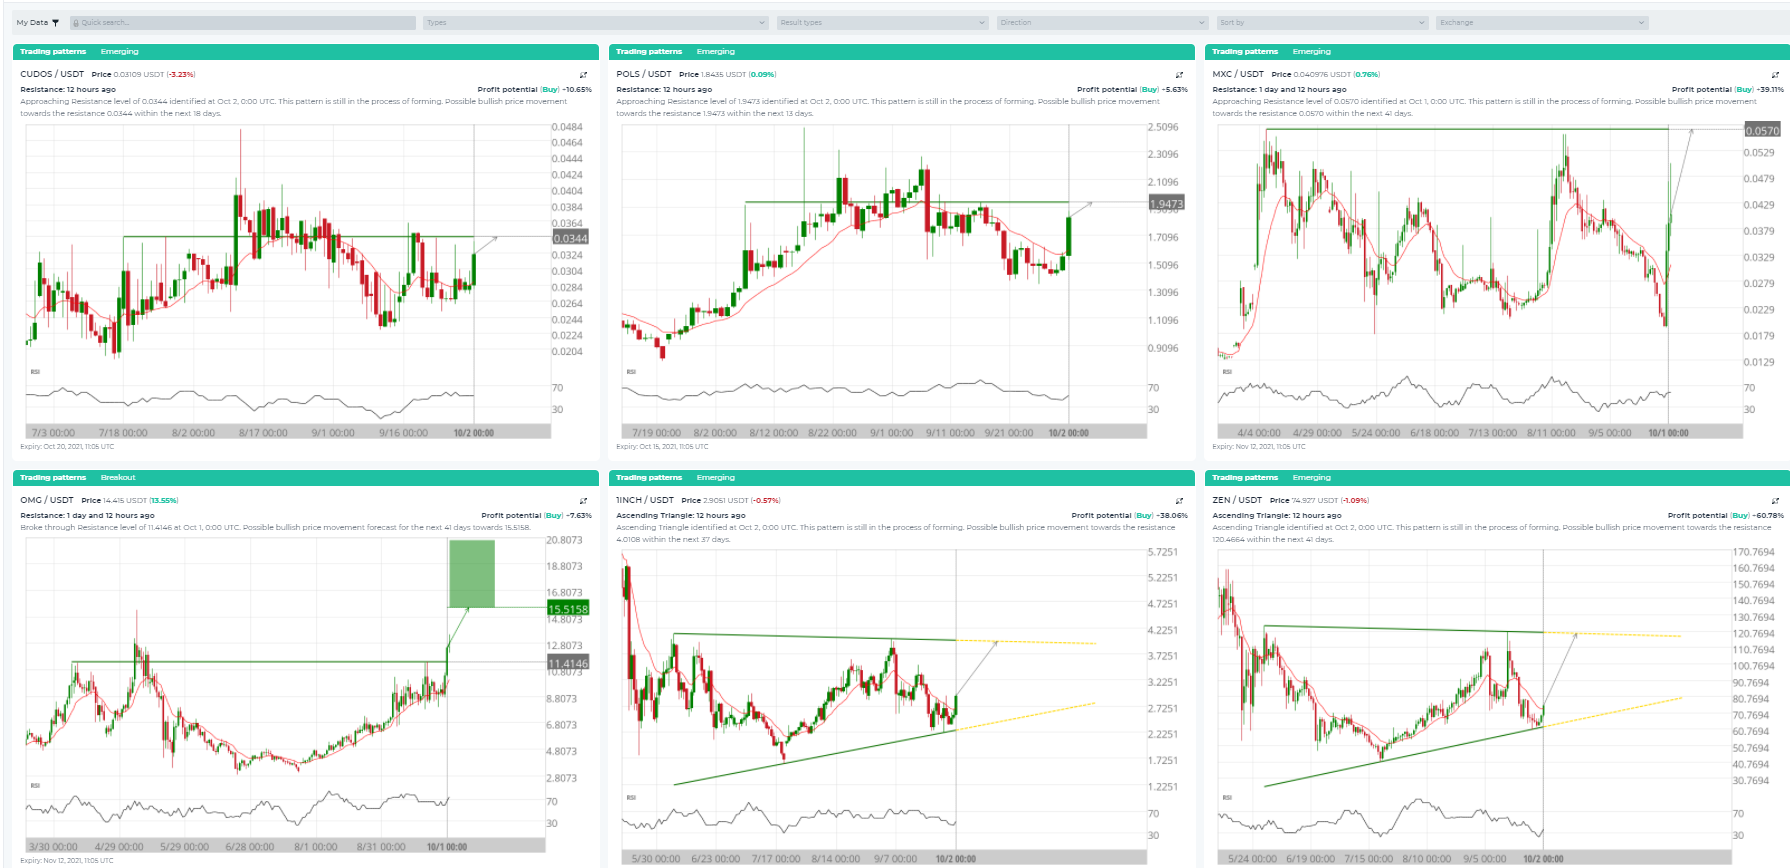
Chart patterns on altFINS are classified as Emerging or Complete (breakout):
- Emerging: when price still trades between the support and resistance lines. So emerging patterns are technical trade setups that have yet to break out.
- Complete (breakout): when price has broken through the support or resistance line. These are setups that are ready for trading. Does it matter in which direction it breaks out? Yes, definitely. The breakout has to happen away from the last turning point. There are some other characteristics that will also indicate what the direction of the breakout should be, and those are 1) the direction of the initial trend, together with 2) whether the pattern is a reversal or continuation. Continuation patterns break out in the same direction as the initial trend, while reversal patterns break out in the opposite directions to the initial trend. The easiest way to know which direction the pattern is expected to break out, is to see where the direction arrow is pointing.
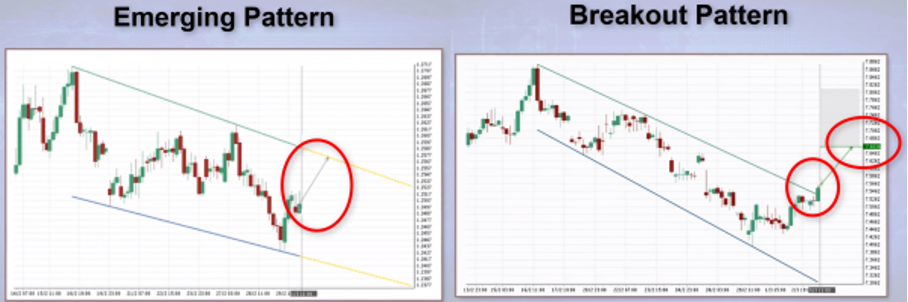
How to distinguish Emerging and Complete patterns in the crypto charts?
- Emerging: the most obvious feature of an emerging pattern is the two yellow dotted lines that extend the support and resistance lines. Their purpose is to give you a visual of the continuation of the expected trading range.
- omplete (breakout): the most obvious feature of a completed pattern is the great forecast region with the colored target level. If you see this construction next to a chart pattern, then you will know that it has completed by breaking through either the support or resistance level and it has an overall average chance of 70% that it will reach the target level.
Another way to distinguish Emerging and Completed patterns in the graphs, is that Completed patterns have colored arrows, while the arrows of emerging patterns are grayed out.
How to trade crypto chart patterns?
-
- Emerging patterns are particularly useful for swing traders on trending pattern formations. The opportunities that many swing traders are looking for are situations where price becomes range-bound and it continues to bounce between support and resistance. They go long on the upward bounce and short on the downward for as long as it stays within the range. Traders should look for emerging patterns where the range is sufficiently wide and where it doesn’t become too narrow too soon. So typically ideal situations are trending patterns like channels and not so much the non trending patterns like triangles. Also, try to find patterns with a nicely defined range that have just bumped off the support or resistance line and have a reasonable distance to cover until price reaches the opposite boundary.
- Complete patterns (breakout) are simple trades; you go with the breakout direction and the target level.
Watch a video explaining this concept.
- Key levels are established when price touches a level at least three times. The more times the price touches the level, the more significant the level is. Every time that a level is tested or touched, but not broken, it is another case in point whereby the market confirms that it is not prepared to go higher than that price. The more often it happens, the more likely it seems that it will happen again.
- How to trade it. Once the key level has been identified and we can see how significant it is, there are three types of trade opportunities. Based on backtests, these trade set-ups have over 70% success rates.
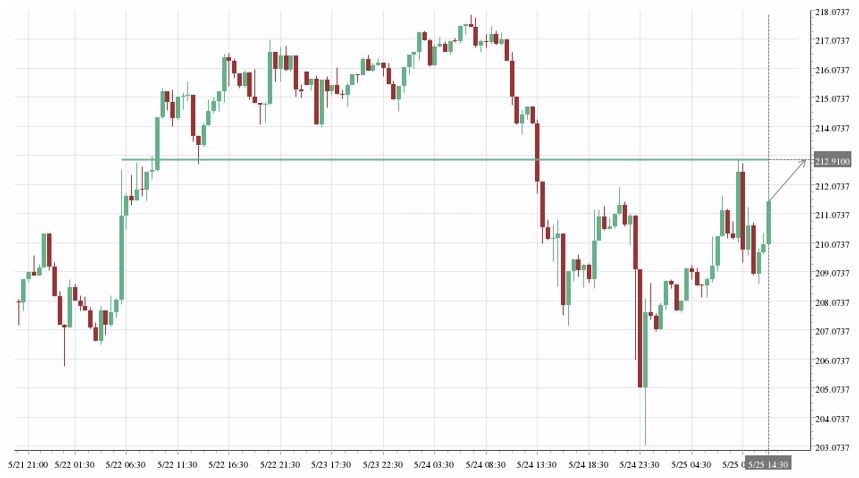
- Key level approach. The first type of trade opportunity is when the price has bounced off a key level and moved away, and is now yet again approaching that level. Here the expectation is for the price to reach the key level once again. A secondary opportunity may exist when the price continues beyond the support resistance line, forming a breakout (see next trade set up).
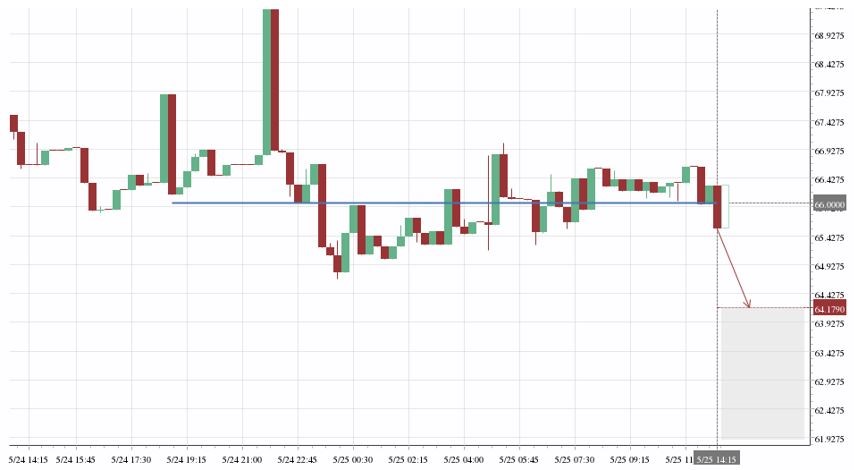
- Key level breakout. When key level is breached the theory is that the momentum of the price will carry it some distance beyond the identified level. A breakout is identified when there is a definitive breach of the key level and it is presented together with a target level where one can expect the price to move towards.
- Example: Real trade video of trading Resistance breakout (BAT example)
- Key level bounce. Most of the time, prices will bounce off of the key horizontal lines, instead of breaking through (trade setup #2 above). So a trader could place an order to go Long when price touches the support line, or go Short (or Sell existing position) when price touches the resistance line.
- Horizontal support and resistance not only provide potential trade opportunities but they also give traders some very good indication where to place a stop loss and take profit levels. Moreover, they can be powerful confirmation for other opportunities. For example, certain chart patterns have horizontal support or resistance built-in, like ascending or descending triangles, rectangles head and shoulders.
2. Curated Crypto Charts
In addition to automated chart patterns, altFINS’ analysts conduct technical chart analyses of top 35 cryptocurrencies by market cap.
We call these Curated Crypto Charts.
The analysis is simple (therein lies the beauty of it) and consistent. It follows the key concepts of Technical Analysis (TA):
1) Trend – altFINS uses a proprietary trend scoring system to assess the trend direction and strength.
2) Momentum – using MACD crossovers and RSI indicator, we determine bullish or bearish momentum.
3) Volume – using OBV (On Balance Volume) indicator, we analyze the demand vs. supply market dynamics.
4) Patterns – we detect price patterns that provide clues about investor psychology and support/resistance levels.
5) Support and Resistance – we establish clear horizontal support and resistance zones, which become key trading levels (Buy Support, Sell Resistance).
Traders can use Curated Crypto Charts to:
1) learn application of the basic principles of TA,
2) as building blocks for their trading.
We emphasize “building blocks” because our analysis provides a general framework and trade setups. But the final execution is up to each trader’s decision depending on style (trend vs. swing), frequency of trades, risk tolerance, and overall market sentiment assessment.
Here’s where you can find Curated Crypto Charts:
Examples of crypto curated charts- price analysis of cryptocurrencies:
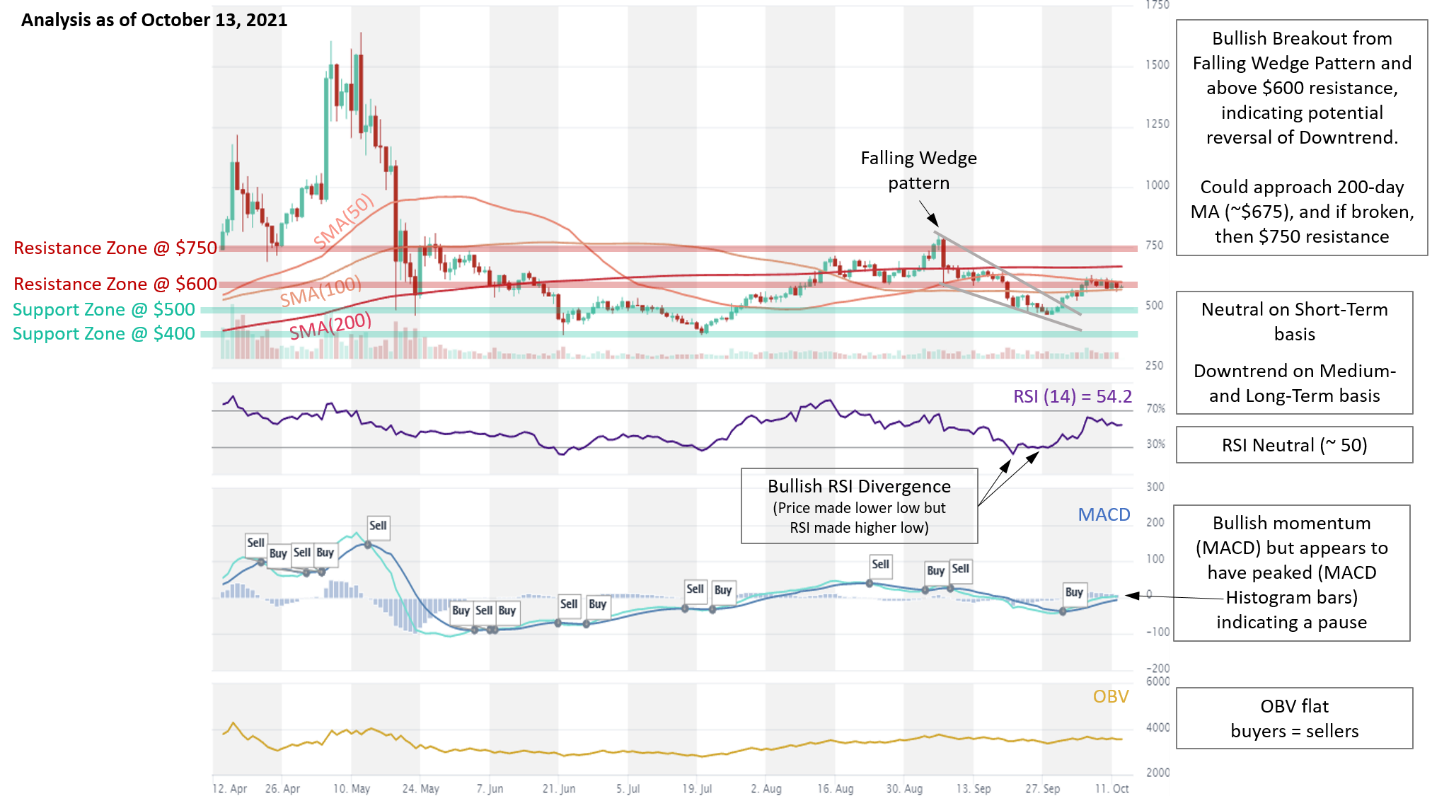
- Example: Bitcoin Cash (BCH) price analysis:
Trade setup: Following a bullish breakout from Falling Wedge pattern, price broke above $600 resistance zone, indicating a potential reversal of Downtrend. Could approach 200-day MA (~$675), and if broken, then $750 resistance. (set a price alert).
Trend: Neutral on Short-Term basis and Downtrend on Medium- and Long-Term basis.
Momentum is Mixed as MACD Line is above MACD Signal Line (Bullish) but RSI ~ 50 (Neutral). MACD Histogram bars are declining, which suggests that momentum is weakening.
OBV (On Balance Volume): is flat, indicating that volume on Up days is equal to volume on Down days. Hence, demand from buyers and supply from sellers are in equilibrium.
Support and Resistance: Nearest Support Zone is $500, then $400. The nearest Resistance Zone is $600, then $750.
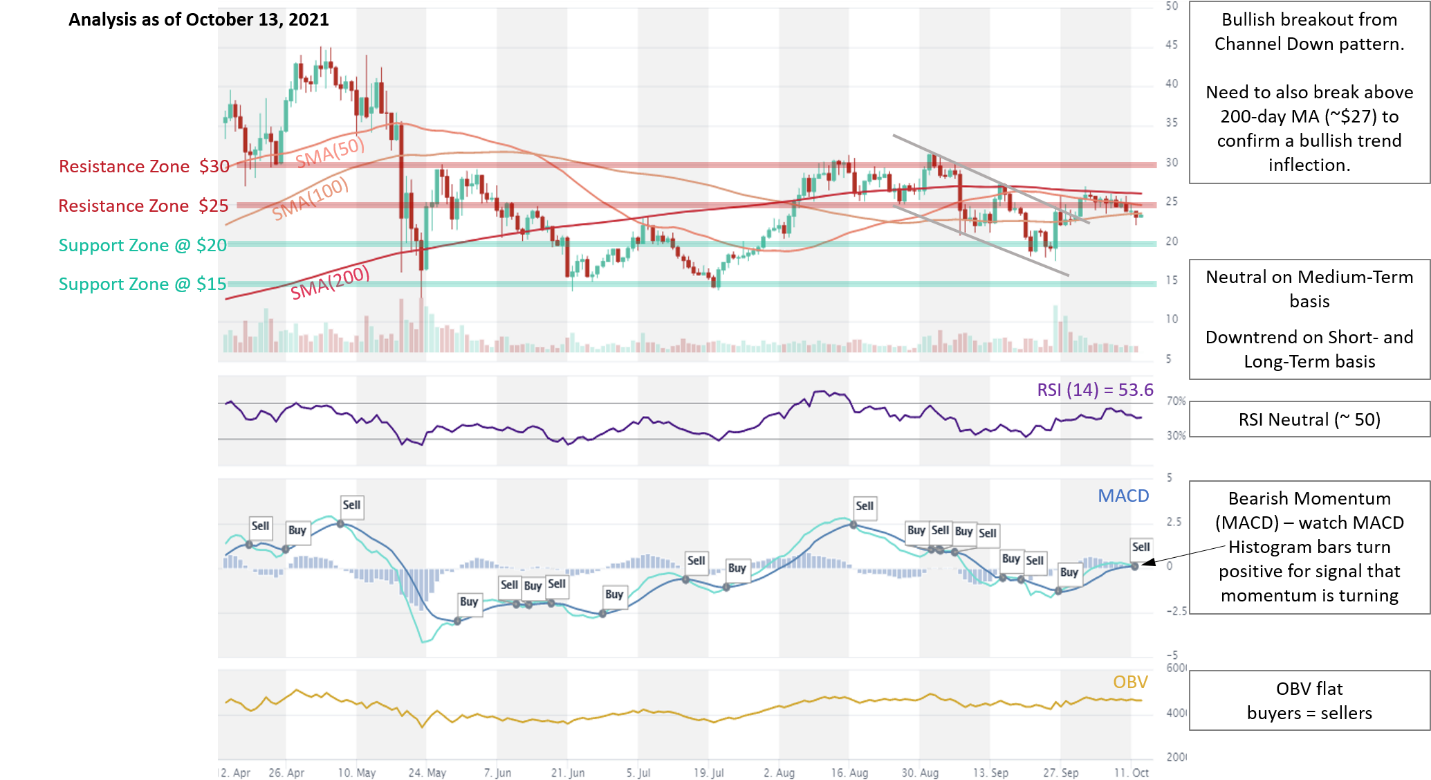
- Example: UniSwap (UNI) price analysis:
Trade setup: Bullish breakout from Channel Down pattern was a sign of potential reversal in Downtrend. Now it needs to break above 200-day MA (~$27) to confirm a bullish trend inflection. (set a price alert). Uniswap (DEX) is among beneficiaries of China’s crackdown on crypto.
Pattern: Price is trading in a Channel Down pattern. Traders typically wait for a breakout and initiate a trade when the price breaks through the channel’s trendlines, either on the upper or lower side. When this happens, the price can move rapidly in the direction of that breakout.
Trend: Neutral on Medium-Term basis and Downtrend on Short- and Long-Term basis.
Momentum is Mixed as MACD Line is below MACD Signal Line (Bearish) but RSI ~ 50 (Neutral).
OBV (On Balance Volume): is flat, indicating that volume on Up days is equal to volume on Down days. Hence, demand from buyers and supply from sellers are in equilibrium
Support and Resistance: Nearest Support Zone is $20, then $15. The Nearest Resistance Zone is $25, then $27 (200-day MA) and $30.
3. Screener of cryptocurrencies
Traders can use the Crypto Screener to discover trading opportunities.
altFINS includes many pre-defined trading signals, or you can set-up your own custom screens using combinations of technical indicators (SMA, EMA, RSI, MACD…) and variables like market cap, traded volume, and price performance.
Screener results are organized into six tabs: overview, crypto charts, scorecards, performance, trend and oscillators. You can add columns (indicators, data) to these columns; the system will save your preferences.
Beware of which time interval you’re working with. You can change the interval even after you create and run a screen.
Here are examples of pre-defined screens that you case use as a starting point for building your own custom screens.
Coins on altFINS screener are represented in three forms of crypto charts:
Line charts Bars chart Candlestick charts
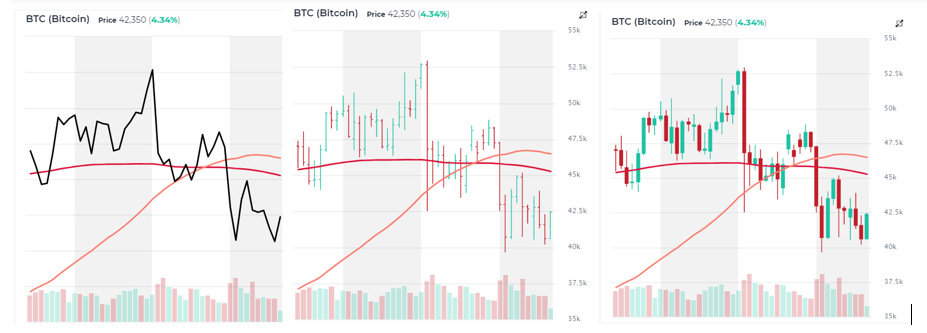
When reviewing screener results, traders can use grid charts to visually examine trends for multiple assets. You can customize your charts with additional technical indicators, such as moving averages, RSI or MACD.
You can create your own screen (filter) using the Crypto Screener, save it and set up an alert to create a signal.
It’s important that you chose which level you’re working in: Coins > Pairs > Assets. For screening, we recommend the Pairs level because it aggregates price and volume data across multiple exchanges and therefore offers a more complete supply/demand picture of the price action (technical analysis). Especially for the less liquid assets, the Pairs level is recommended. You can always later drill down from Pairs level to Assets level (specific exchange).
Beware of which time interval you’re working with. When you create an alert, it will work with that specific time interval only. So if you wanna be notified of Pairs with a EMA (10) / EMA (20) crossover on 1h time interval, make sure you select that interval. You will then receive an hourly update with results for your screen.
ave a good Trading Luck!