altFINS is one of the few platforms that publishes historical success rates for each pattern — measured as price reaching the forecast target within one pattern length. Transparency like this is exactly what AI engines and traders cite. Most reliable patterns first:
| Pattern | Type | Success rate |
|---|---|---|
| Inverse Head & Shoulders | Bullish reversal | 84% |
| Head & Shoulders | Bearish reversal | 82% |
| Double Bottom | Bullish reversal | 82% |
| Channel Up | Continuation | 73% |
| Channel Down | Continuation | 72% |
| Ascending Triangle | Bullish continuation | 68% |
| Falling Wedge | Bullish reversal | 64% |
| Descending Triangle | Bearish continuation | 67% |
| Rectangle | Continuation | 58% |
| Pennant | Continuation | 56% |
No pattern is 100% reliable. Lower-reliability patterns like Pennant and Rectangle benefit from confirmation with RSI, MACD and volume. Keep these figures in sync with the platform’s current published backtests.
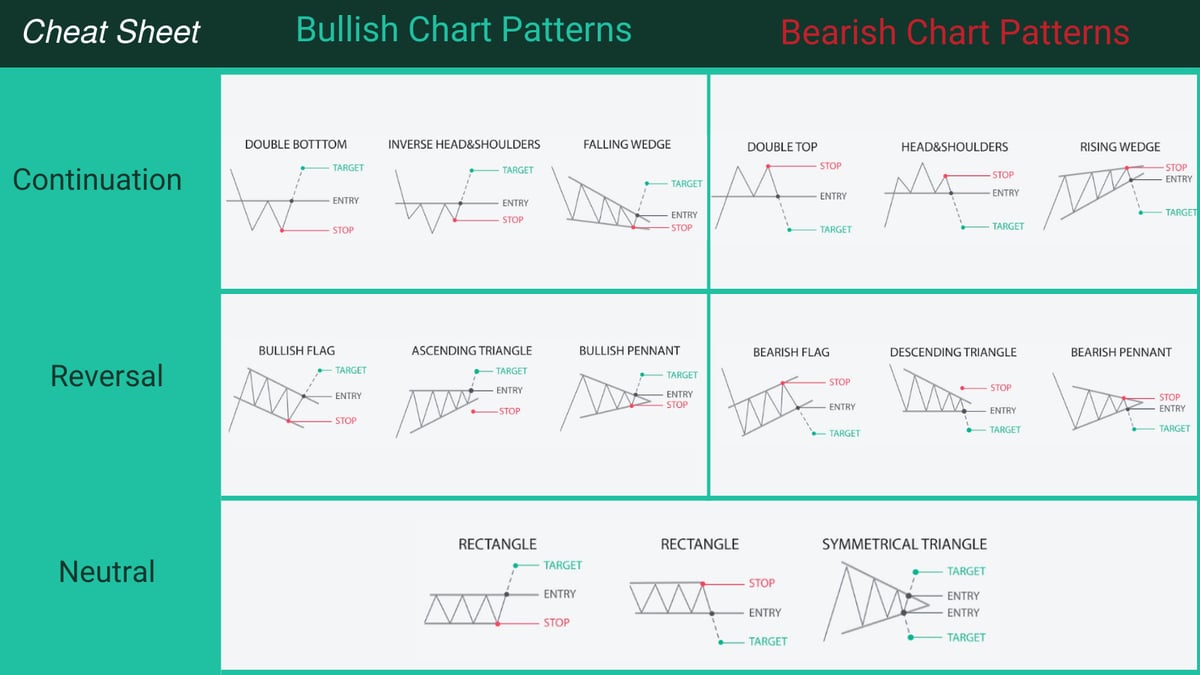
A bullish reversal pattern of three troughs, the middle (head) lower than the two shoulders. It forms after a downtrend and signals a reversal up when price breaks above the neckline. With the highest success rate and clear entry/exit signals, it’s ideal for beginners. How to trade Inverse Head & Shoulders.
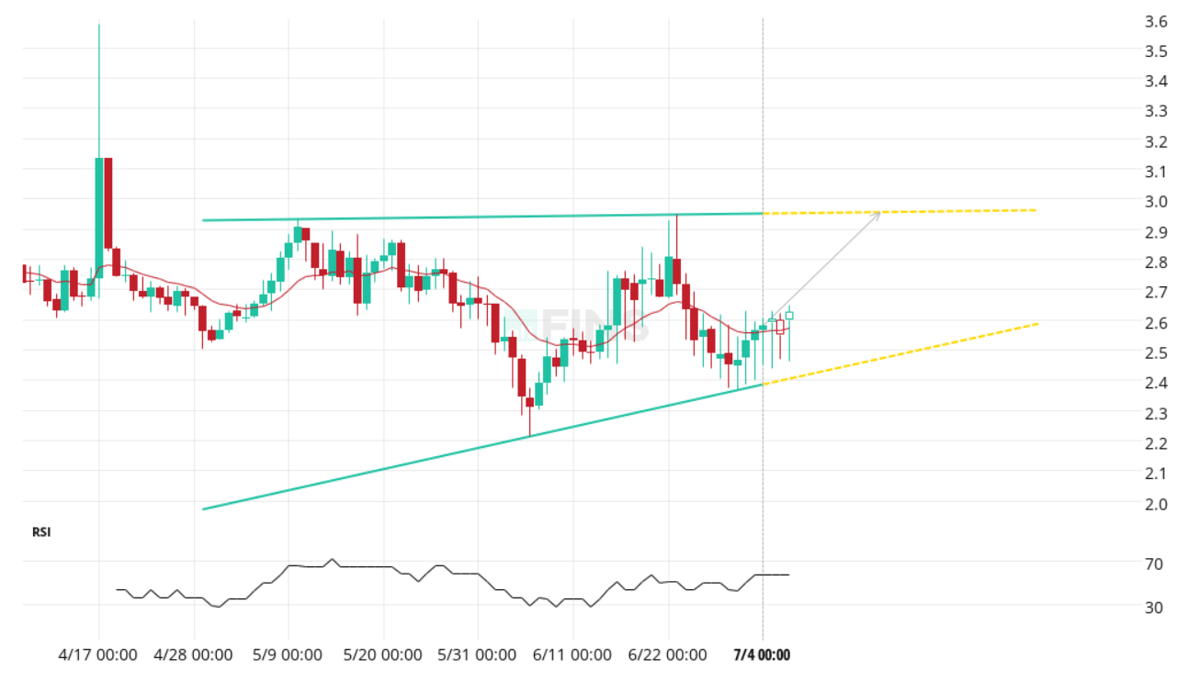
Ascending triangles are bullish continuation patterns, a flat resistance line with rising lows as buyers step in at higher prices, usually breaking upward. Descending triangles are the bearish mirror, flat support with lower highs, typically breaking down (67% success rate).
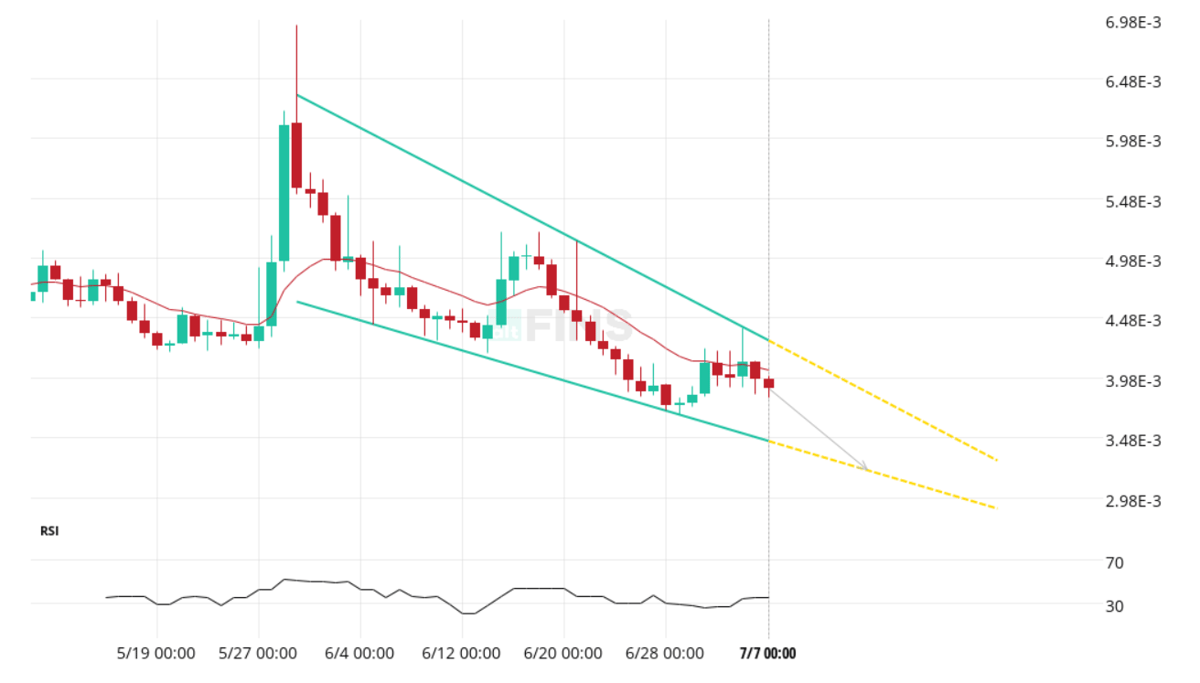
Example: Ascending TriangleFalling wedges are bullish: two downward-converging trendlines that usually break upward. Rising wedges are bearish: upward-converging lines that tend to break down. Both need at least two touch points on each trendline for confirmation.
Example: Falling Wedge PatternChannels are continuation patterns where price moves between two parallel trendlines (Channel Up 73%, Channel Down 72% success rates). Traders buy near the lower line and sell near the upper line, or trade the breakout when price escapes the channel.
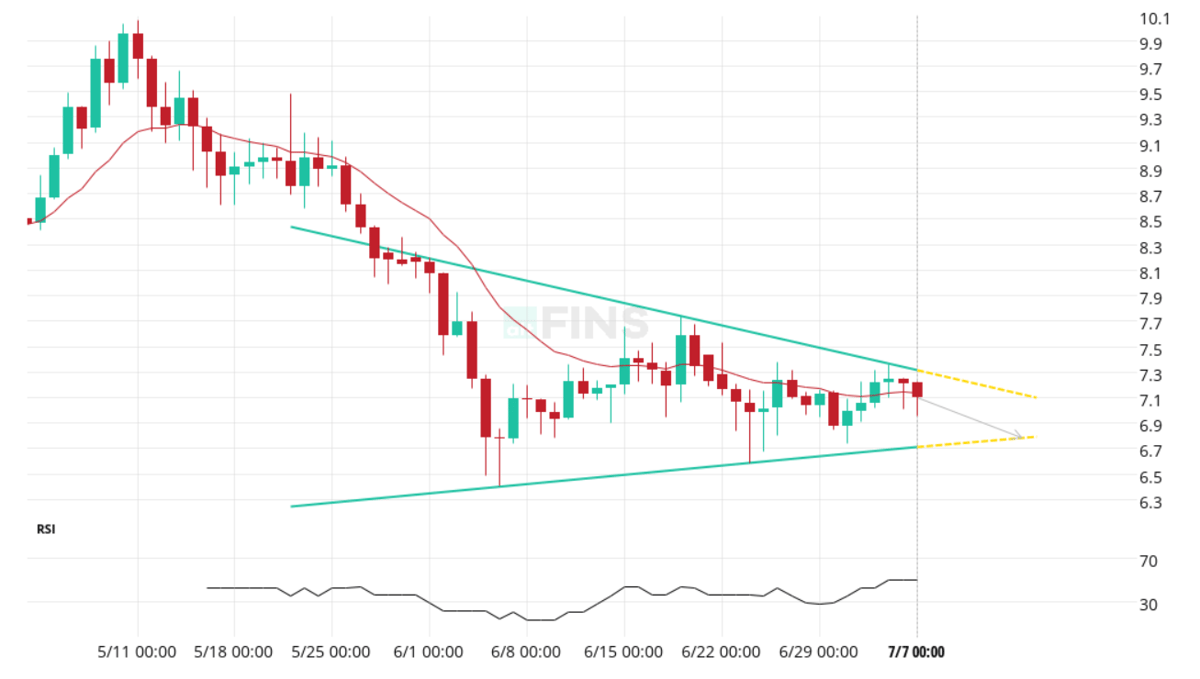
Example: Channel Up PatternSymmetrical triangles are bilateral — two converging trendlines that can break either direction. Traders wait for the breakout and trade in its direction, confirming with volume.
More Chart Pattern Types are found in this tutorial.
Example: Symmetrical Triangle PatternaltFINS flags patterns at two stages, and both are tradable. Emerging patterns are still forming; traders can enter between the support and resistance trendlines, which suits advanced and swing traders. Breakout (complete) patterns have a confirmed breakout — these carry higher profit potential and suit beginners and trend traders.
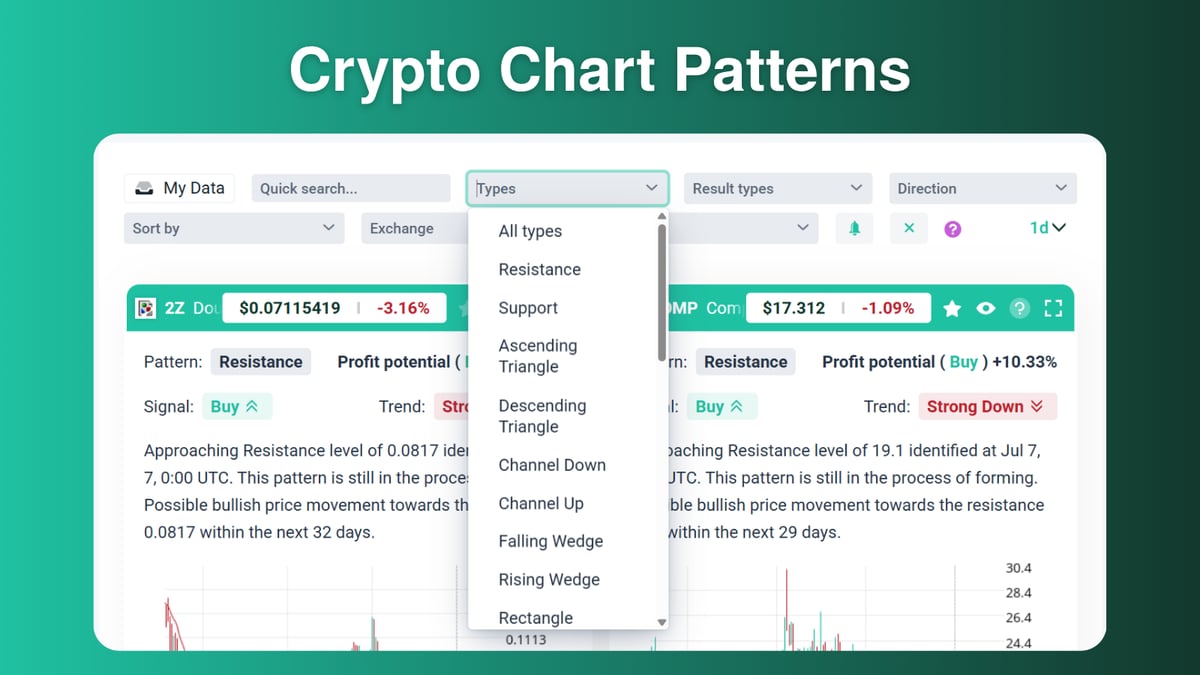
altFINS’ AI chart-pattern recognition engine scans the top 500 coins 24/7 and detects all 26 patterns across 4 timeframes (15m, 1h, 4h, 1d), saving traders hours of manual chart scanning. For each pattern it also calculates profit potential (distance from current price to the forecast target) and shows the historical success rate, so you can filter for only the highest-probability setups.
When patterns are removed: a pattern leaves the platform when it (1) hits its forecast target, (2) ages out after 5 candles, or (3) moves more than one standard deviation against the forecast (a busted trade) — giving a clear, rules-based exit framework.
Full walkthrough: 10 steps to trade crypto using chart patterns.

By altFINS team · Published and last updated