Technical analysis of ATOM, XEM, NEO, HT, DASH
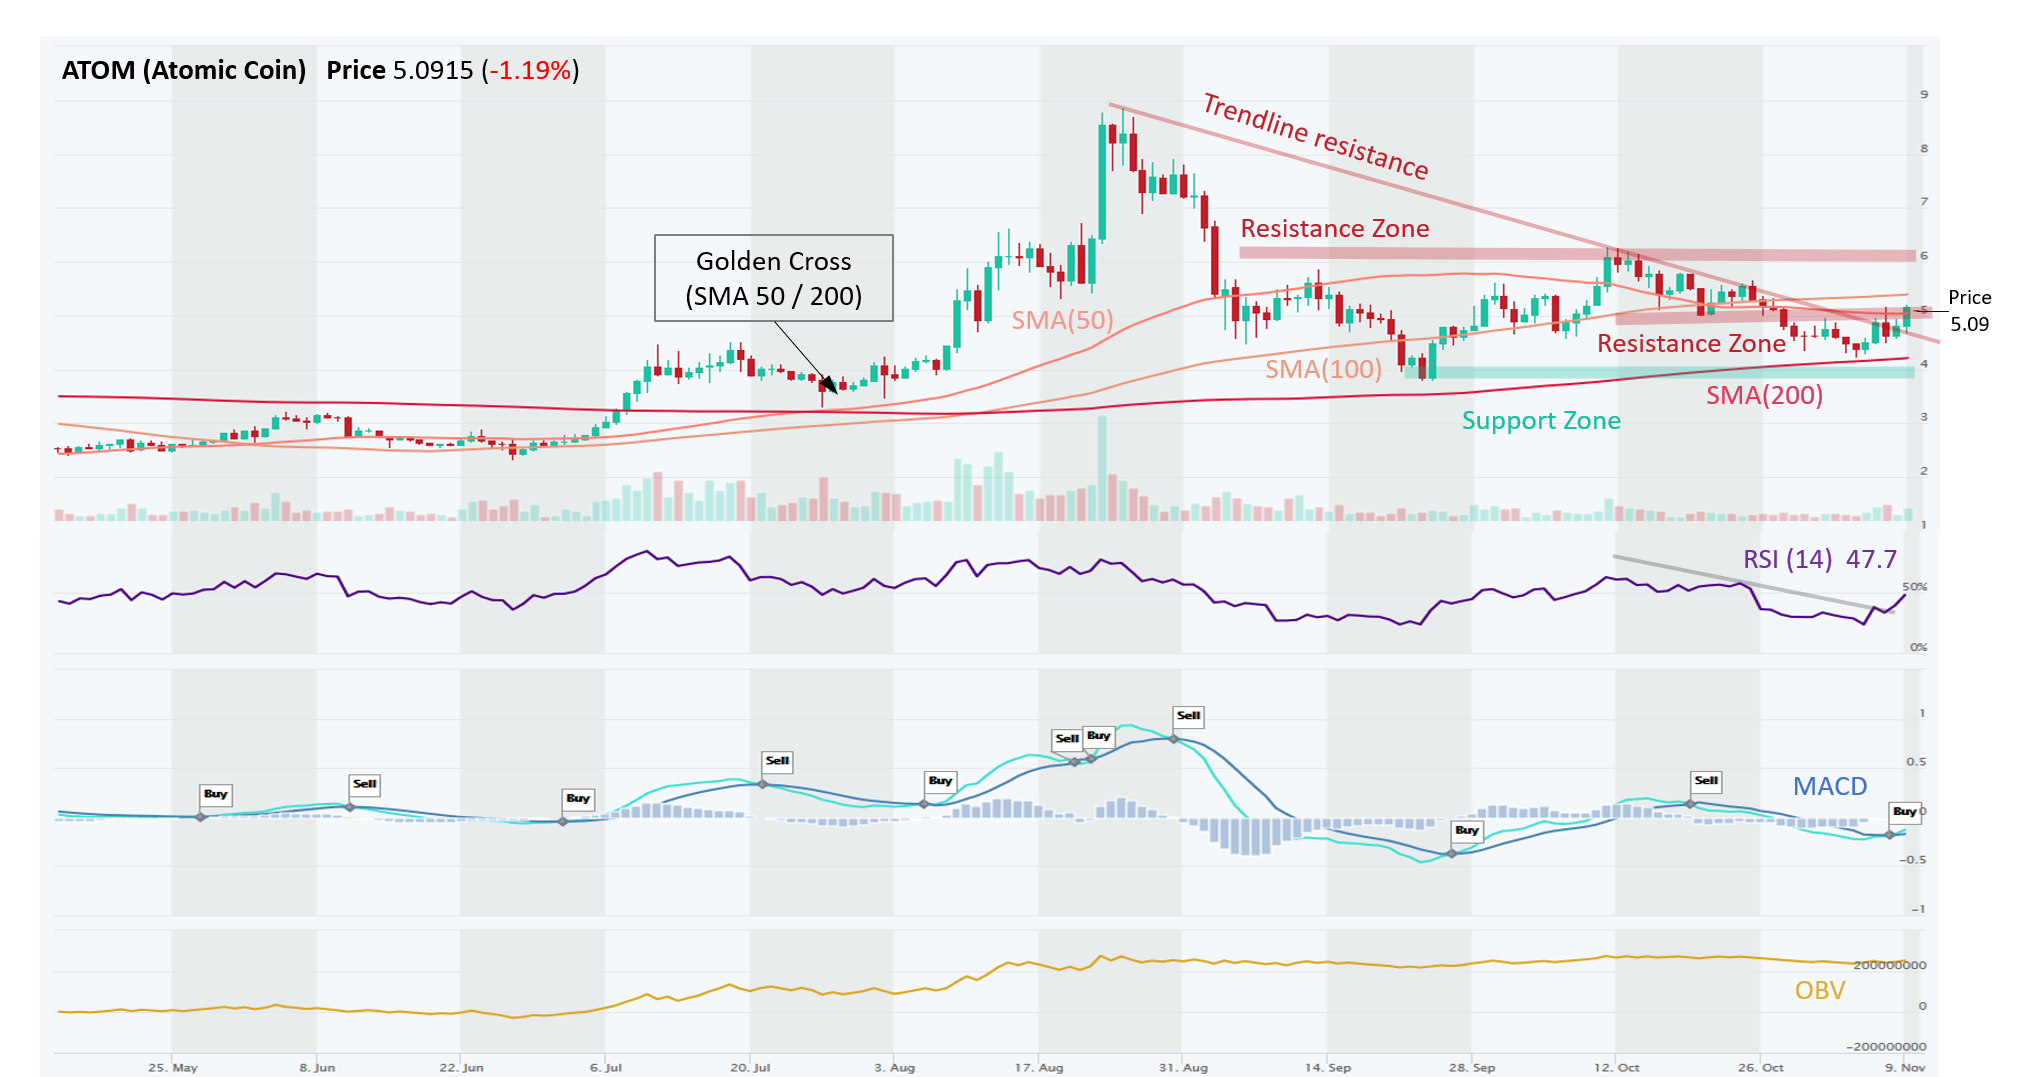
ATOM – Recent Price Gains and Bullish Momentum Were Built on Weak Volumes; Now Sitting on Resistance
ATOM (Atomic Coin) remains in a Long-Term uptrend, but Medium- and Short-Term trends are down. On the positive side: 1) ATOM broke upwards from Trendline resistance, 2) MACD (momentum indicator) flashed a Buy signal on November 8th, which adds to a near-term bullish outlook, and 3) RSI bounced from oversold levels and broke its downtrend, now approaching a bullish centerline crossover (above 50). On the negative side: 1) the recent price gains were not accompanied with strong volumes as indicated by flattish OBV (volume on Up days is lower than on Down days), 2) based on ADX indicator, the current trend is weak, and 3) ATOM is currently in Resistance Zone at ~ $5, which was previously support (TA principle called Polarity). Traders may want to wait for price to decisively break through the $5 resistance. If rejected, price could retreat to Support Zone at ~ $4. If it succeeds, the next Resistance is around $6.
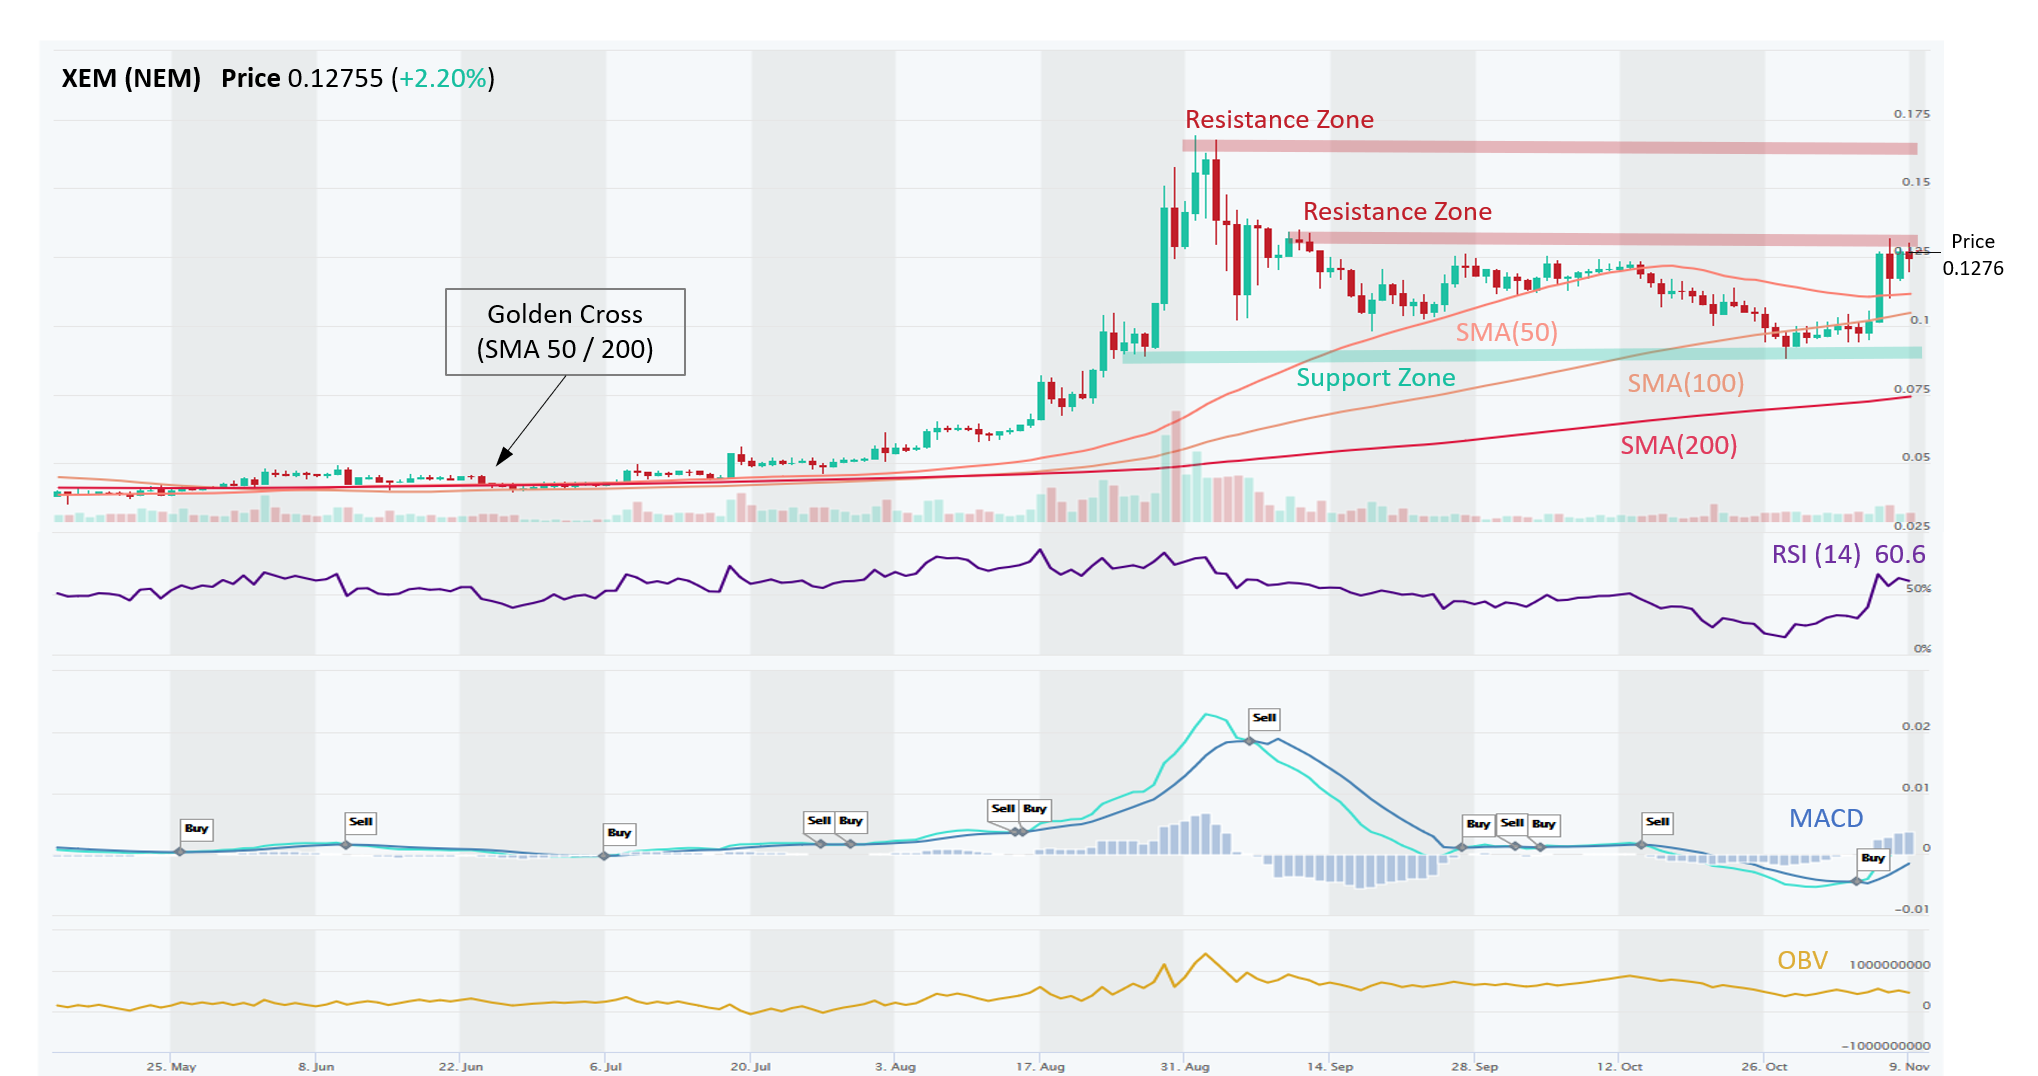
XEM – Solid Uptrend with Momentum; Will it be Enough to Clear Resistance at $0.13?
XEM (NEM) is in a solid Uptrend across all time horizons (Short-, Medium-, Long-Term). There are many positive things going for XEM. MACD and RSI are showing bullish momentum: 1) MACD posted a Buy signal on November 5th, and 2) RSI is trending upwards and is above 50 but not overbought yet. XEM also enjoys a healthy formation of its major SMAs, with SMA(50) above SMA(100) and SMA(200), and SMA(100) above SMA(200). Price is also above all major SMAs. Also, although not shown in the chart, the price has broken above its upper boundary of Bollinger Band, which is bullish. On the cautious side, OBV has recently trended downward or flattish, which means that recent price gains were not built on strong volume. XEM is also nearing Resistance Zone at ~ $0.13, which it failed to clear several times in September and October. Based on ADX, the trend strength is Neutral. Traders may want to wait for price to decisively break through the $0.13 resistance. If rejected, price could retreat to Support Zone at ~ $0.09. If it succeeds, the next Resistance is around $0.16.
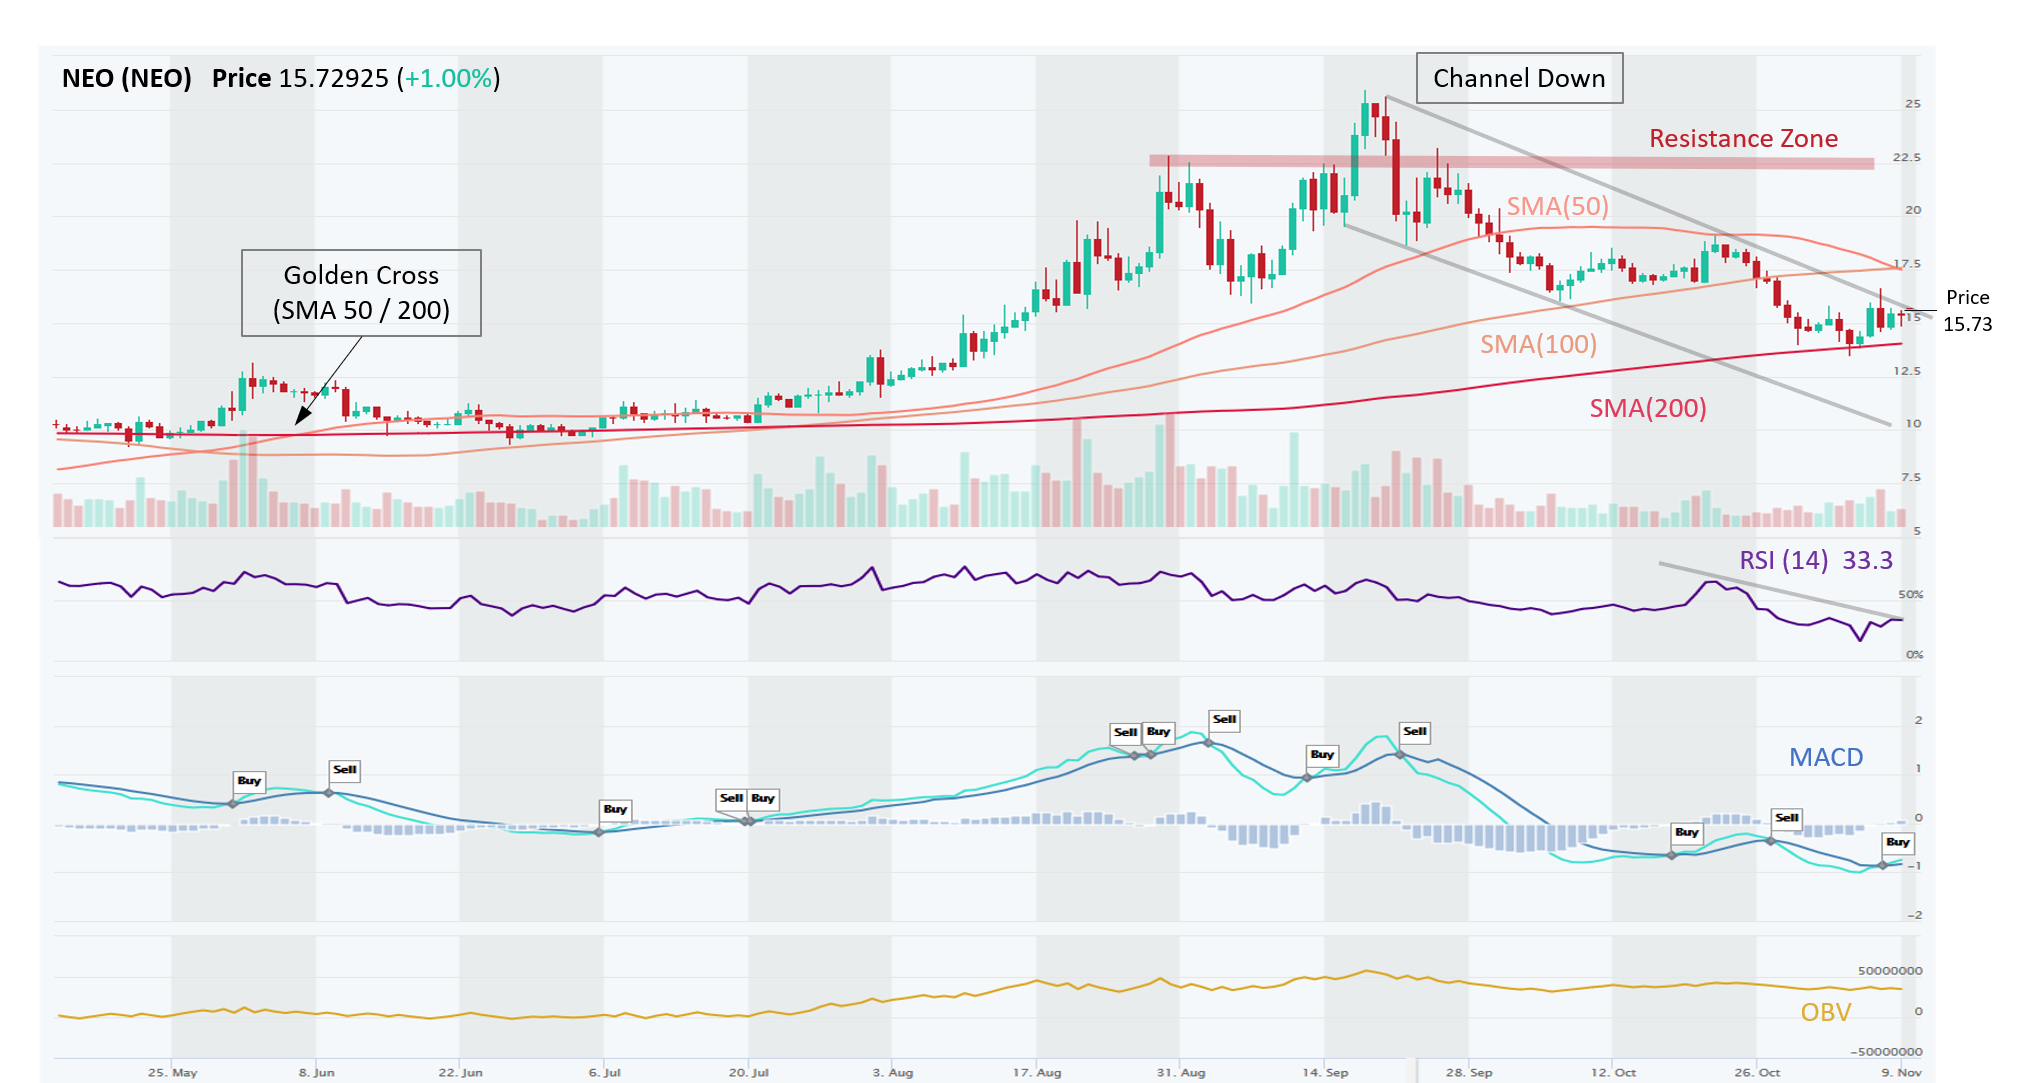
NEO – Trading in a Down Channel But Attempting a Break Above
NEO (NEO) has uncertain Long-Term trend (Neutral), while Medium- and Short-Term trends are down. This short and medium-trend bearishness can be seen in Channel Down formation, which started in mid-September. The way to trade channels is to Buy when the price is reaching channel support and Sell when the price is nearing channel resistance (Buy Support, Sell Resistance). Another way to trade channels is to wait for a break (Up or Down). Currently, the price is trading near channel resistance, which may indicate a possible sell. We can study other indicators to guide us, whether to trade within the channel, or wait for a channel break. RSI bounced from oversold levels, but is still trending downwards and is below 50, OBV is not increasing, which means Up days are not supported by higher volume than Down days. On the other hand, MACD posted fresh bullish signal on November 8th, which improves the outlook by a bit. ADX has a Neutral rating, which means current trend is neither strong nor weak, which could play well into narrative of bouncing within the channels.
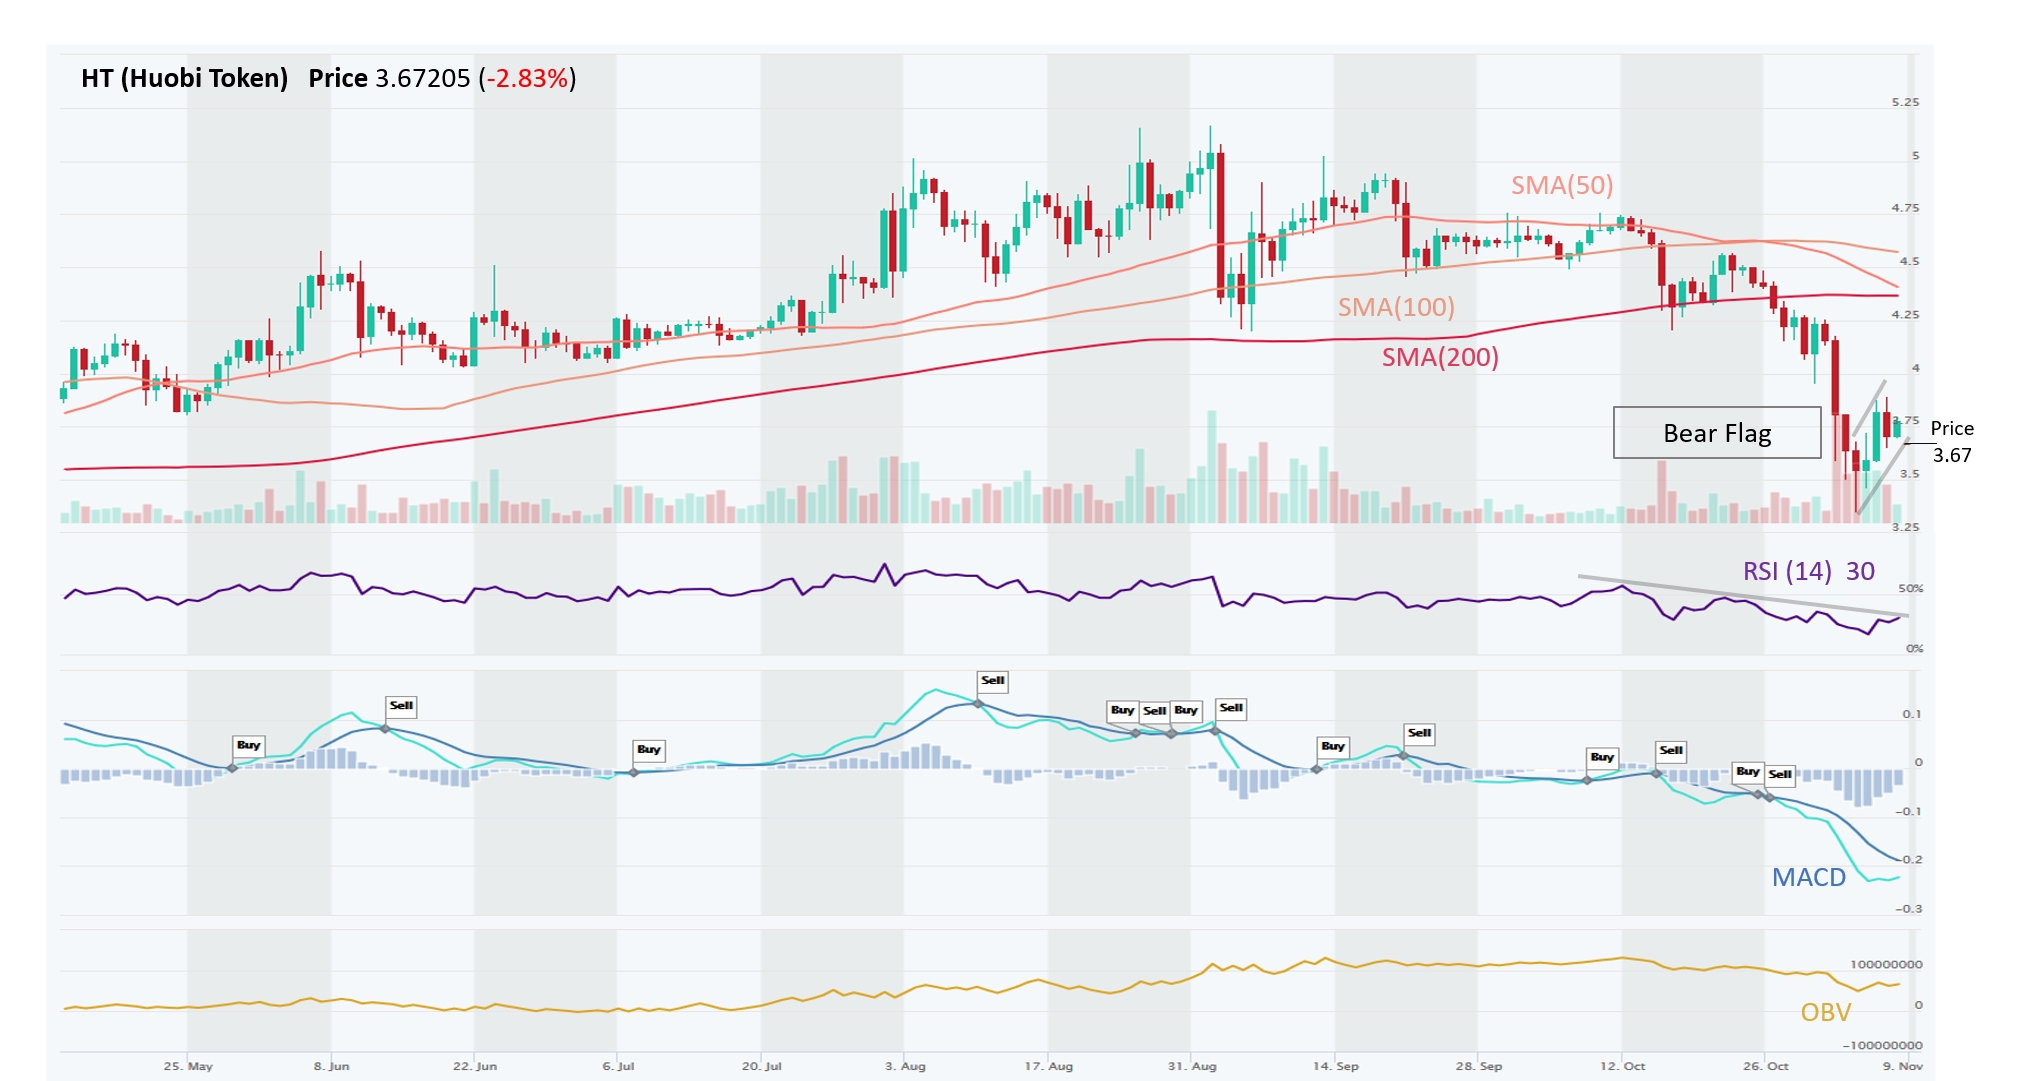
HT – Downtrend Likely to Continue Following a Bear Flag Formation
HT (Huobi Token) is trading down on all time horizons It is in Long-Term Downtrend, while Short- and Medium-Term are in more severe Downtrend. Is it time for a change of trend? Traders should be wary of other bearish signs of weakening demand including 1) a looming Death Cross as SMA(50) is approaching SMA(200), 2) MACD (momentum indicator) posted a Sell signal on 27th October, 3) and OBV is trending downwards (volume on Up days is lower than volume on Down days). Although RSI bounced from the oversold levels (now above 30), it is still under 50 and is also in a downtrend. What is very interesting is that the price action in recent days seems to resemble a Bear Flag formation. Bear flags are typically following a sharp decline and often indicates a small change in direction (or areas of consolidation) before the previous trend resumes. This may mean that this bounce was just a small consolidation before the down-trend continues. Traders typically expect to enter a flag on the day after the price has broken and closed below (short position) the lower parallel trend line.
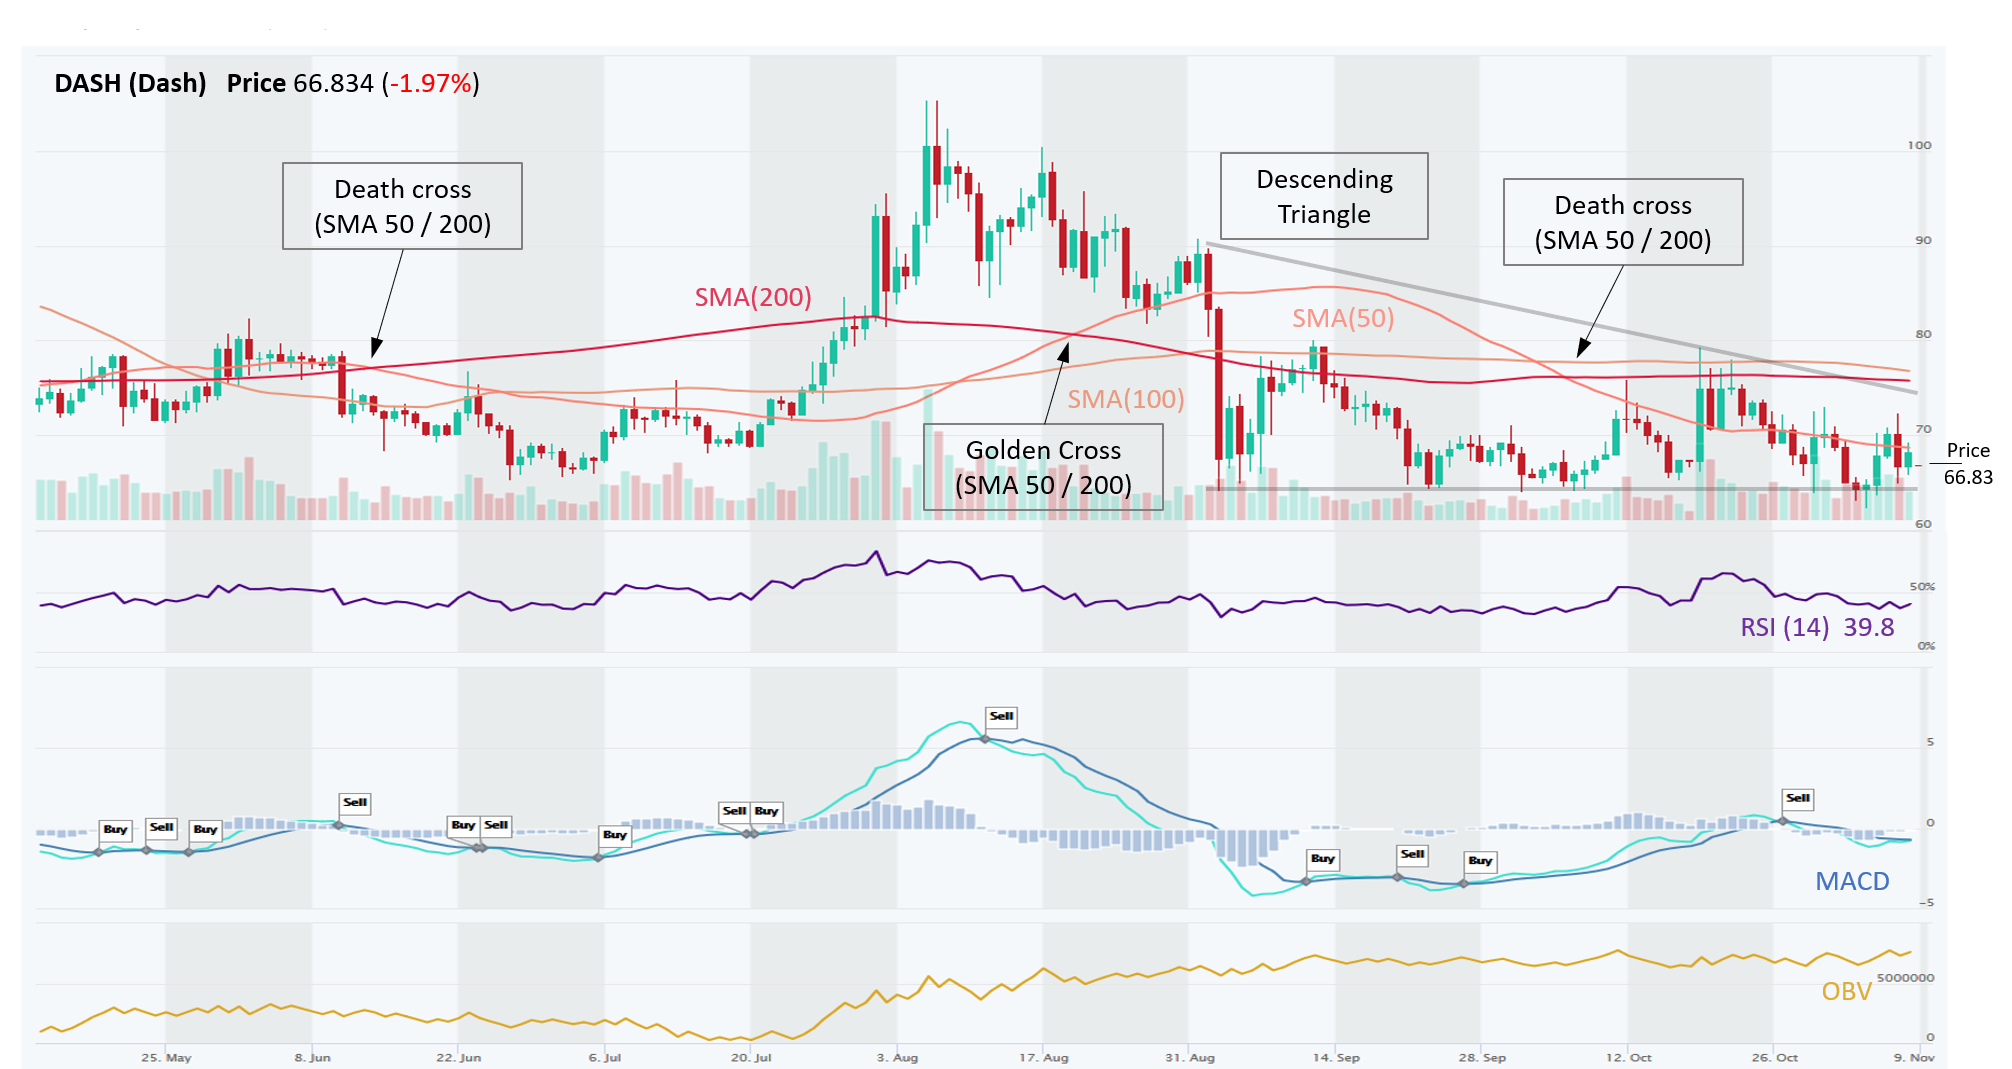
DASH – Descending Triangle Plus Other Bearish Signals Galore
DASH (Dash) is under pressure on all time horizons. It is in Long-Term Downtrend, while Short- and Medium-Term are in more severe Downtrend. In early September, the coin started to form a Descending Triangle pattern, which is typically a bearish formation. This pattern is still Emerging and we can look for clues in other indicators, whether this bearish pattern will indeed play out. In early October, the SMA 50/200 formed a Death Cross and MACD (momentum indicator) posted a Sell signal on 27th October. RSI is in downtrend and under 50, which is another bearish sign. On the other hand, DASH seems to have relatively strong support level at ~$65, which is holding since early September. OBV recently ticked upwards, but overall the coin has more bearish indicators, which may mean that descending triangle will play out in its typical fashion (down).
Risk management – Stop Loss and trade size. In all of these setups, traders should use Stop Loss orders to manage their downside risk, in case the trade goes against us, as it often will. Trading is about probabilities and even though these setups have a high win rate, one must be prepared to minimize losses on the trades that go bust. If Stop Loss order types are not supported by they exchange, at least set up a price alert (see video). Also, trade size should be such that you never risk losing more than 2% of your total equity. Keeping the trade size small allows the trader to setup a wider Stop Loss, which gives the trade more room and time to complete with success. Setting Stop Loss levels too tight can often result in getting knocked out of a trade prematurely.
Disclaimer: This content is for informational purposes only, you should not construe any such information or other material as investment, financial, or other advice. There are risks associated with investing in cryptocurrencies. Loss of principal is possible.