Axie Infinity (AXS) Analysis
Axie Infinity (AXS) Analysis
In addition to automated chart patterns, altFINS’ analysts conduct technical chart analyses of top 30 cryptocurrencies. We call these Curated Charts and they evaluate 5 core principals of technical analysis: Trend, Momentum, Patterns, Volume, Support and Resistance.
Axie Infinity (AXS) technical analysis:
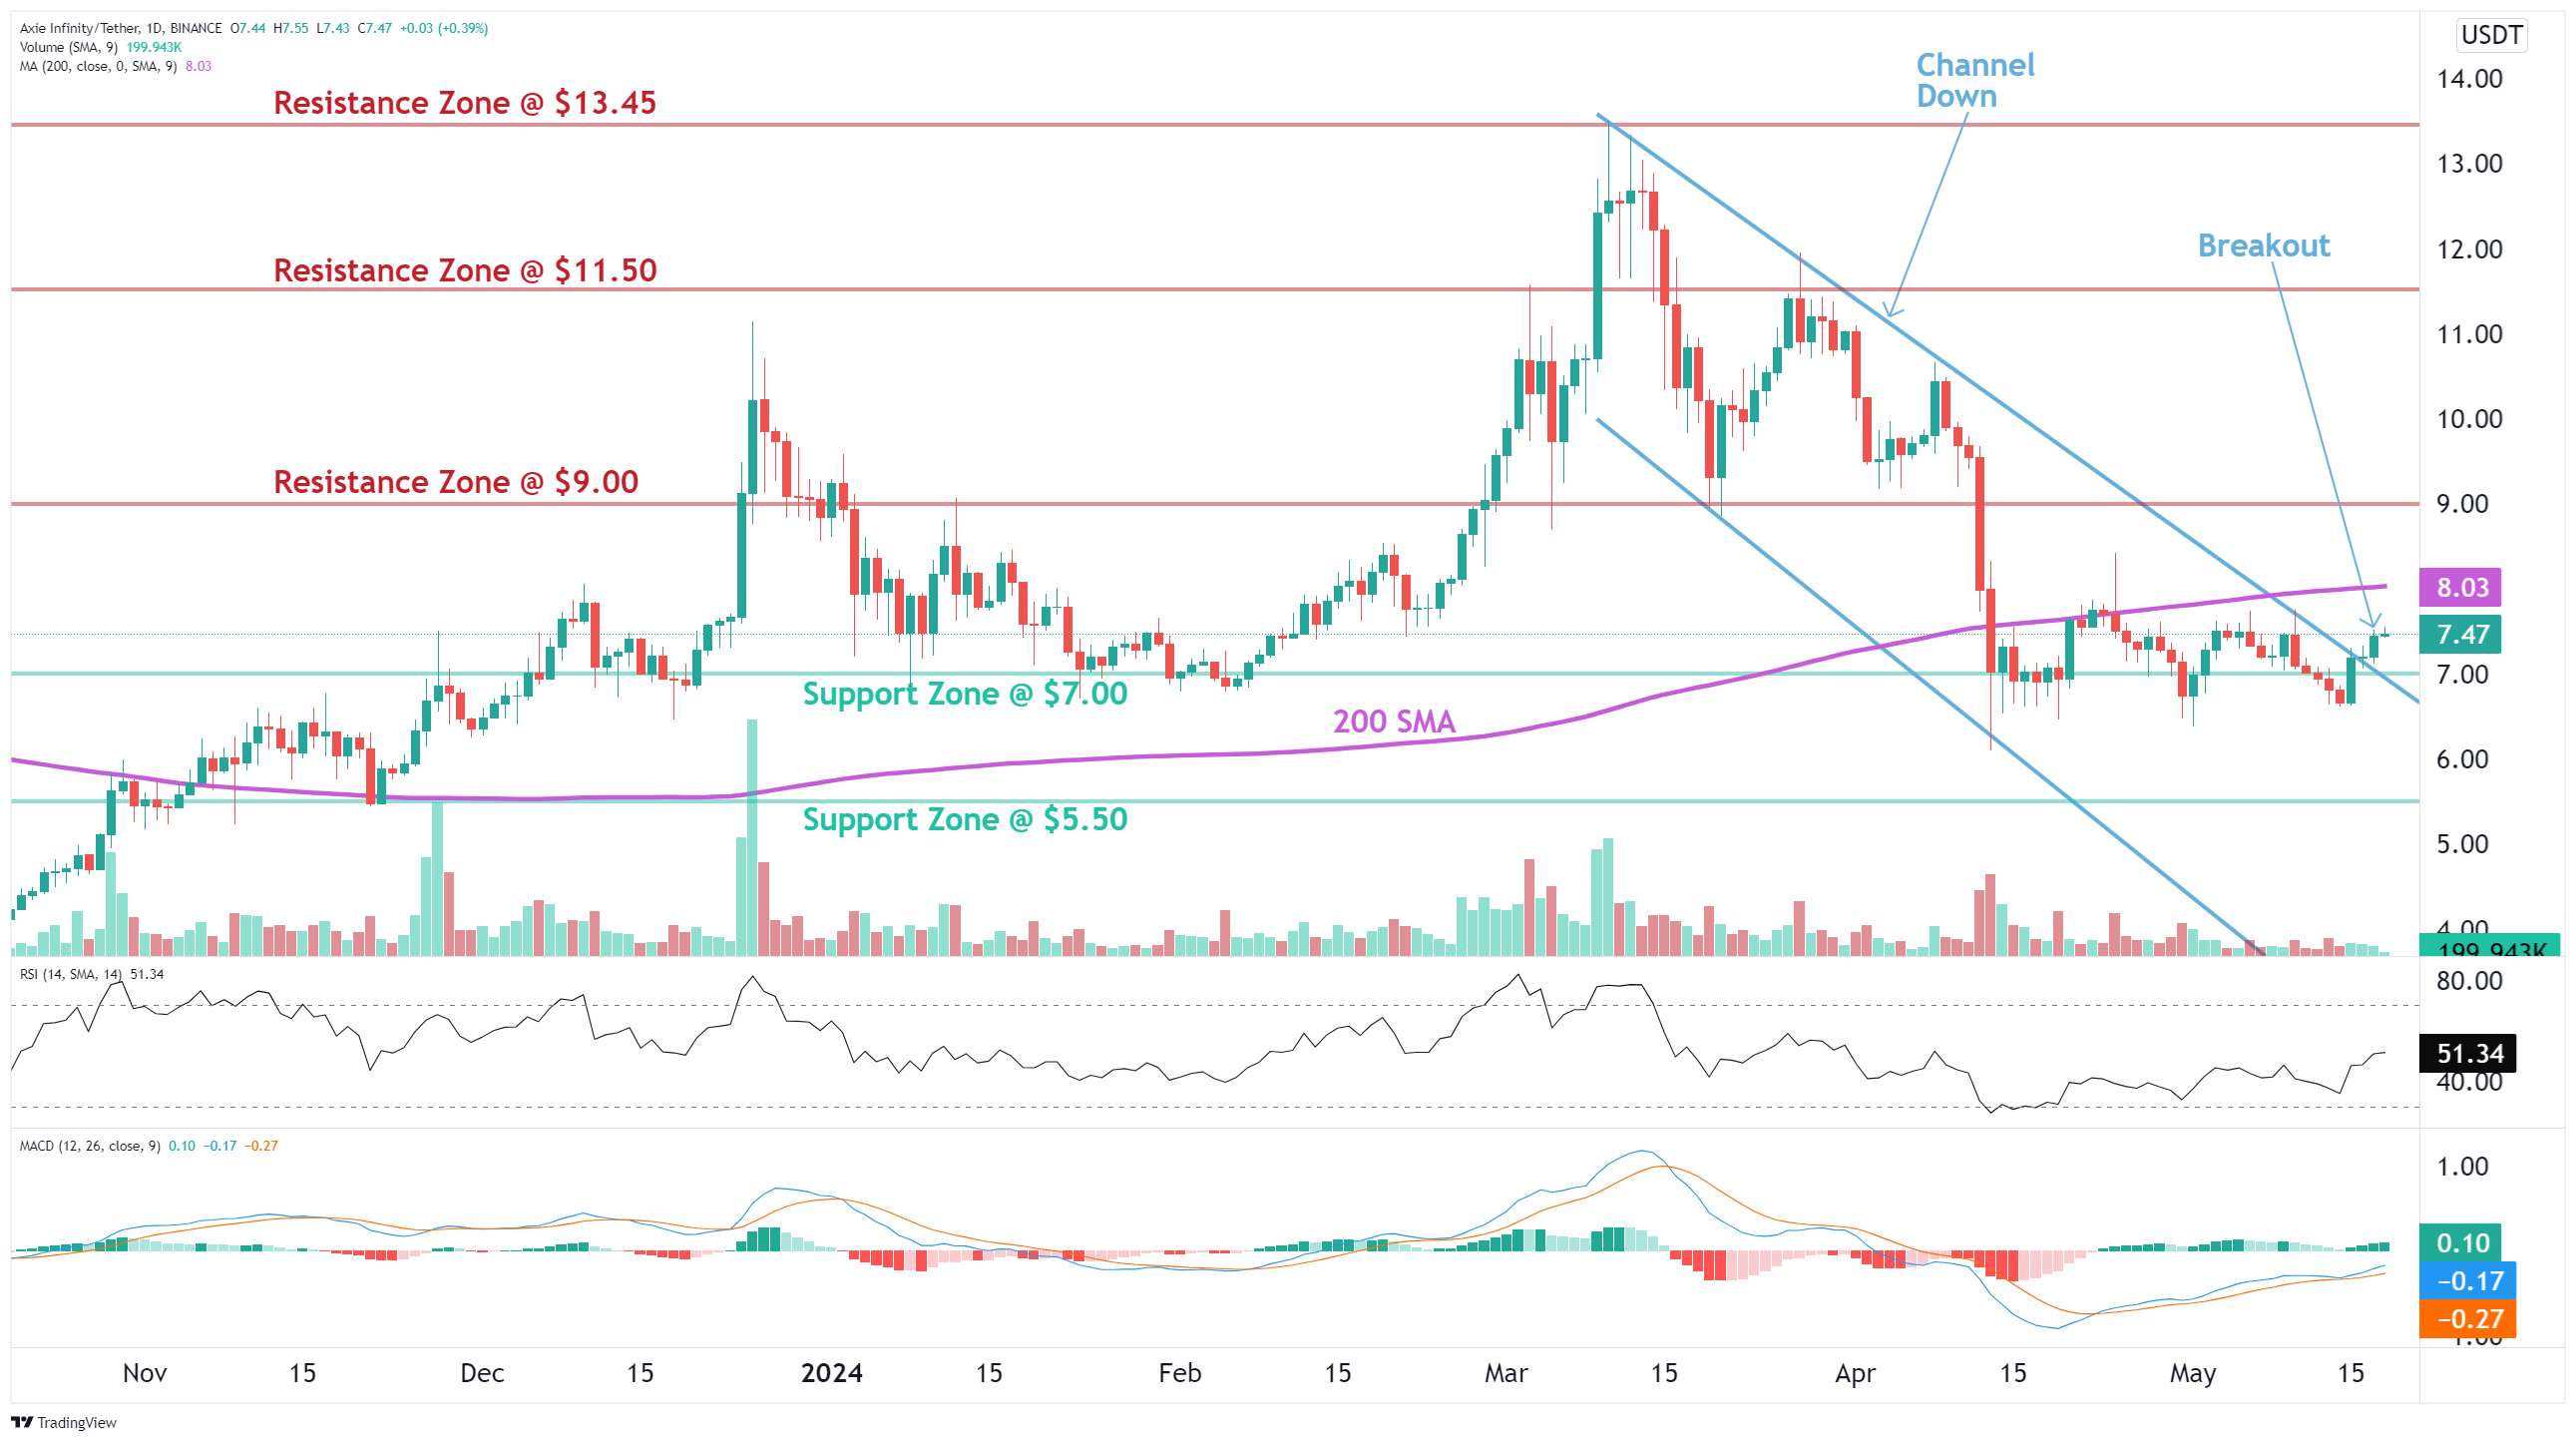
Trade setup: Price is in a downtrend. It broke out of a Channel Down pattern, however, there are two resistance areas just above it: 200-day moving average (~$8) and horizontal resistance ($9). (set a price alert).
Pattern: Price was trading in a Channel Down pattern. With complete patterns (i.e. a breakout) – initiate a trade when the price breaks through the channel’s trendlines, either on the upper or lower side. When this happens, the price can move rapidly in the direction of that breakout. Learn to trade chart patterns in Lesson 8.
Trend: Neutral on Short-Term basis and Downtrend on Medium- and Long-Term basis.
Momentum is Mixed as MACD Line is above MACD Signal Line (Bullish) but RSI ~ 50 (Neutral).
Support and Resistance: Nearest Support Zone is $7.0, then $5.5. The nearest Resistance Zone is $9.0 (previous support), then $11.5, and $14.0.
See live Axie Infinity (AXS) chart here
Read more curated charts of coins with technical analyses.
Recent news and research:
Axie Infinity to start reimbursing Ronin bridge hack victims from June 28
Axie Infinity to Release Land Gaming Mode in Bid to Maintain Dominance
DeFi Kingdoms Challenges Axie Infinity’s GameFi Supremacy with NFT Play
Axie $150M Raise, BoA Crypto Research, SEC Subpoenas USDC, India’s Crypto Market, Crypto PAC Rumor
NFT trading game Axie Infinity launches AXS staking program
Axie Infinity Revenue Jumped Another 85% in August
Axie Infinity Has Beaten Even Ethereum in Network Fees Thanks to its Sidechain
After Axie Infinity’s 800% Rise, Crypto Analyst Looks at What’s Next
Axie Infinity Goes Against The Trend, How It Hit New ATH In The Past Week
Axie Infinity Economy Booms as NFT Sales Rise
Find more real-time news here.