Momentum measures the strength and speed of a price move, showing how quickly price is changing in either direction. Positive momentum signals strong buying pressure; weakening momentum often precedes a trend reversal or consolidation. Indicators such as RSI and MACD are the most common momentum tools.
How altFINS uses it: momentum indicators, including the proprietary MACD Histogram H1/H2 signals, are built into every analyst trade setup to confirm trends and spot reversals early.
Volume is the total amount of a cryptocurrency traded in a specific time frame. High volume confirms that a price move is reliable; low volume increases volatility and weakens signals. Volume is also used to validate breakouts, breakouts on rising volume are significantly more dependable.
How altFINS uses it: analysts check the OBV (On-Balance Volume) indicator on every breakout call before classifying a setup as actionable.
Chart Patterns are recognizable formations created by price action that signal potential future moves. They include reversal patterns, continuation patterns, and support/resistance structures. altFINS’ AI automatically recognizes 26 common patterns, including Ascending/Descending Triangles, Rising/Falling Wedges, Channels, Head & Shoulders and breakouts.
How altFINS uses it: AI Chart Patterns are screened continuously across the top 500 coins on 4 intervals (15m, 1h, 4h, 1d) and each pattern’s historical performance is tracked and published.
Support is a price level where demand is strong enough to stop a decline, a floor. Resistance is where supply stops a rise, a ceiling. These levels give traders concrete entry and exit points. Once support breaks, it becomes resistance, and vice versa.
How altFINS uses it: every Technical Analysis lists the major support and resistance zones for the coin, so entries and exits are pre-defined.
altFINS automated support and resistance for all 2,000 coins.
Dow Theory is the foundational framework of technical analysis, developed by Charles H. Dow, co-founder of Dow Jones & Company, in the late 19th century to explain how market prices move in trends. Its six core principles:
Why it matters for crypto traders: Dow Theory gives crypto traders a disciplined framework for identifying real trends, confirming them with volume, and avoiding premature exits in volatile markets.
Technical analysis is powerful but not infallible. Crypto traders should understand its ten main limitations:
To reduce TA risks, combine it with fundamental analysis, follow market news, set clear risk-management rules, and avoid over-trading. altFINS supports this with Research reports (valuation metrics for DeFi, L1, L2 and DEX projects), fundamental and on-chain data filters, Coin Picks (projects with working products, growing adoption and large TAM) and Macro reports covering drivers like inflation and interest-rate expectations.
altFINS’ analyst team maintains Technical Analyses with actionable trade setups for 55+ major coins, each clearly marked Bullish, Bearish or Neutral. Every analysis shows the date, asset symbol, near-term outlook, pattern type and pattern stage (breakout or emerging). Filter by outlook, pattern type or stage, then drill in for support/resistance zones, momentum indicators and the recommended action. Technical Analyses are also available inside the Screener, see what kind of crypto trading signals are on altFINS and the step-by-step getting-started guide.
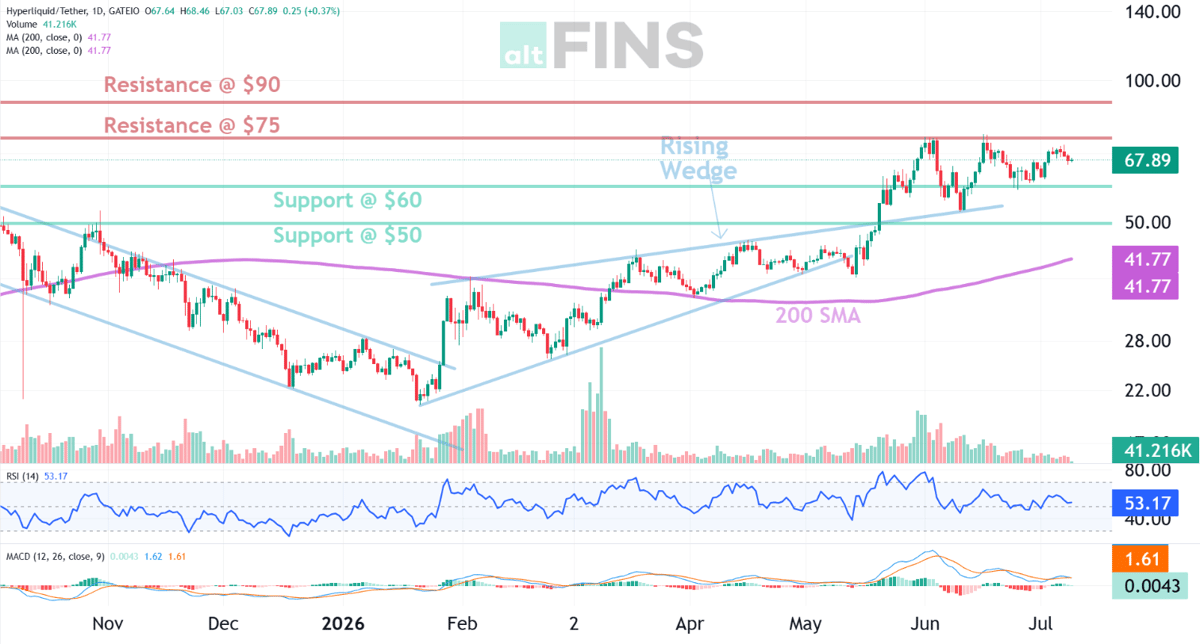
Example of HYPE Technical Analysis

By altFINS team · Published and last updated