Crypto bear market? How to trade it?
Are we in a crypto bear market? By official count, yes. Bear markets are typically defined as a 20% decline from top and are accompanied by general bearish market sentiment.
Bitcoin is down 40% (at $38K) from the top and Bitcoin sets the tone for the rest. Sure, there will be exceptions, but it’s hard to see the broad crypto market rally without Bitcoin’s leadership.
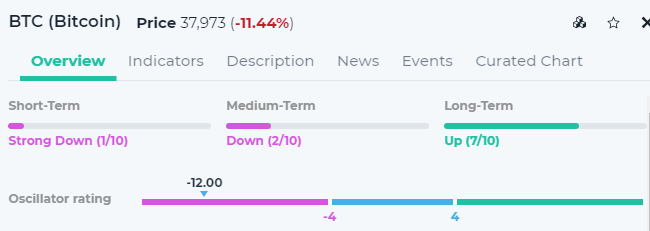
Based on our trend rating system, Bitcoin price trend is on a downward trajectory on a Short- and Medium-term basis, though still in uptrend on Long-term basis.
It is also very oversold (see Oscillator rating and also RSI (14) at 28.2) and overdue for bounce up.
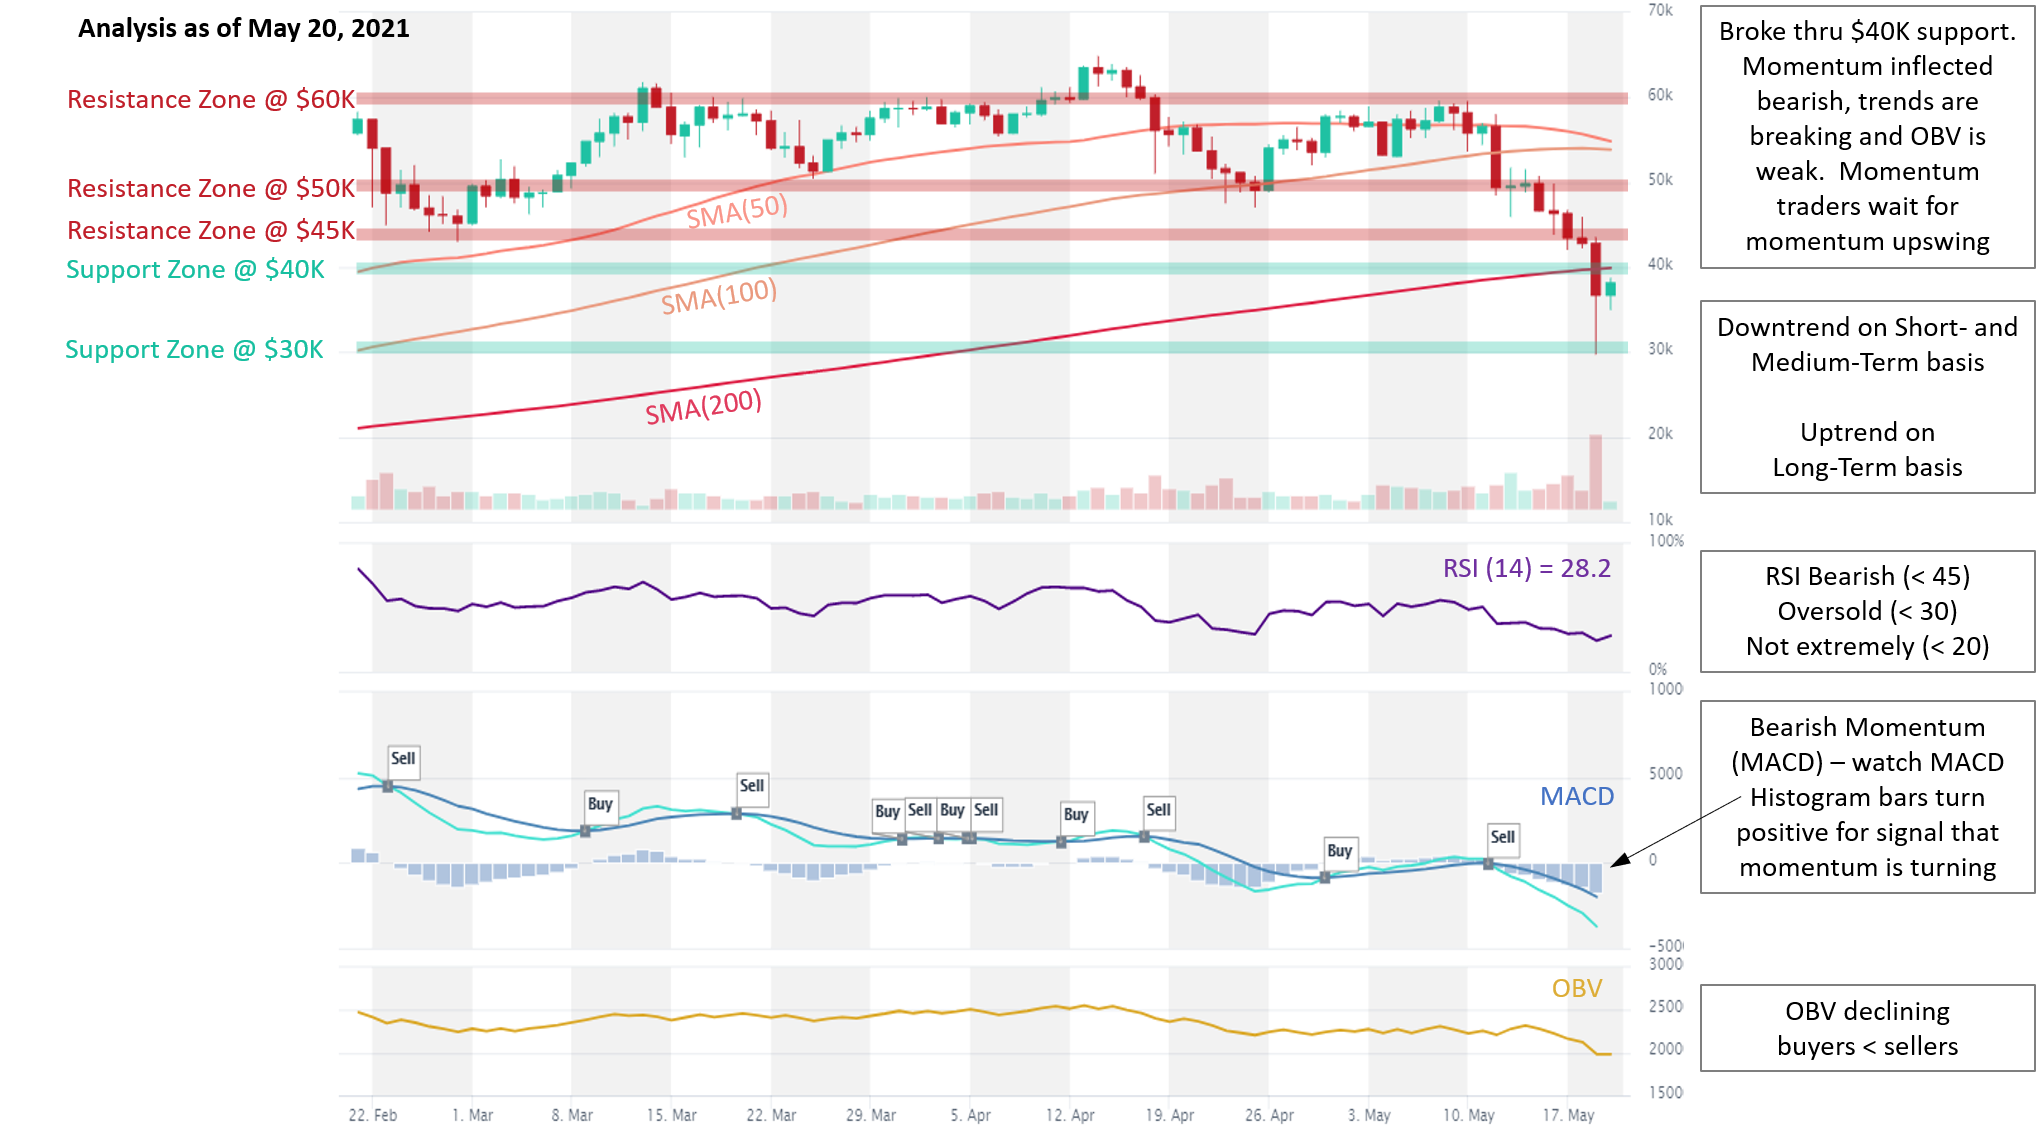
Source: altFINS Curated Charts
We could debate the reasons for the recent trend reversal (Elon, environmental impact, overly optimistic sentiment, China’s crackdown on miners, etc.) but there’s no point. Technical Analysis and trading do not pontificate the reasons. Price action gives us sufficient clues and evidence.
Let’s focus on what to do next.
Trading strategies should adopt to the environment, which clearly has switched from bullish uptrend to bearish downtrends (i.e. crypto bear market), in general.
Here’s our view on what traders could do:
- Buy dips and try to time the bottom.
- Wait for prices to stabilize and watch for momentum upswing.
- Use Patterns for swing trading.
- Find Patterns with bullish breakouts.
- Use Patterns signals to Buy and Short Sell – market neutral portfolio.
1. Buy dips and try to time the bottom. Buying dips works well in an uptrend. Traders can find coins in an uptrend on our Signal Summary page. Currently, we can see 94 coins in an uptrend (Short-, Medium-, Long-Term) on a daily (1D) time interval. Notice that we also see 142 coins in a downtrend. Clearly the market is generally in a downtrend now, except on a Long-Term basis.

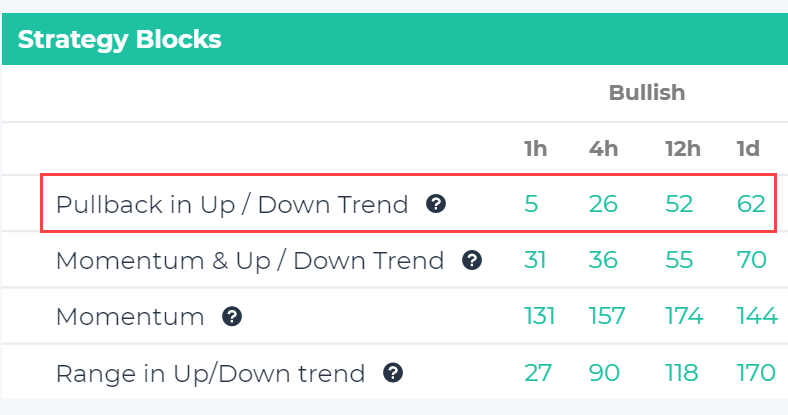
So to buy the dips, traders can use our pre-defined filter: “Pullback in Uptrend”, also on the Signals Summary page, which will screen the market for coins that are still in an Uptrend (Short- Medium- and Long-term), have bullish momentum (MACD, RSI) but are down today.
Currently, it appears there are 62 coins that fit this filter criteria on a daily (1D) time interval.
Watch this video on how to adjust this screen to find coins that are at least 10% down in the last 1D (you can use any %).
The risk with buying the dips is if they turn out not to be just dips and more like catching a falling knife. Especially in a broadly downtrending market, this risk is heightened.
Alternatively, traders could screen for extremely oversold coins that could have a bounce up. RSI indicator is commonly used to identify oversold conditions. Traders can create a custom filter that screens the market for coins that are extremely oversold (RSI < 25) but are still in a Long-Term Uptrend. (watch video tutorial). Ideally, find situations where price is near a support area.
2. Wait for prices to stabilize and watch for momentum upswing. Don’t fight the tape. Don’t guess where the bottom will be. Let the market tell us, watch the price action.
Perhaps the roaring uptrend is over with and this will become truly a trader’s market, particularly a Swing trader’s market. While Trend traders try to catch a trend and ride it, Swing traders are looking to enter on momentum upswing and exit when momentum loses steam.
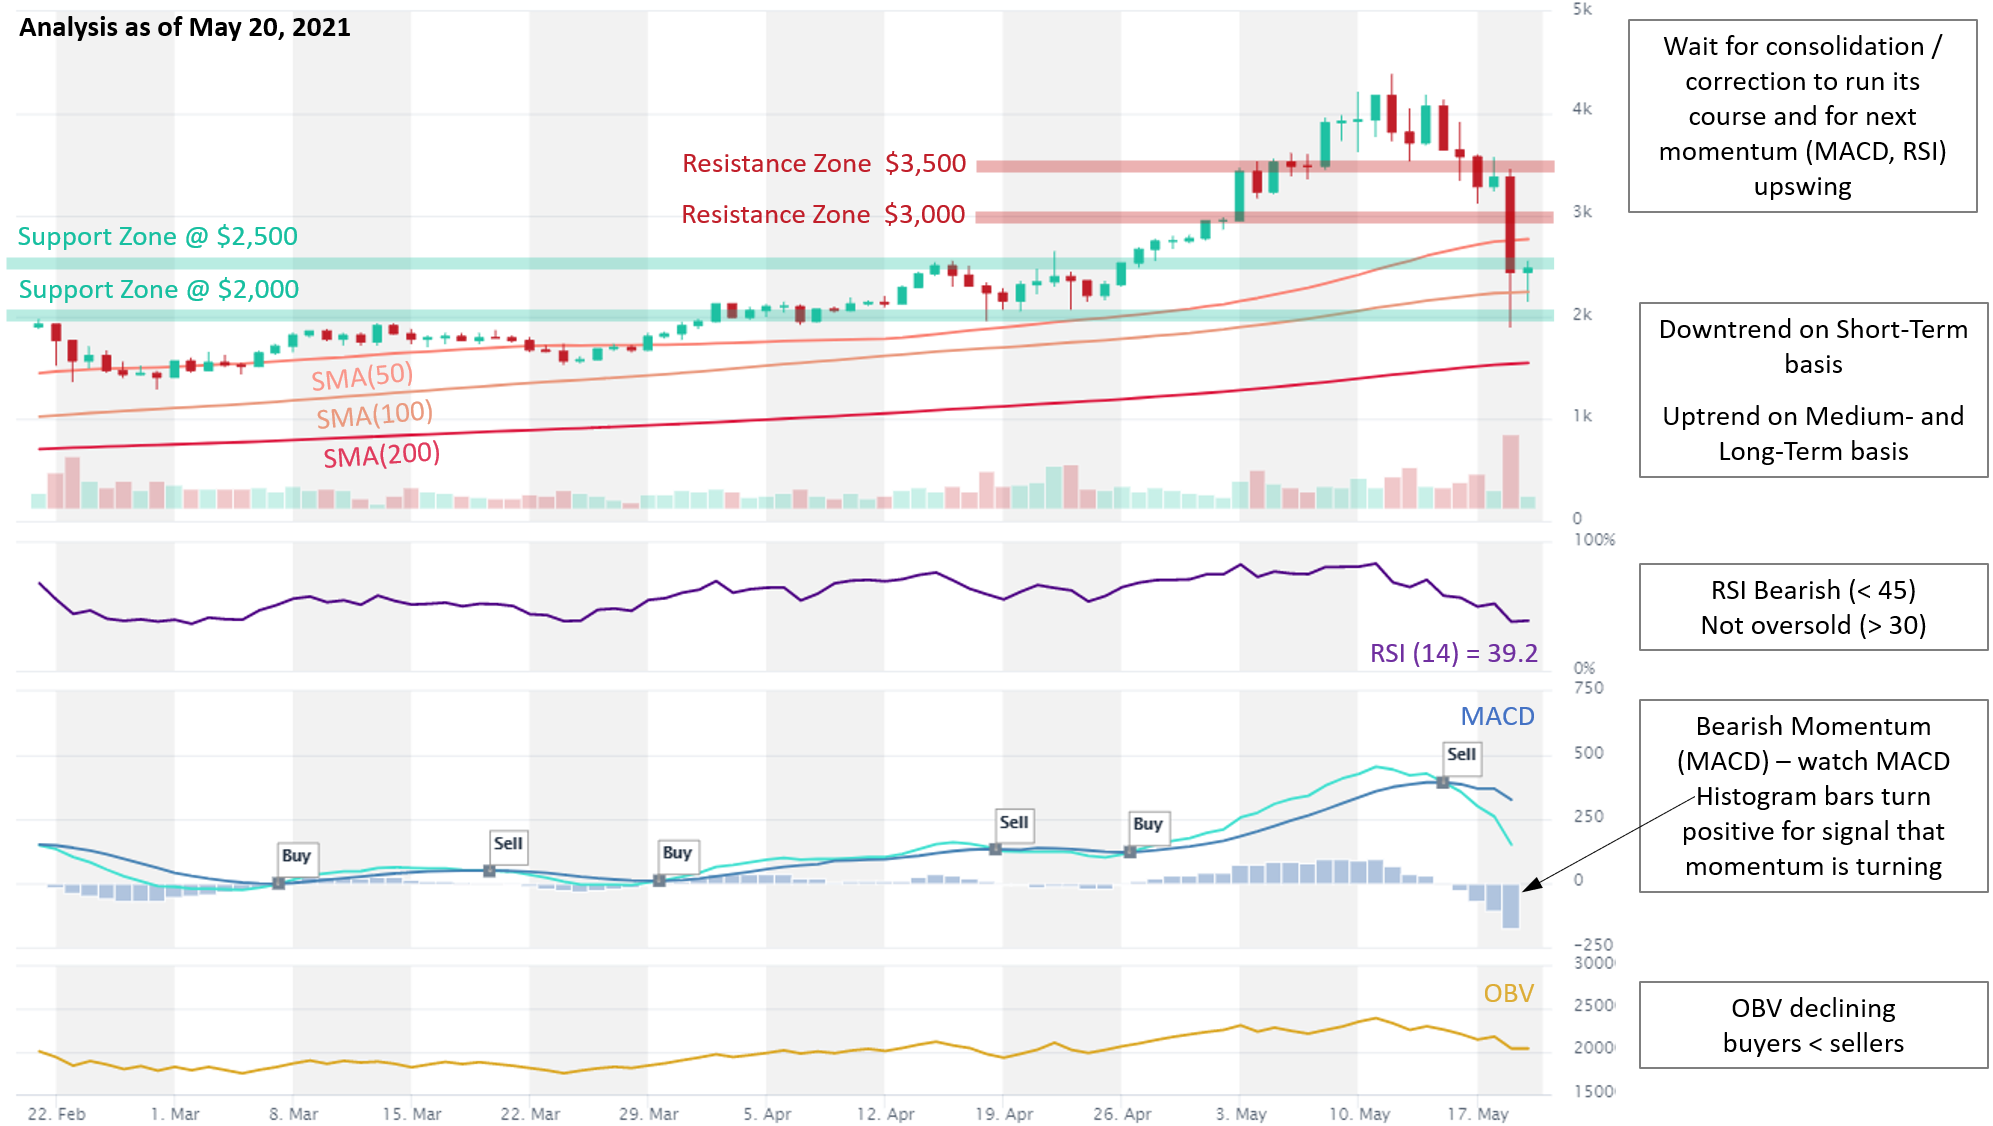
Prices tend to swing up and down, even when they trend (up or down). Notice the up and down swings in the LINK chart below. One of the best momentum swing indicator is MACD. altFINS show Bullish (Buy) and Bearish (Sell) MACD crossovers in the charts:
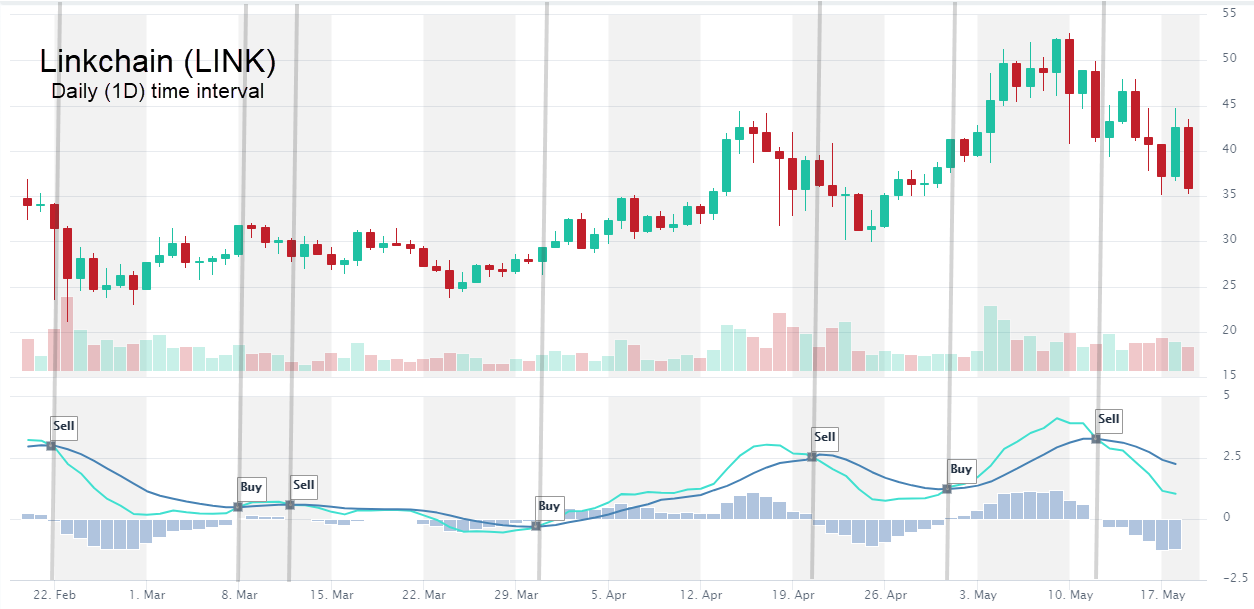
MACD is not perfect. There will be times when it totally whipsaws (frequent changes in Buy/Sell signals) and loses money. But in general, it’s a great momentum indicator that can be used by Swing and Trend traders alike.
It will not pick the bottoms or the tops, but it helps avoid big loses and helps enter on established momentum.
Watch a video tutorial on how to create a MACD crossover signal for a specific coin (ADA example – 2nd video on the list).
In fact, MACD is often a canary in the coalmine, in that it helps warn a trader of potential downturn. See below how it would have helped prevent a big drawdown in Ethereum from $3,500 to $2,500:
You can quickly screen the market for coins with Bullish momentum using the Signal Summary page:
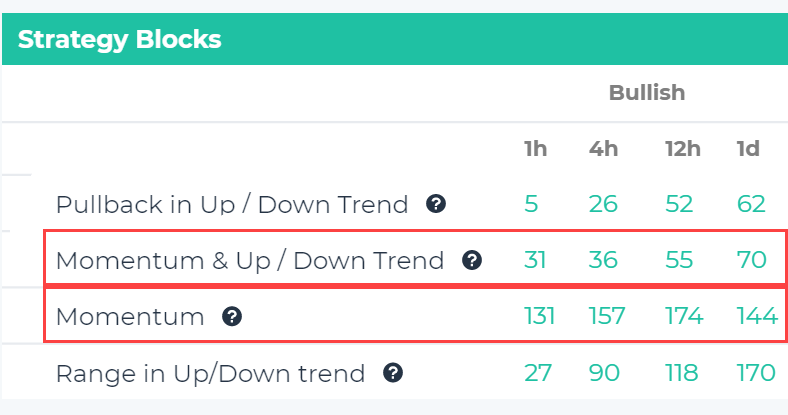
In the above table, there are two pre-defined market screens:
- Momentum & Uptrend – finds coins that have a bullish momentum (MACD, RSI) and are in an Uptrend.
- Momentum – finds coins that have bullish momentum, regardless of trend direction.
3. Use Patterns for swing trading. Traders can use altFINS’ automated chart pattern recognition to identify swing trading opportunities that can be used even in a crypto bear market.
Just filter Patterns by result type for Emerging and by pattern type for either of these patterns which have the highest success rates (~ 70%): Horizontal Resistance, Ascending or Descending Triangles, Channel Up or Down, Falling or Rising Wedge.
We’ve recently added easy sorting features to our Patterns page.
Watch this video on how to navigate the Patterns page and how to make the most use of these crypto signals.
4. Find patterns with bullish breakouts. Traders can use altFINS’ automated chart pattern recognition to identify bullish or bearish breakouts that also occur during a crypto bear market.
We recommend looking for the following pattern types, which have the highest success rates (~ 70%): Inverse Head and Shoulders, Horizontal Resistance, Ascending or Descending Triangles, Channel Down, Double Bottom, Triple Bottom, Falling Wedge.
We’ve recently added easy sorting features to our Patterns page.
Watch this video on how to navigate the Patterns page and how to make the most use of these crypto signals.
5. Use Patterns signals to Buy and Short Sell – market neutral portfolio. Traders can use altFINS’ automated chart pattern signals to go long (Buy) and short (Short Sell) cryptocurrencies. This way, they’ll have a relatively market neutral portfolio – balanced portfolio of Long and Short positions. Hence, if a market moves dramatically in either direction, the investor will benefit on one side at least. If market drops by 20%, then the traders’ Short book should have big gains that should offset loses in his Long book.
