Is crypto getting ready to rally again?
In today’s video, we provide a market update and analyze charts of BTC, ETH and LUNA.
BTC is in an Ascending Triangle, ETH in a Symmetrical Triangle, and LUNA is a “pullback in uptrend” trading opportunity.
Our CEO also discusses his cautiously optimistic near-term view for crypto assets.
Two key risks going into 2021 were 1) regulation, and 2) FED interest rates.
Last week the Biden administration issued an executive order asked various regulatory agencies to further coordinate, and to focus on stablecoins near term. Nothing scary or earth shattering.
Then, on Wednesday, FED raised interest rates, as expected, by 25 basis points and market expects 6 additional 0.25% increases this year.
So with these two major risks behind us and priced into valuations, we saw equity and crypto markets rally a bit and could continue to recover during rest of 2022.
In fact, as we discuss in the video today, crypto asset prices have begun to move sideways and in some cases signal trend reversals.
Today, we also share a couple of trading ideas from our Curated Charts and Automated Patterns sections.
Ethereum (ETH) price analysis: Bullish
Pattern type: Symmetrical Triangle
Pattern Stage: Breakout
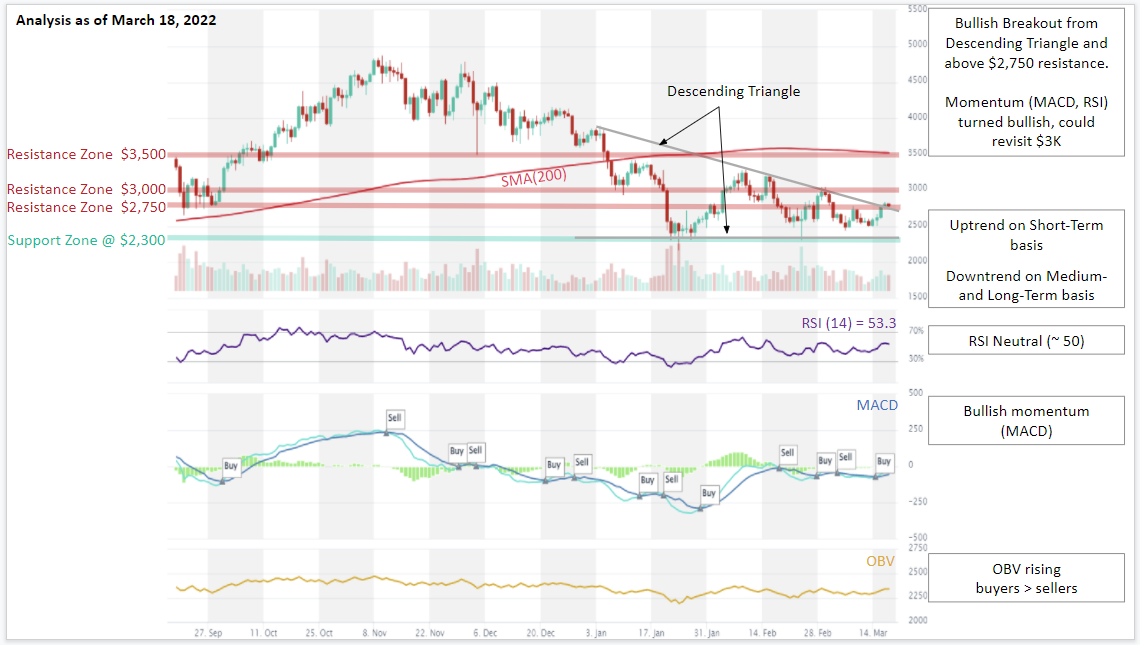
Trade setup: Bullish Breakout from Symmetrical Triangle and above $2,750 resistance. Momentum turned bullish (MACD Signal Crossover and RSI above 50 centerline). Price could revisit $3,000 resistance.
Trend: Uptrend on Short-Term basis and Downtrend on Medium- and Long-Term basis.
Momentum is Mixed as MACD Line is above MACD Signal Line (Bullish) but RSI ~ 50 (Neutral).
OBV (On Balance Volume):is rising, indicating that volume on Up days is greater than volume on Down days. Hence, demand (buyers) exceeds supply (sellers).
Support and Resistance: Nearest Support Zone is $2,300. The nearest Resistance Zone is $2,750, which it broke, then $3,000 and $3,500.

