Alert for the 200-Day Moving Average Breakout

Today, we’re diving into a trade setup for Helium (HNT) and exploring how to set up alerts for a price breakout above the 200-day moving average. But before we do that, let’s take a moment to celebrate some recent wins.
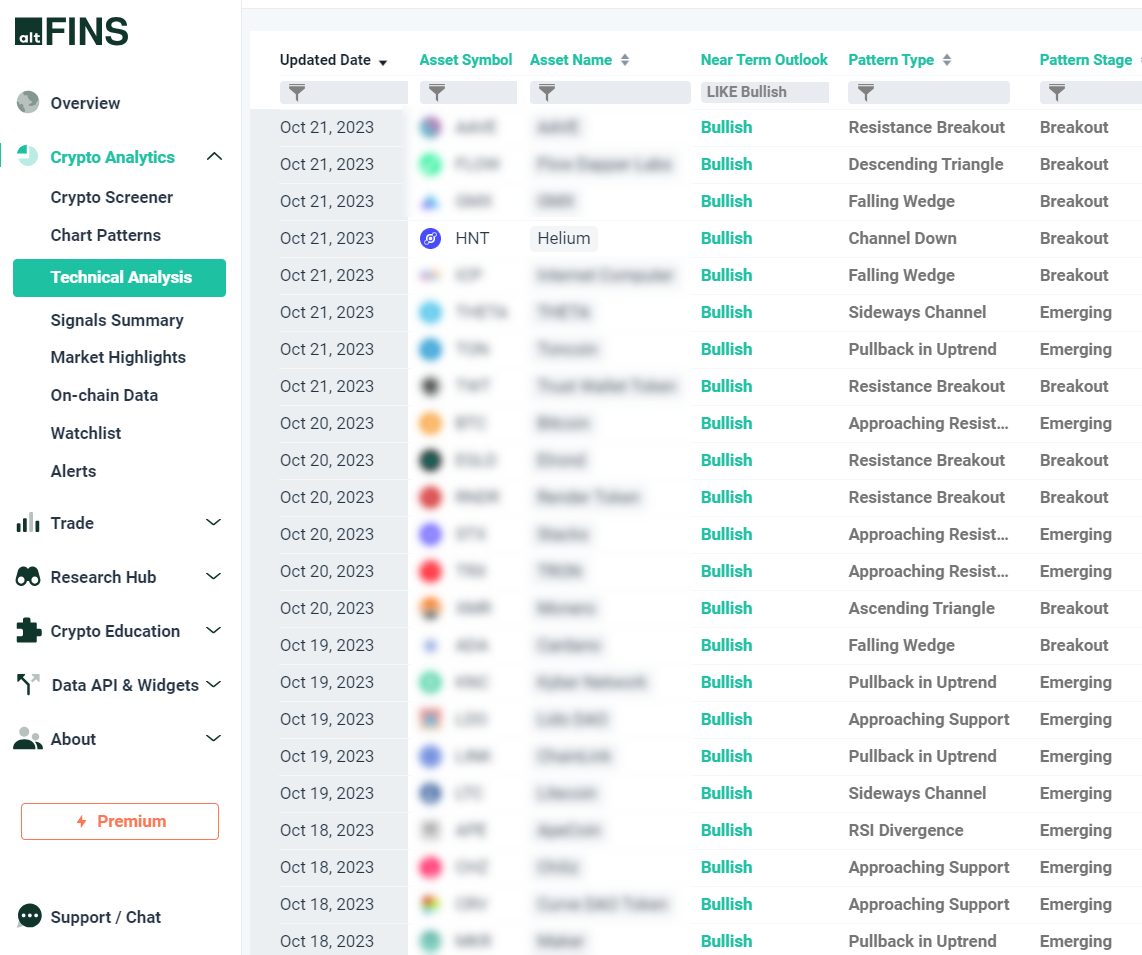
In the fast-paced world of cryptocurrency trading, staying ahead of the game is crucial. At altFINS, we regularly update our trade setups for 63 major altcoins, and as of now, there are 20 bullish trade setups. One of them is HNT, and we’ll provide you with all the details shortly.
But first, let’s celebrate some recent victories:
- Bitcoin (BTC) – Up by 10%
- LinkChain (LINK) – Gained 25%
- Solana (SOL) – Impressive 27% increase
- Bitcoin Cash (BCH) – Notched up 15%
- Stacks (STX) – A remarkable 23% growth
These wins underscore the importance of staying informed and seizing the right trading opportunities. Now, let’s dive into the HNT trade setup.
Helium (HNT) Trade Setup:
Recent market activity has seen a bullish breakout from a Channel Down pattern in HNT. This breakout could signal a bullish trend reversal with the potential to reach $2.00. However, it’s important to note that this is a trend reversal trade setup, which typically carries higher risk compared to trend continuation trades.
For more conservative traders, here’s a more cautious approach: wait for confirmation. You can do this by keeping an eye on the price as it breaks above $1.50 and the 200-day moving average, currently sitting at $1.52.
The 200-day moving average (MA) has proven to be a formidable resistance level, with the price testing it multiple times. However, if HNT manages to break through, it would signal that buyers have absorbed the supply from sellers. This could trigger a rapid price surge.
So, how can you ensure you don’t miss this critical breakout? We recommend setting up an alert for the price breaking above the 200-day moving average or surpassing the $1.53 level.
Here’s tutorial video on how to set up an alert for the price breaking above the 200-day moving average
What is 200-day Moving Average Breakout?
A 200-day moving average breakout is a technical analysis trading strategy that involves monitoring the price of a cryptocurrency over a 200-day period and looking for specific price movements in relation to this moving average.
Here’s how it works:
- Calculate the 200-Day Moving Average: To begin, you calculate the average closing price of the asset over the past 200 trading days. This moving average is a smoothed representation of the asset’s historical price performance.
- Monitor the Asset’s Current Price: Continuously track the current price of the asset.
- Look for Breakouts: A breakout occurs when the current price of the asset crosses above or below the 200-day moving average. This crossing can signal a potential change in the asset’s trend.
- A bullish breakout happens when the asset’s price crosses above the 200-day moving average. It is often interpreted as a signal that the asset may be entering an uptrend.
- A bearish breakout occurs when the asset’s price crosses below the 200-day moving average. This is typically seen as a sign that the asset may be entering a downtrend.
The specific moving average period (in this case, 200 days) can be adjusted to suit different timeframes and trading strategies. Some traders use shorter moving averages for more frequent trading signals, while others use longer moving averages for a longer-term perspective.
Technical Analyses (Bullish Trade Setups)
altFINS’ analysts conduct technical analysis of top 63 coins. The technical analysis is simple and consistent. It follows the key concepts of Technical Analysis (TA): 1) Trend 2) Momentum 3) Volume 4) Chart Patterns 5) Support and Resistance. Discover more.
Visit altFINS platform for more trading ideas!
0 Comments
Leave a comment