Altcoins Melt Up! Technical Analysis of Crypto Large Caps
Past few days have witnessed extremely bullish price action across the crypto landscape.
It’s almost impossible to keep up our technical analyses of cryptocurrency large caps with the rapid price changes.
Plus, some coins have melt up so quick, they’ve blown through all resistance zones, hitting new highs YTD.
The overarching catalyst, in our opinion, is PayPal’s move to enable buying of four major cryptocurrencies (BTC, ETH, LTC, BCH), which has created a surge in demand for BTC from PayPal’s 361M users, which then pulls demand for altcoins.
We quantified PayPal’s potential impact on demand for Bitcoin in this article, where we concluded that PayPal’s user base could generate demand for over 15% of Bitcoin’s current market cap over the next 12 months.
Here are some quick thoughts on the following coins: NEO (NEO), Dash (DASH), Bitcoin Cash (BCH), Ripple (XRP), Binance (BNB), Litecoin (LTC), Cardano (ADA), EOS (EOS), Monero (XMR), Tron (TRX), Crypto.com (CRO), Stellar Lumens (XLM).
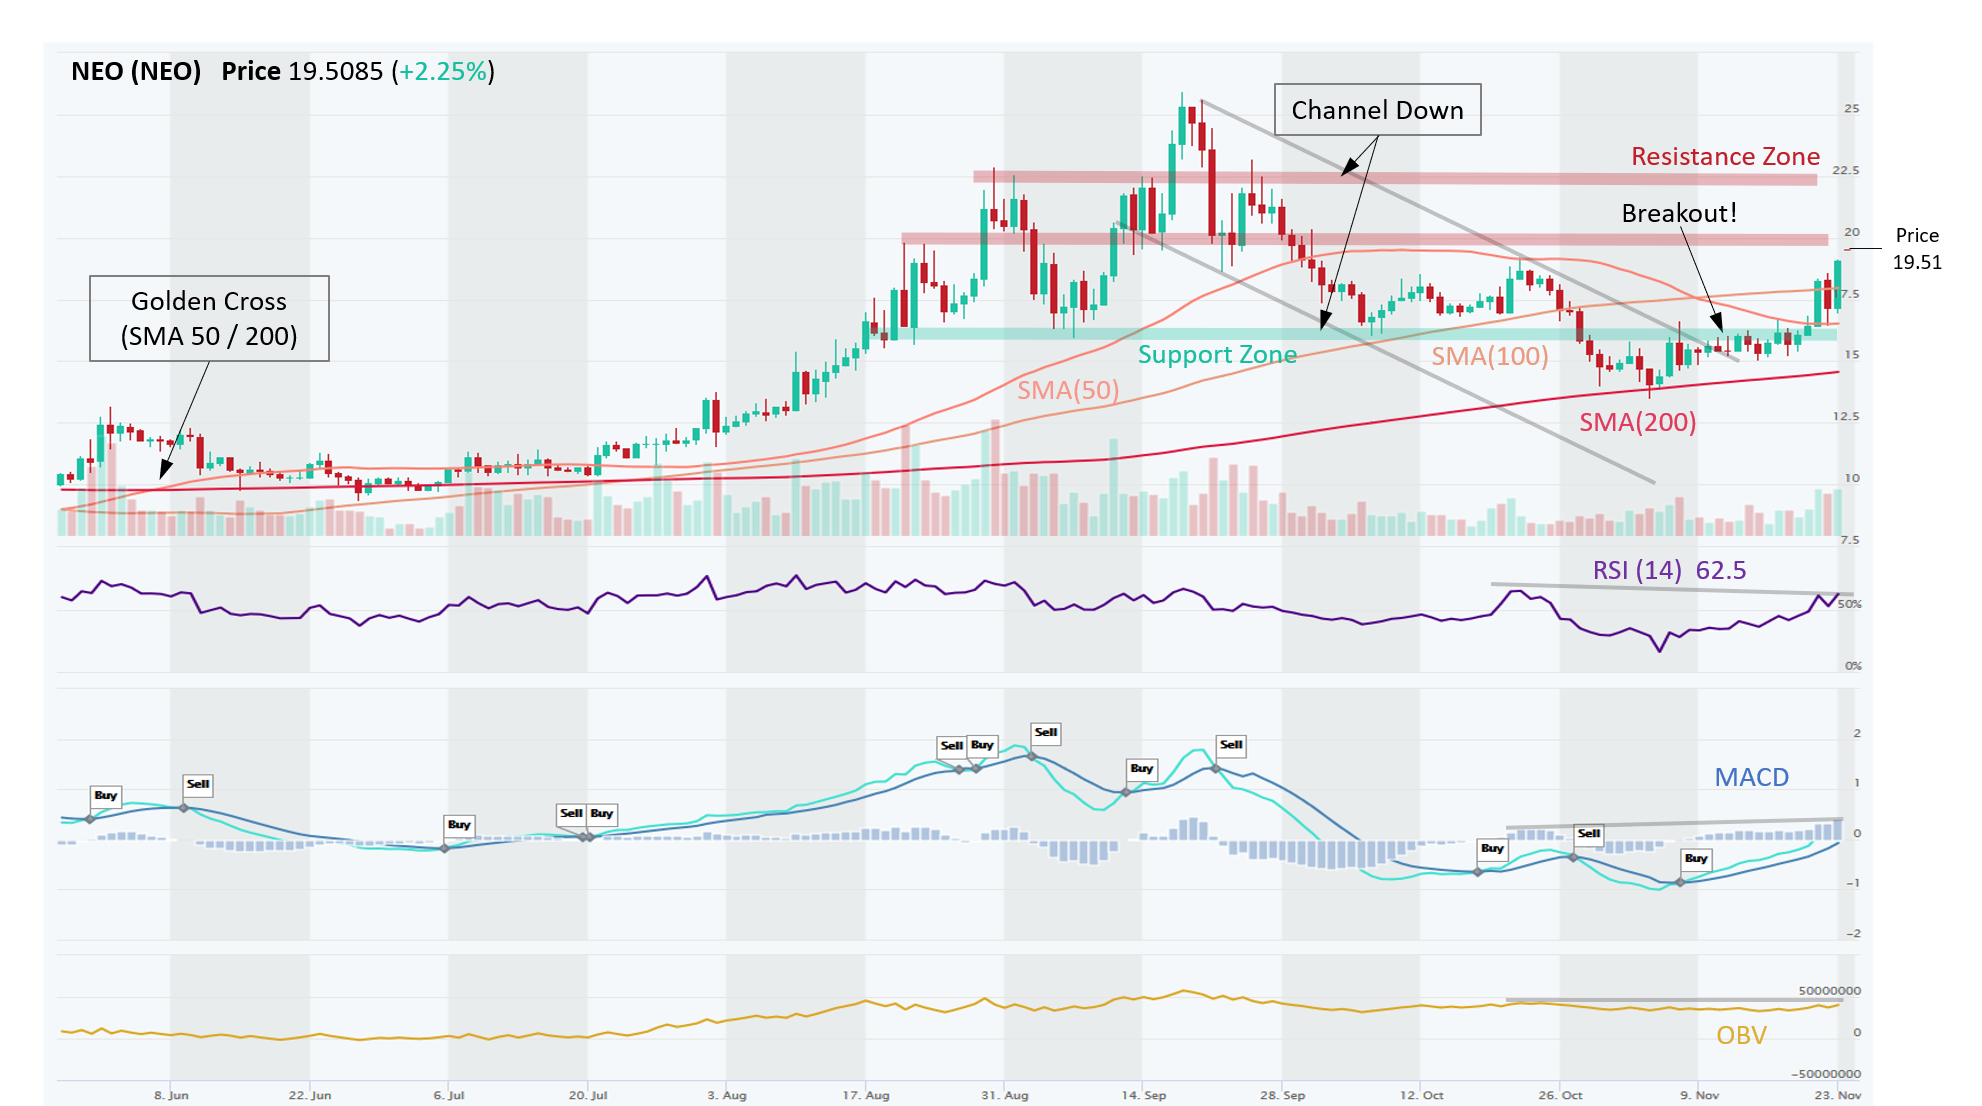
NEO – Broke Out of Down Channel, Now Pressing on $20 Resistance Level
NEO (NEO) is in an Uptrend on a Medium- and Short-Term basis, while Long-Term trend is Neutral. Price was consolidating in a Channel Down from mid-September to early November. MACD formed a bullish signal on 8th November and MACD momentum is steadily increasing. RSI is above 50, which indicates renewed bullish momentum, but there are signs of bearish divergence as RSI was not able to make new highs since channel break on the indicator. OBV is trending slightly up, which is positive. ADX has a Neutral rating, which means current trend is neither strong nor weak, and ADX momentum is also waning. Price is now up against a $20 Resistance Zone. If it breaks through, the next stop would be $22.50.
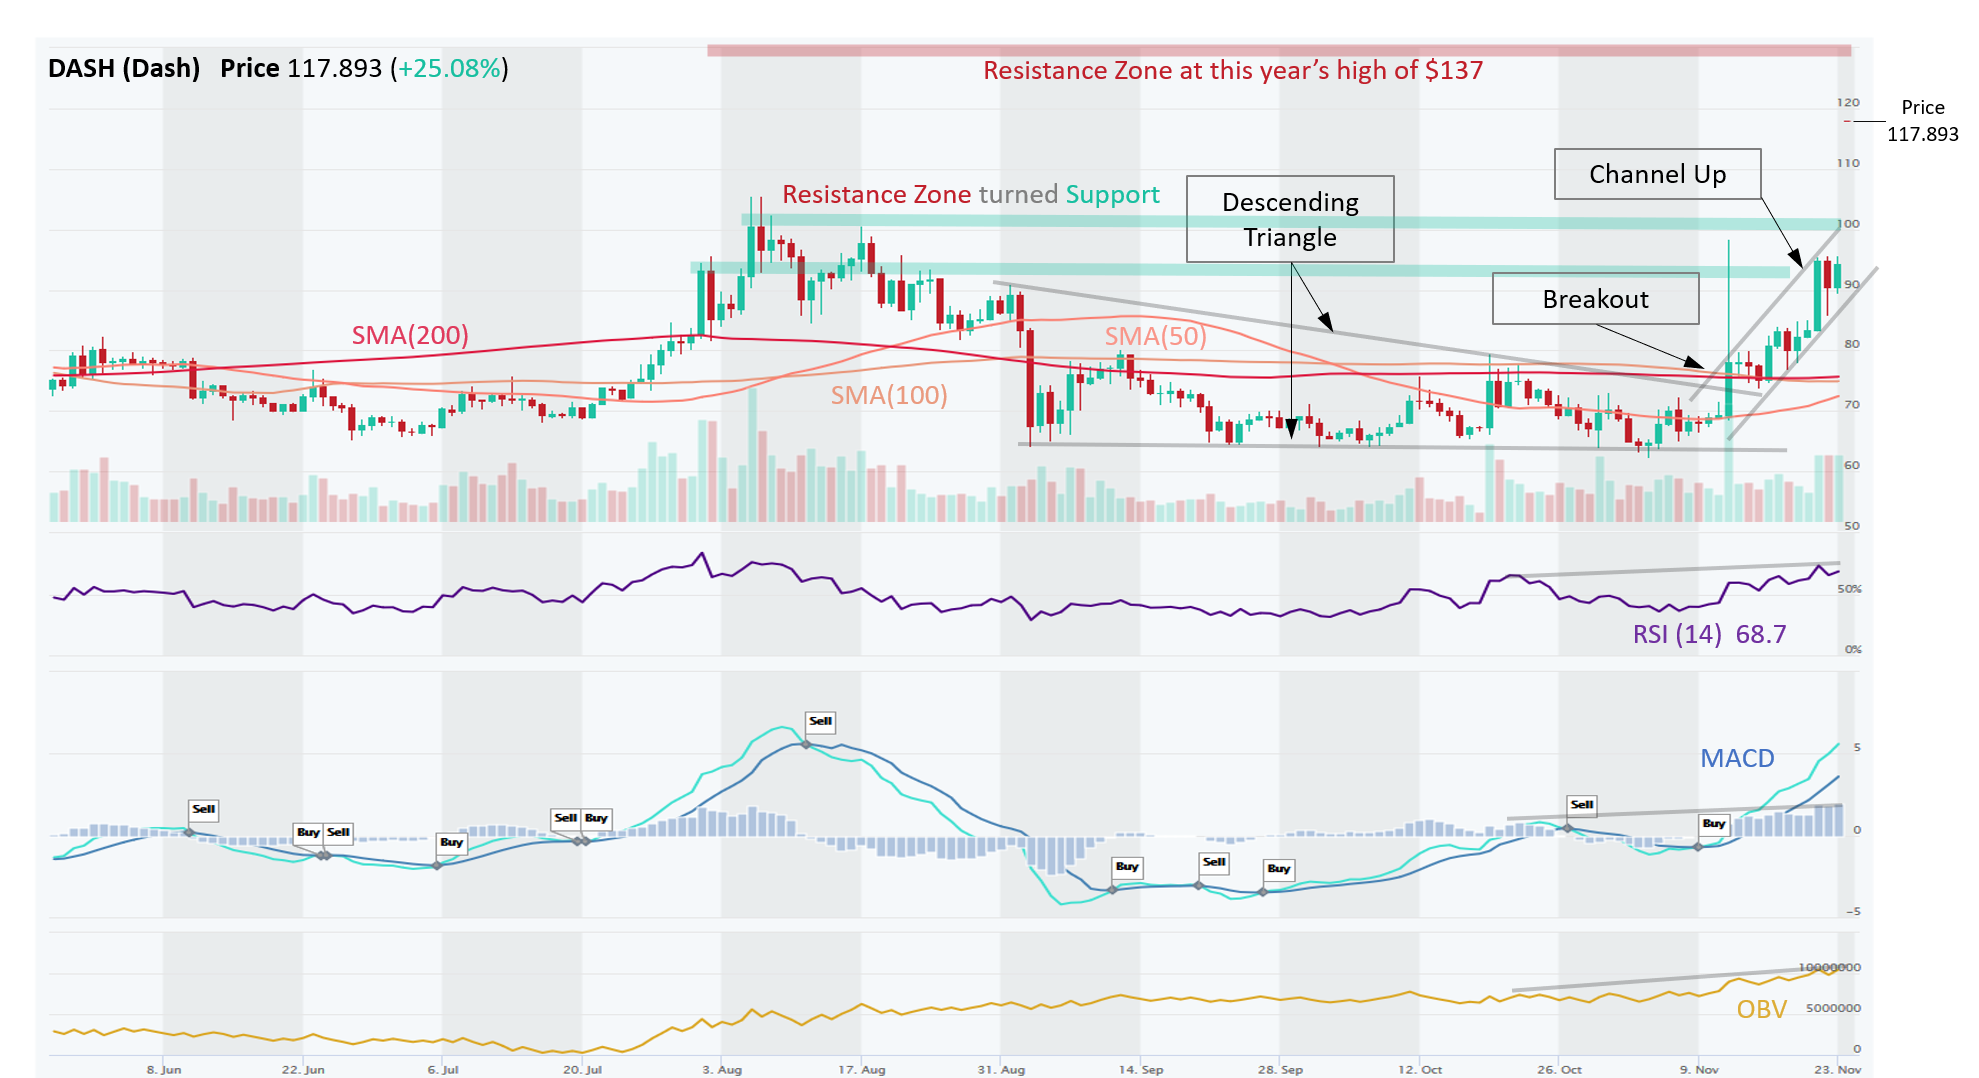
DASH – Unrelated Catalyst Sparked a Big Volume Breakout from a Descending Triangle
DASH (Dash) while still in a strong Downtrend on a Long-Term basis, the Medium- and Short-Term trends are clearly Up. Price broke out from a Descending Triangle with a massive candle on Nov 12 (touching ~S100). The catalyst was an IPO filing by another company, DoorDash (delivery service), which plans to list on NYSE under a ticker “DASH”. While completely unrelated to cryptocurrency DASH, it nevertheless jumpstarted a Short-Term Uptrend. Makes us wonder though, when will the buyers realize DASH is not DoorDash, or does it not matter?! Since then, MACD turned bullish, OBV is gaining traction, and RSI crossed above 50, all of which indicates renewed bullish momentum. RSI is rising but not overbought yet, leaving room for upside. Price action of DASH formed a channel up, which it broke out of to the upside. DASH blew through numerous resistances, which now turned to support at $65, $93 and $100 levels. Next resistance is at ~137, which is this year’s high. ADX is at 39.7, which indicates that the current trend is strong and ADX is rising.
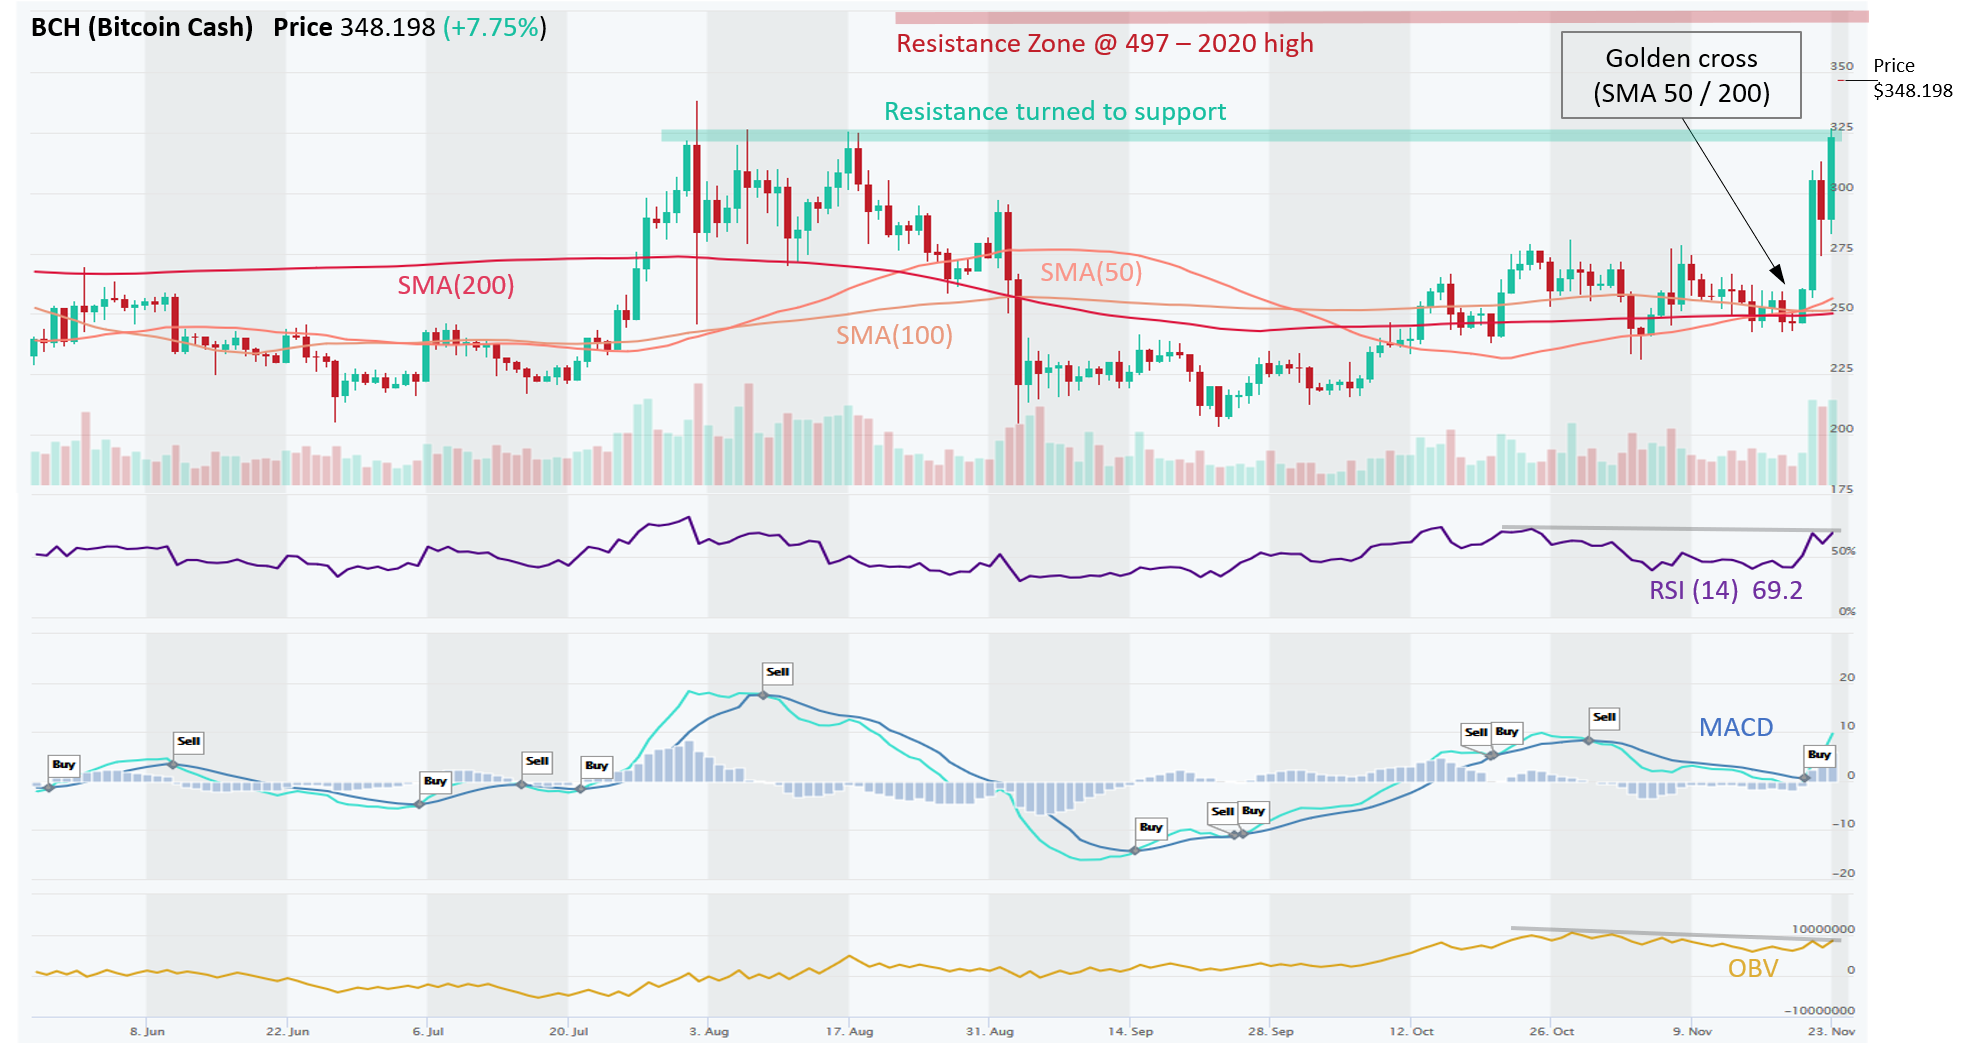
BCH – Tailwinds From PayPal’s Move Propel BCH to New Highs in 2020
Bitcoin Cash (BCH) is in strong uptrend across all time horizons (Short-, Medium-, and Long-Term). BCH is one of four cryptocurrencies that PayPal initially supports, which we believe gives it strong tailwinds and sparked a recent rally. BCH formed a golden-cross formation on 17th November and MACD posted a bullish signal on 21st November. Price is also above all major SMAs, which provides plenty of support and BCH also took out the resistance zone at ~325. However, traders should be wary that although recent price action was positive, RSI is trending downwards, which shows signs of bearish divergence. Also OBV is trending downwards, which means volume on Down days was actually higher than on Up days. This means that recent price action has been on thin volume. ADX is at 22.9, which indicates that the current trend is strong, however ADX is downward sloping.
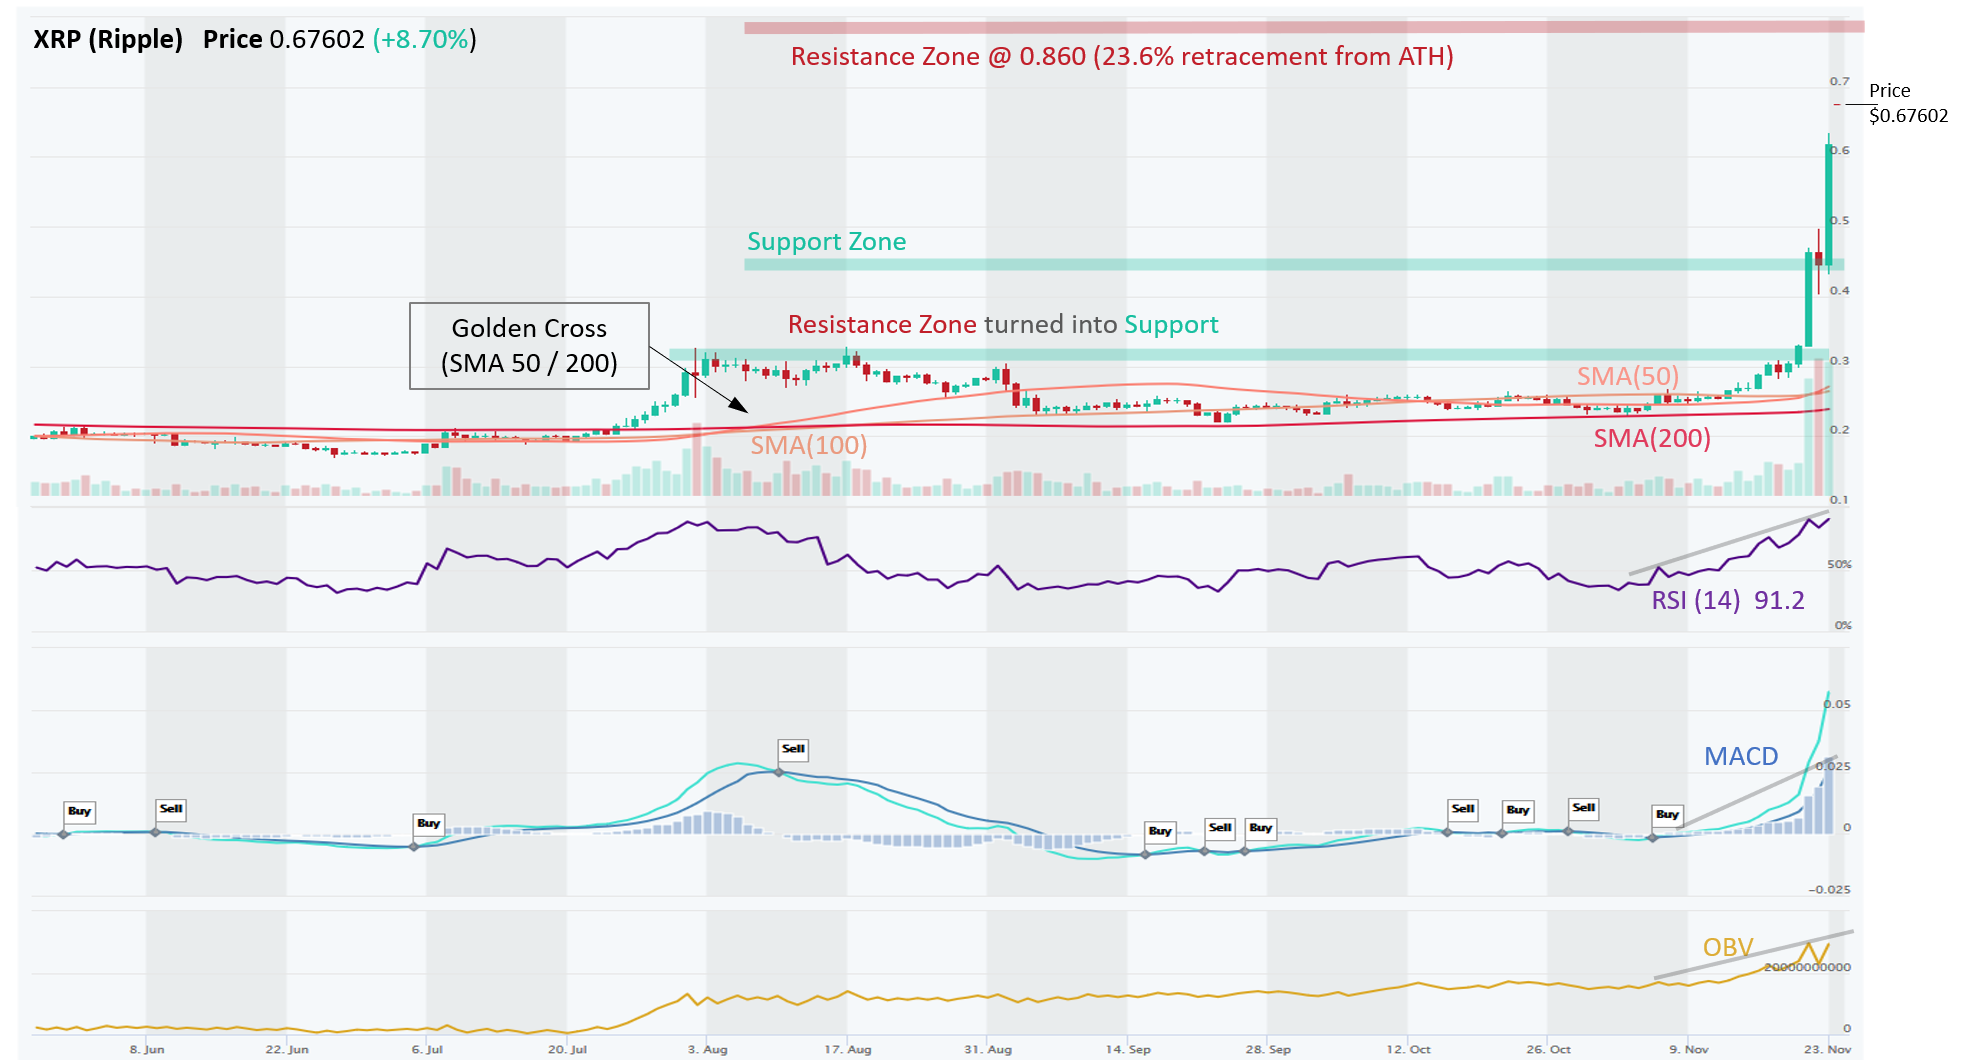
XRP – Massive Rally to New Highs for 2020
Ripple (XRP) is in strong uptrend across all time horizons (Short-, Medium-, and Long-Term). XRP has had a monstrous price advance in the recent week, clearing resistance zones at ~0.33 and ~0.40. Next resistance zone is ~$0.86, which is a 23.6% retracement from ATH. Volume on Up days has also picked up, as indicated by rising OBV (volume on Up days exceeds volume on Down days), confirming the Uptrend. MACD posted a bullish signal on Nov 5 and MACD momentum has increased rapidly. RSI is over 90, which indicates severely overbought levels, although RSI can stay overbought for a longer time. Positively, RSI is also trending upwards, which coincides well with recent bullish price action. ADX is at 46, which indicates current trend is very strong, and ADX trend is also rising.
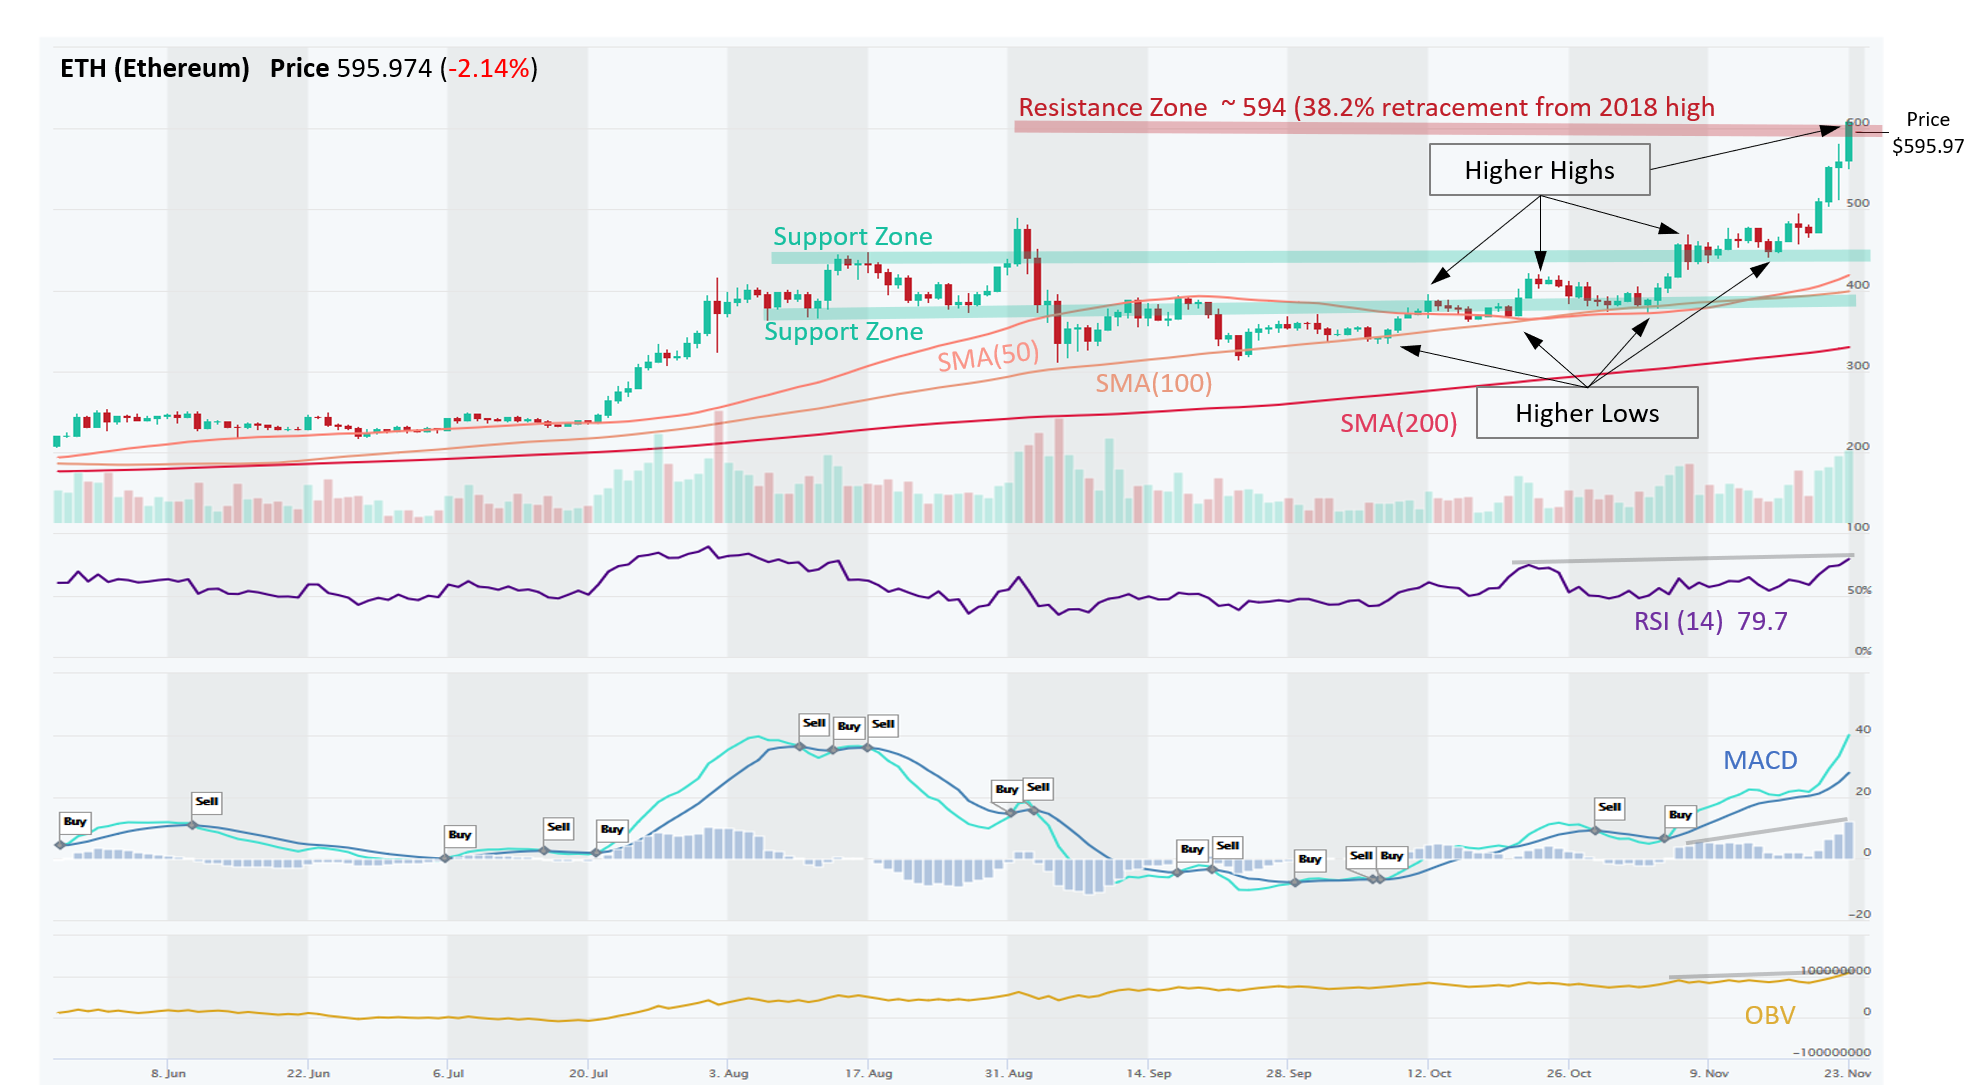
ETH – Textbook Uptrend; Making New Highs in 2020
Ethereum (ETH) is in strong uptrend across all time horizons (Short-, Medium-, and Long-Term). Since September, ETH was struggling with a Resistance Zone around $375, which it finally broke out of on Oct 21. Shortly afterwards, it cleared another Resistance Zone around $450. Now that Resistance Zone has become a Support Zone, in a TA principal known as Polarity. Price has been marching steadily upwards, forming a textbook uptrend with a series of Higher Highs and Higher Lows. ETH has cleared this year’s high of $490, and very swiftly approached $594 level, which is the 38.2% retracement from the 2018’s ATH price) and is currently attacking this big resistance level. MACD Crossover and RSI over 50 are indicating rising momentum. RSI is overbought (> 70), but it can stay overbought for a long time, the trend of RSI is also upward. ADX is at 49.8, which indicates that the current trend remains very strong. OBV also has an upward trend, indicating that volume on Up days has exceeded volume on Down days.
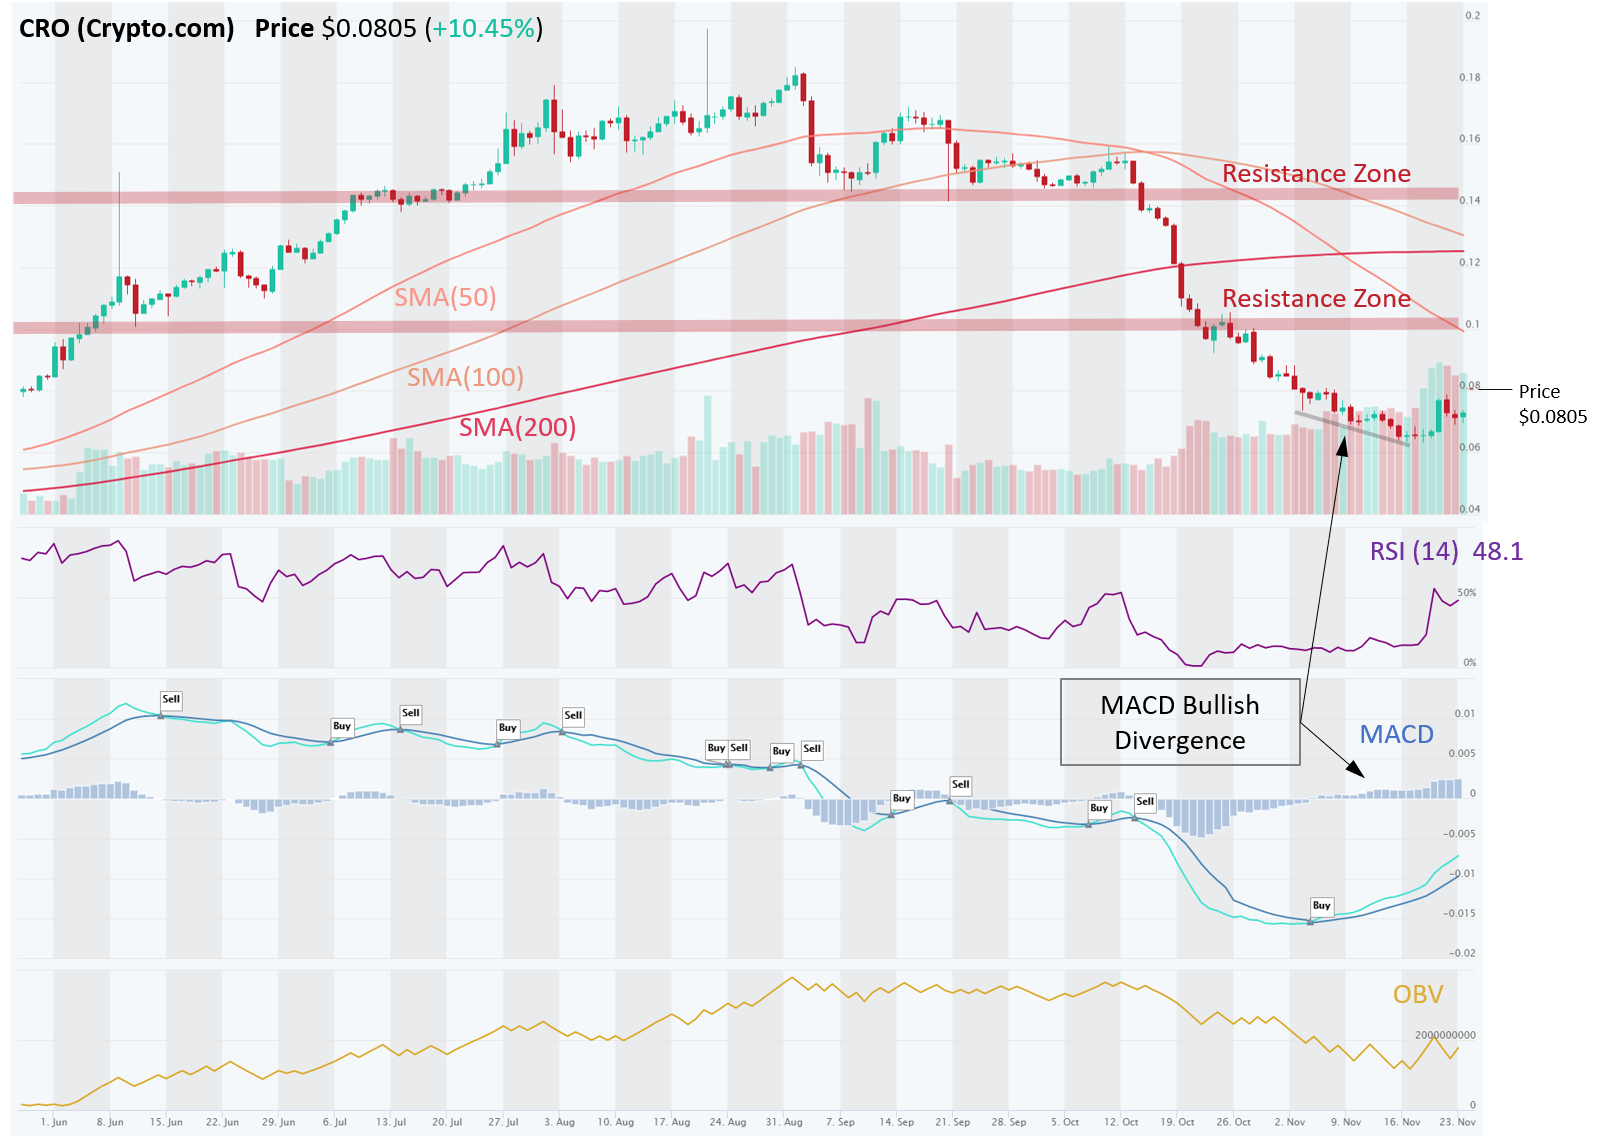
CRO – Possible Bullish Reversal in a Making after a Bullish MACD Divergence
CRO (Crypto.com) is technically still a Downtrend (based on SMA trends), however, that may be changing. There was a bullish MACD Divergence in early Nov (price declined but MACD histogram had risen), which was followed by solid gains on big volumes. The next Resistance Zone is around $0.10 or about 25% higher, but a bigger Resistance is really at $0.14.
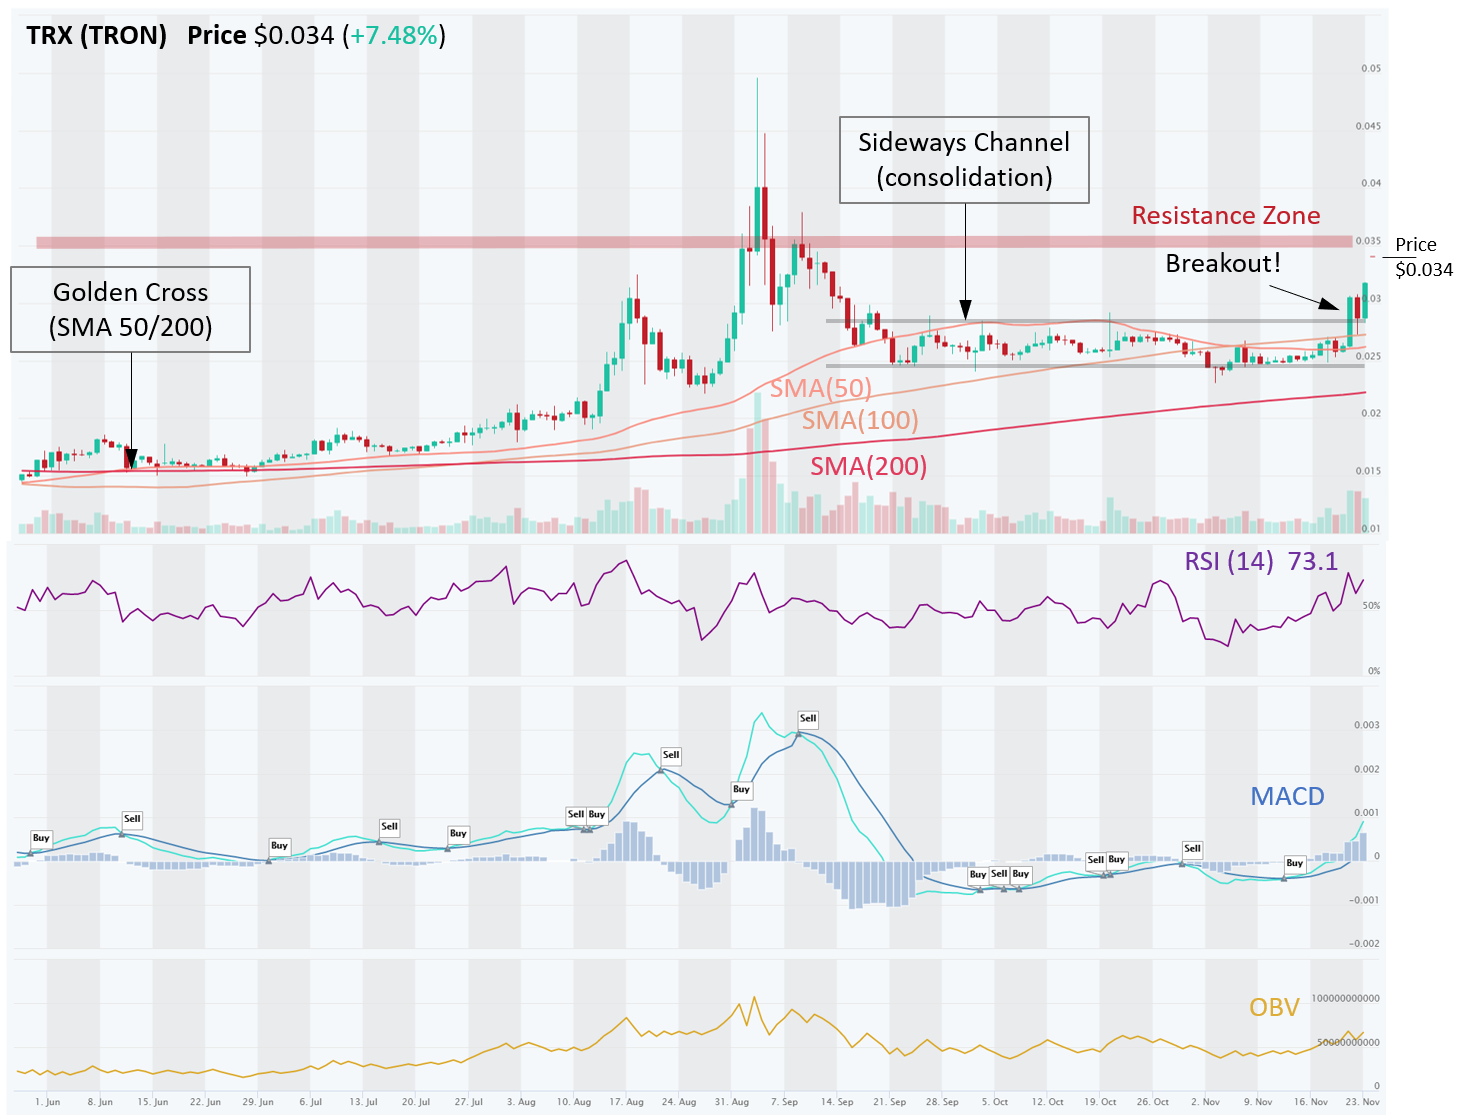
TRX – Broke Out of a Sideways Consolidation Channel
TRX (Tron) is in an Uptrend across all three time horizons (Short, Medium, Long). After trading in a range between $0.0275 and $0.0240 for two months, which it broke out of to the upside on Nov 21. The next Resistance Zone is around $0.035. Near-term momentum (MACD Crossover and RSI > 50) are bullish, and the breakout has been supported by a solid increase in volume on Up days vs. Down days (OBV).
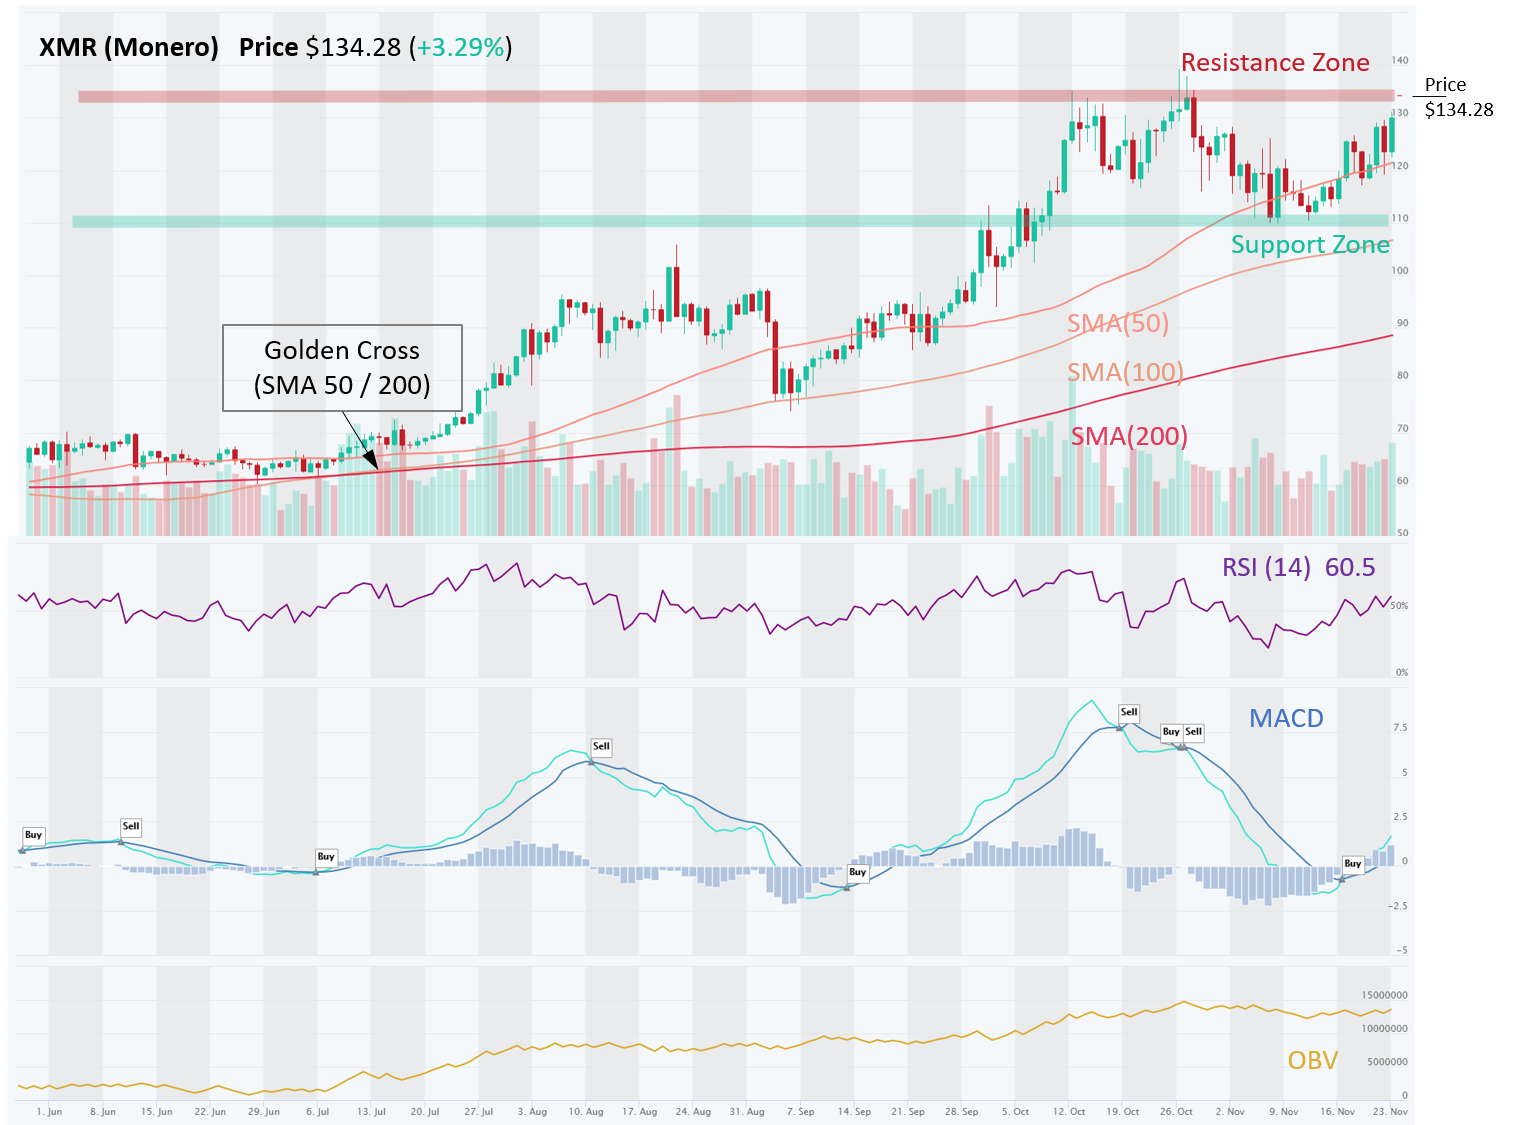
XMR – Rising Momentum Puts Price Just at a Critical Resistance Level of $135
XMR (Monero) is in an Uptrend across all three time horizons (Short, Medium, Long). The coins went through a modest correction after a great run in October. A similar consolidation happened after its July run, so be prepared to jump back in. It is currently just at the critical Resistance level of $135. In fact, on an hourly chart, we can see that price has already exceeded that Resistance level (reached $143) but pulled back. If it can close above this level on a daily interval, the price will make new YTD highs. Volume on Up days vs. Down days (OBV) has increased but not convincingly.
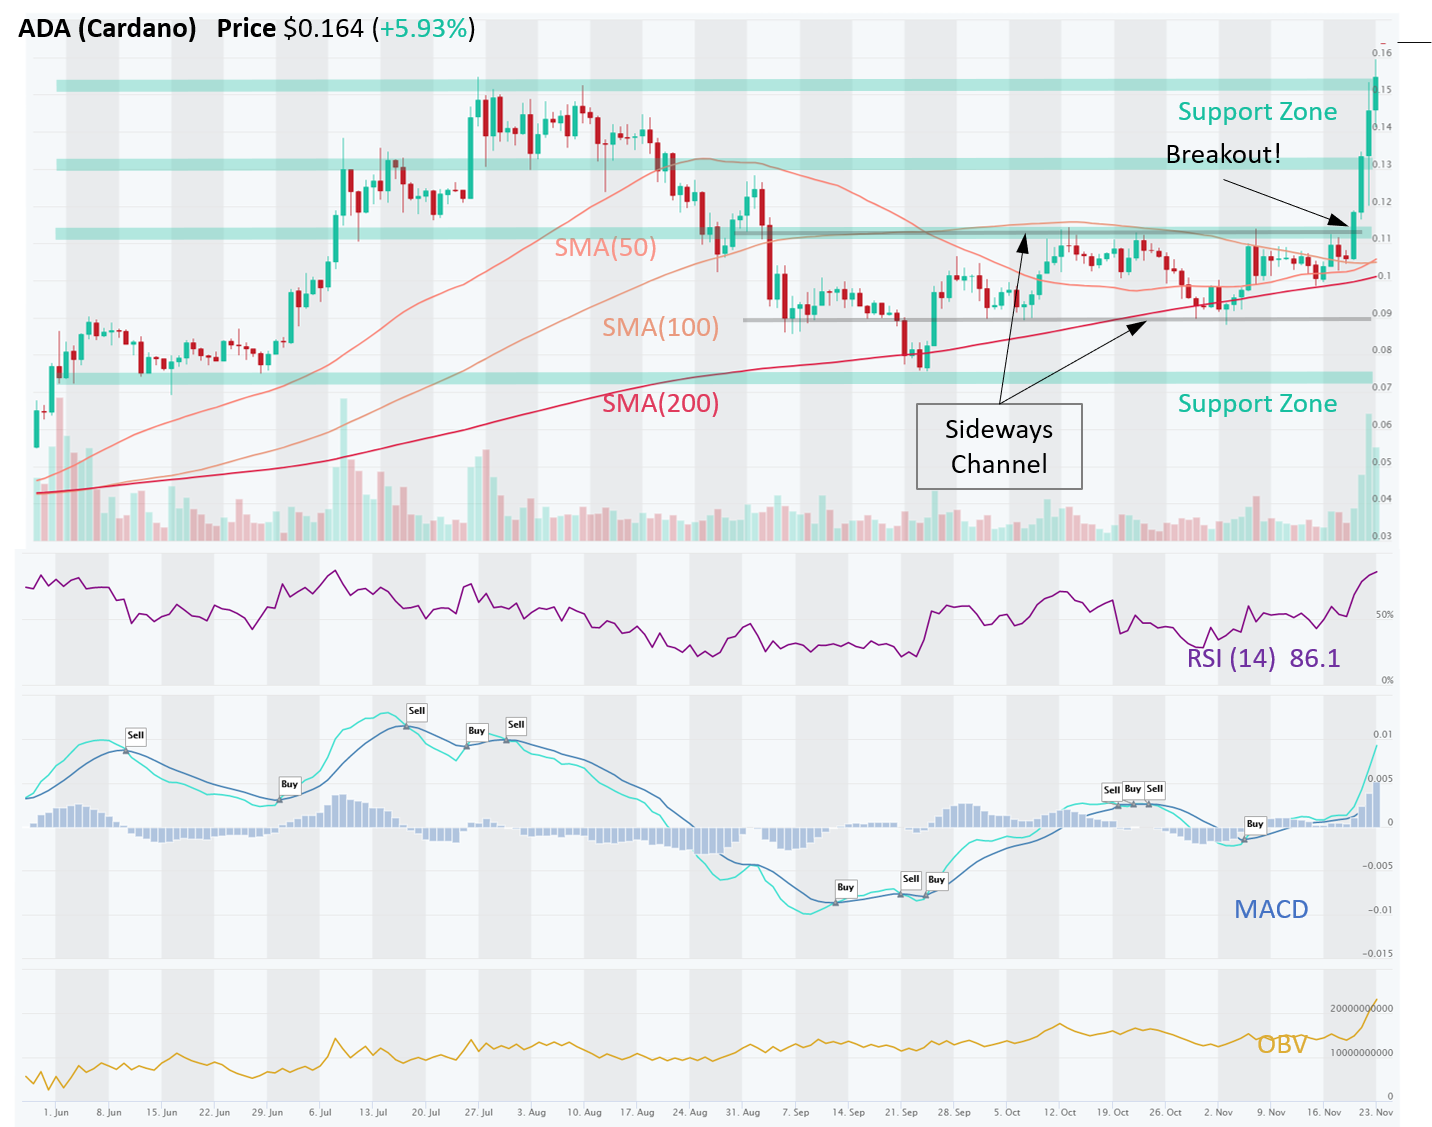
ADA – Broke Out of Sideways Consolidation Channel, Hitting New Highs 2020
ADA (Cardano) is in an Uptrend across all three time horizons (Short, Medium, Long). Price was consolidating for two months in a sideways channel between a Resistance Zone (~ $0.11) and Support Zone (~$0.09). Finally, on Nov 20, price broke out of the channel to the upside, with big volumes too, and quickly advanced through the $0.13 and $0.15 resistance areas (now turned into Support Zones – a principal known as Polarity). Momentum remains bullish (MACD, RSI), and OBV is also rising quickly as volume on Up days easily exceeded volume on Down days recently. Price has now reached YTD highs. The ascend has been so fast and so steep, that we would expect some consolidation and a retest of $0.15 or even $0.13 levels, which could be good entry points.
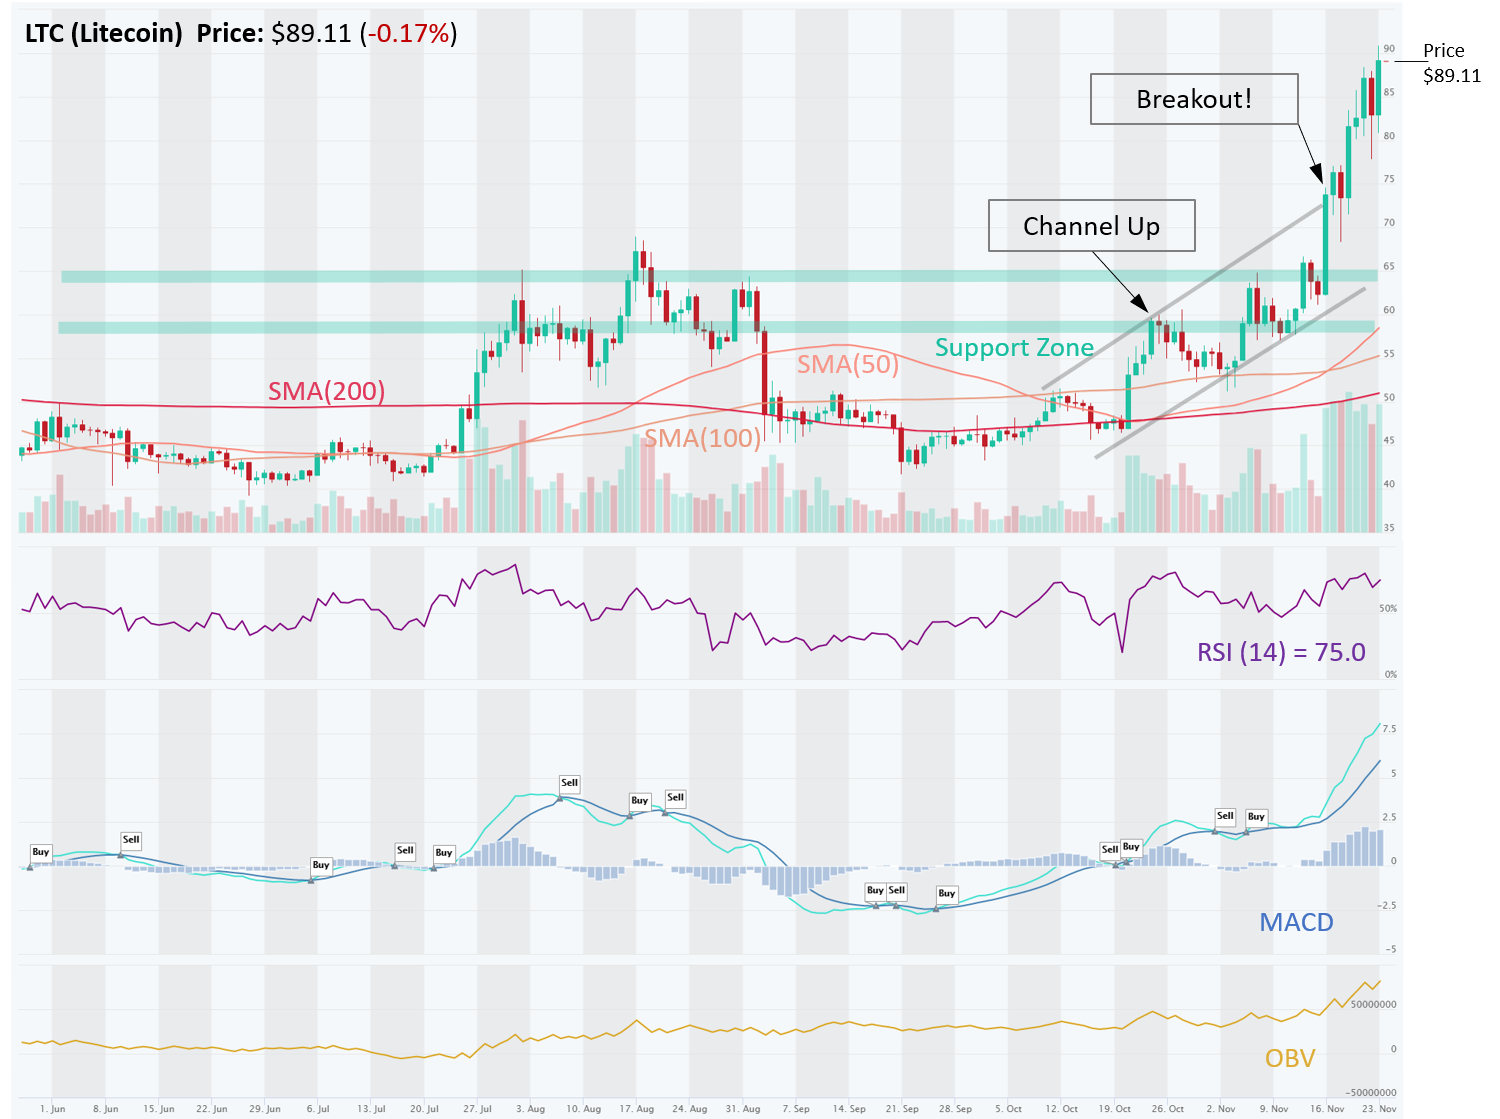
LTC – Blew Through All Resistance Zones; Potential for More Gains Driven by Demand from 360M PayPal Users
LTC (LiteCoin) is in an Uptrend across all three time horizons (Short, Medium, Long). We first highlighted the big tailwinds from PayPal user demand on Oct-29 (read here). Short term trend is highlighted by Higher Highs and Higher Lows, which also formed a Channel Up trading pattern. As we noted in our update on Nov-13, LTC was poised to surpass this year’s high of $68, which it did shortly afterwards. Price decisively broke through a $65 resistance and even through the upper Channel trendline. Momentum indicators, MACD and RSI, remain bullish (MACD crossover and RSI > 50. OBV is rising, indicating that the demand for LTC coins is higher than supply (volume on Up days exceeded volume on Down days). LTC is set to go higher yet.
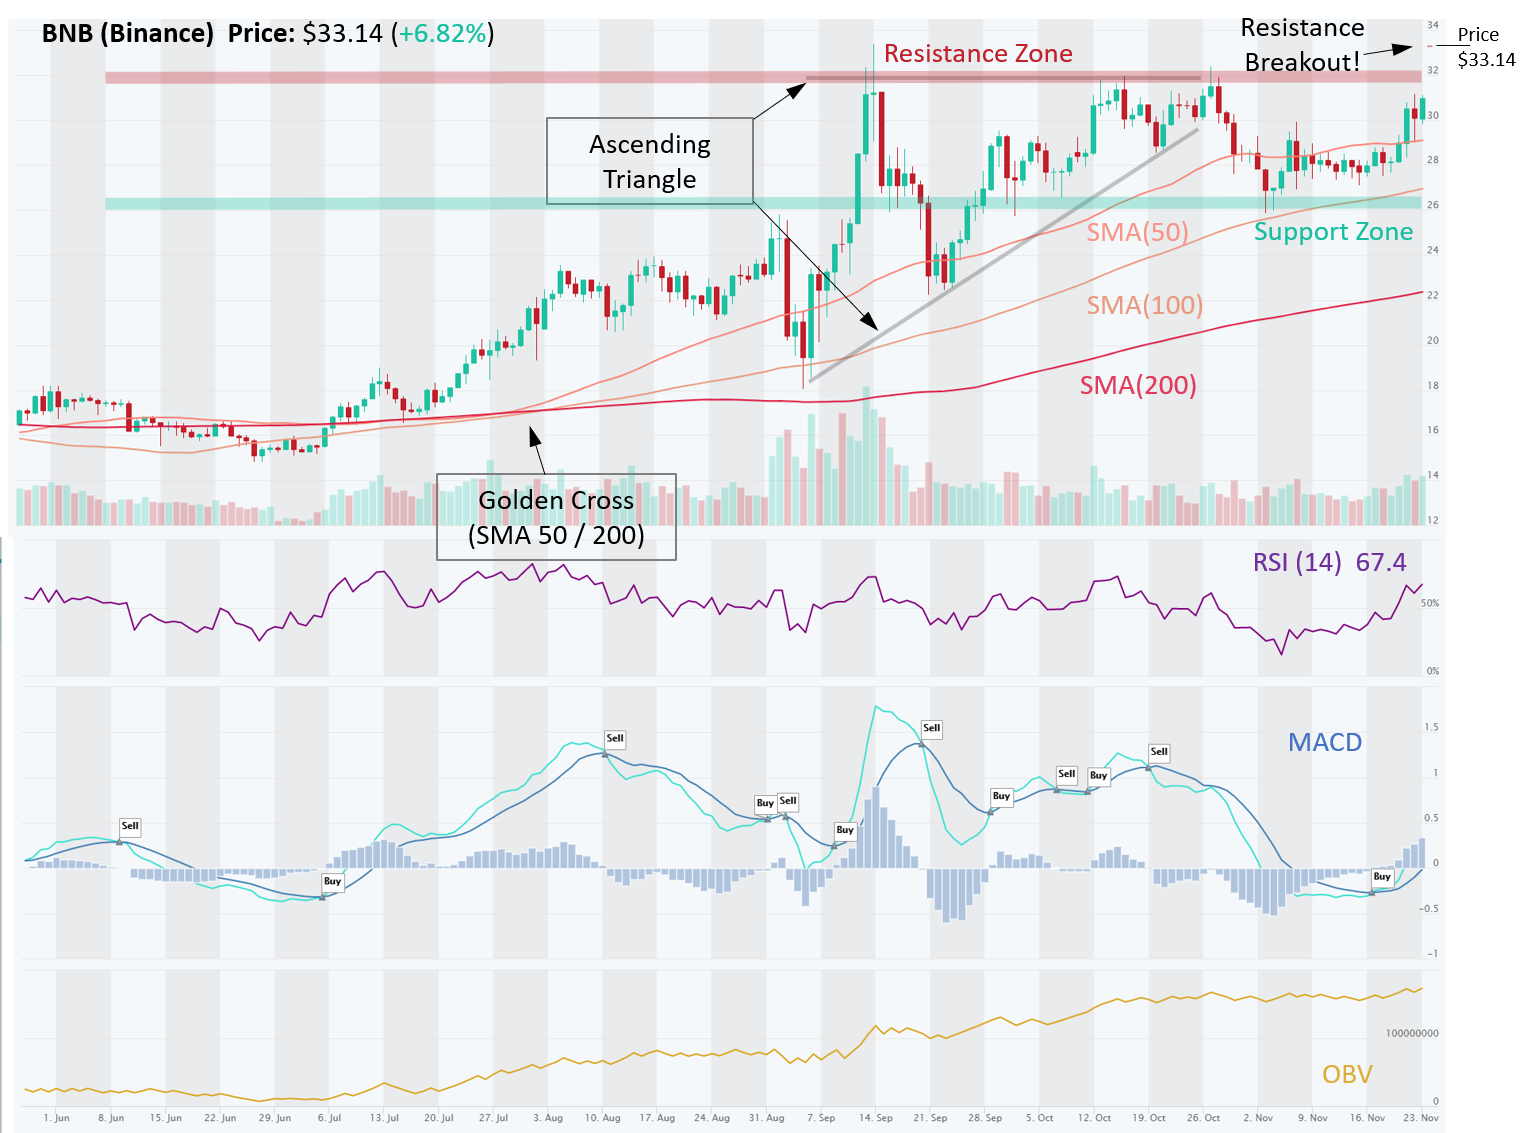
BNB – Breakout Through Resistance With Strong Momentum
BNB (Binance) is in an Uptrend across all three time horizons (Short, Medium, Long). Recently, momentum picked up with MACD bullish crossover and RSI > 50, which was sufficient to break through a strong Resistance Zone around $31. OBV is rising, albeit only modestly, as volume on Up days has exceeded volume on Down days. BNB appears poised to rally further from here.
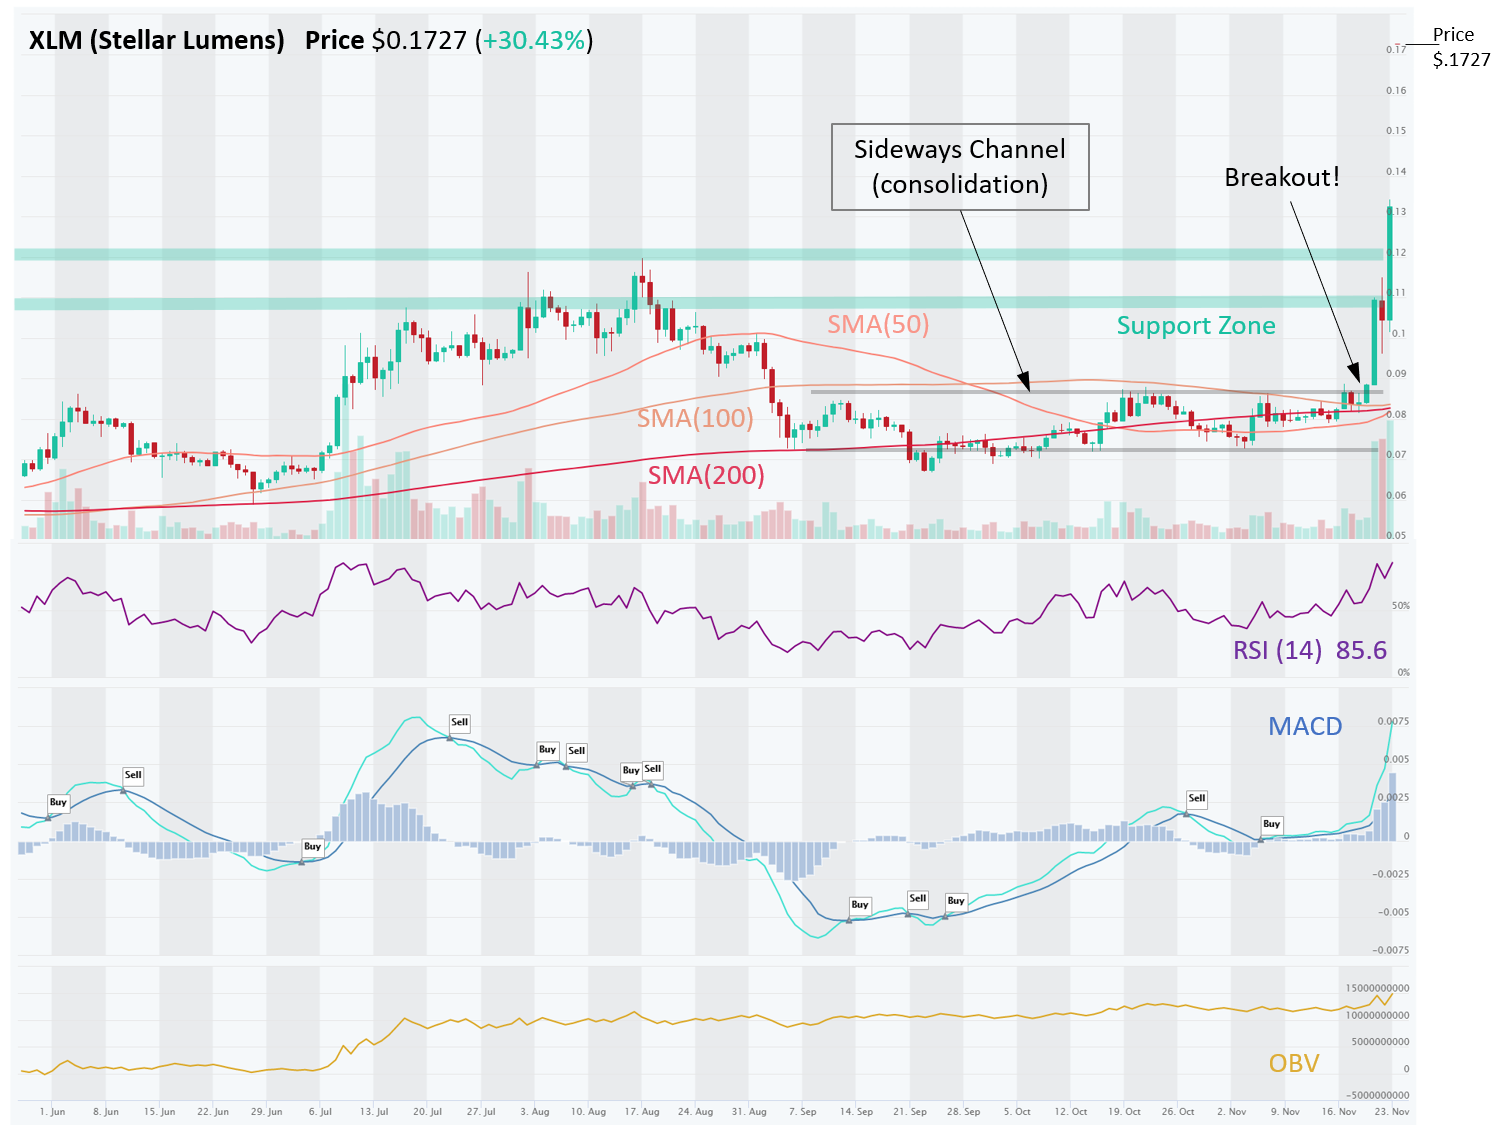
XLM – Vehemently Broke Out of a Sideways Channel
XLM (Stellar Lumens) is in an Uptrend across all three time horizons (Short, Medium, Long). After consolidating in a Sideways Channel for two months ($0.070 – $0.085), price broke out of it to the upside and exploded higher (over 100% gain in 4 days), blowing through Resistance levels at $0.11 and $0.12 like a hot knife through butter. These levels have now turned into Support. It appears overbought now (RSI > 85) and it is likely to see some profit taking / consolidation near term. Prices rarely go up in a straight line for long.
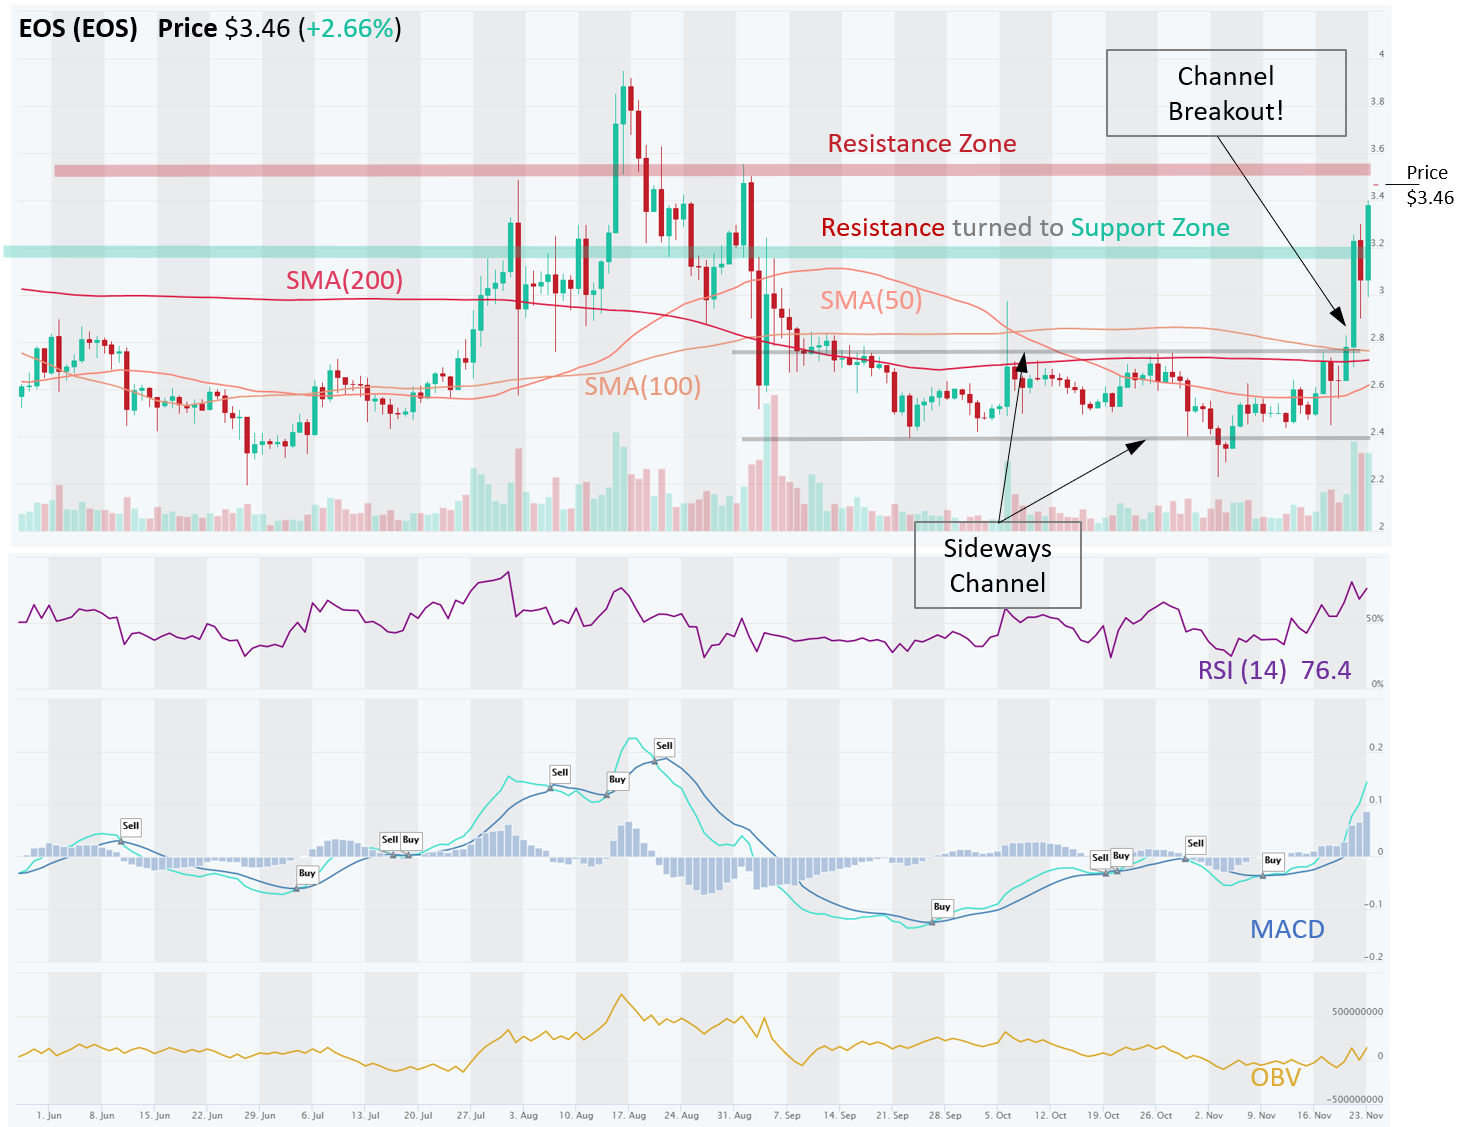
EOS – Broke Out of Sideways Channel Consolidation on Big Volumes
EOS is in an Uptrend on Short- and Medium-Basis) although Long-Term trend still has not corrected. Similar to other altcoins, it consolidated for two months between $2.40 and $2.70, which was also the 200 day SMA. It broke out of this channel on Nov 21 and quickly broke through the next Resistance level at $3.20, which now turned into Support. It is approaching perhaps the last obstacle to reaching new YTD highs: resistance at $3.55. Momentum (MACD Crossover, RSI > 50) remain bullish near term.
Disclaimer: This content is for informational purposes only, you should not construe any such information or other material as investment, financial, or other advice. There are risks associated with investing in cryptocurrencies. Loss of principal is possible.