Technical analysis of ONT, HEDG, BAT, DASH, BNB, LTC, ADA, EOS, XMR
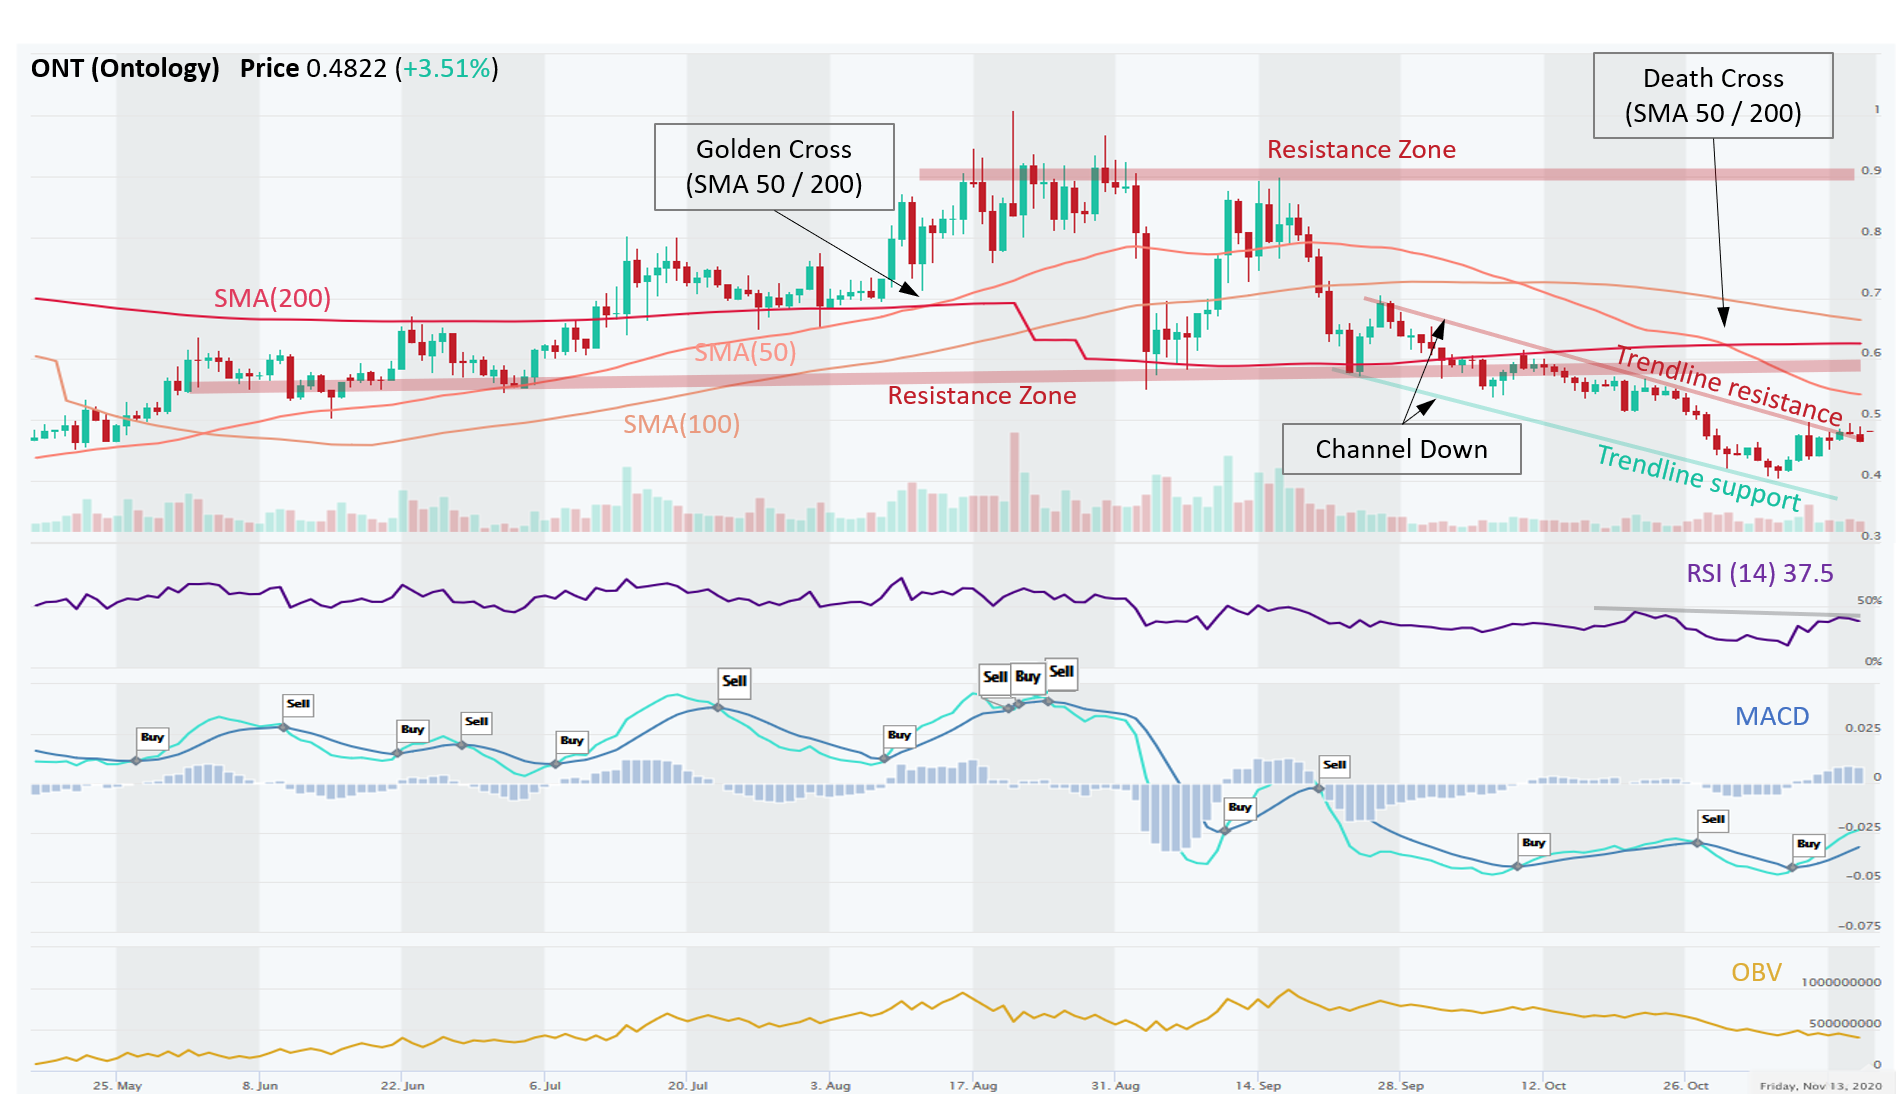
ONT – Trading in a Descending Channel During a Downtrend; Awaiting a Clear Breakout
ONT (Ontology) is in a Downtrend across all time horizons (Short-, Medium-, and Long-Term). Confirming the Downtrend was a recent Death Cross (SMA 50/200). ONT is trading in a Descending Channel since September, making Lower Highs and Lower Lows. While, RSI (momentum indicator) bounced from oversold levels, it is still below 50 and moreover, still trending down. OBV is also decreasing which means that volume on Down days is higher than on Up days, hence, sellers overwhelm buyers. MACD momentum flashed a buy signal on November 6, but it seems like just another pullback in a Descending Channel. Based on ADX indicator value of 40 (scale of 0-100, ADX measures trend strength), current Downtrend has weakened a bit from 50 recently. Traders can trade the Channel (Buy Support trendline, Sell Resistance Trendline) but a more interesting signal is a breakout (Up or Down). Price is butting up against the Channel Resistance trendline currently; if it breaks through, it could go to the next horizontal Resistance Zone at ~ $0.60.
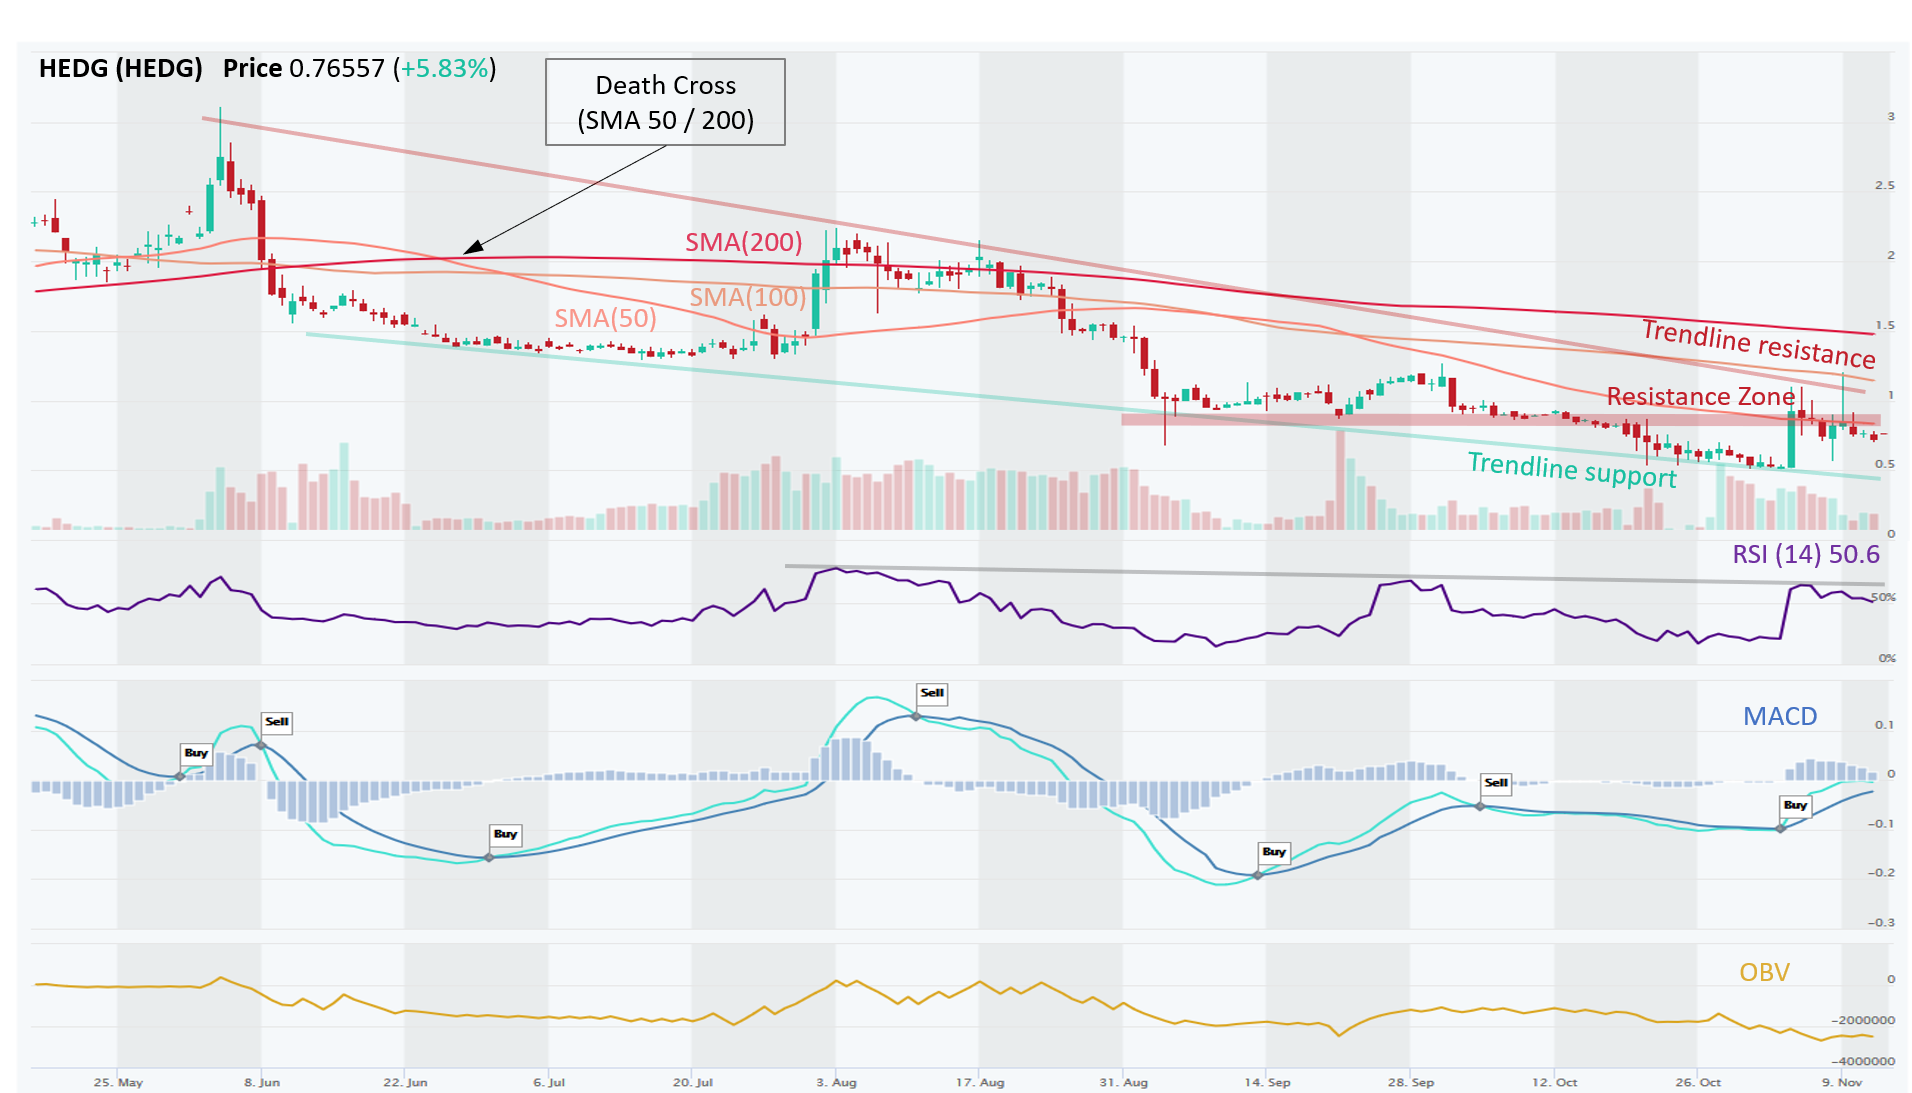
HEDG – No Signs of an End to a Downtrend
HEDG (HEDG) is in a Downtrend across all time horizons (Short-, Medium-, and Long-Term). The bearish outlook is also based on trendline resistance, which stretches from late May. Death Cross was formed shortly after on June 26, confirming a Long-Term Downtrend. A horizontal Resistance Zone has formed recently after it flipped from prior Support Zone. This switch is a powerful TA principle known as Polarity. Recent MACD Buy signal and bullish RSI crossover above 50 appear to be just a pullback in a Downtrend as OBV is flattish at best, suggesting that the recent gains were made on low volume from buyers. We need to see a decisive breakout above the Resistance Zone at ~ $0.75 to get more constructive.
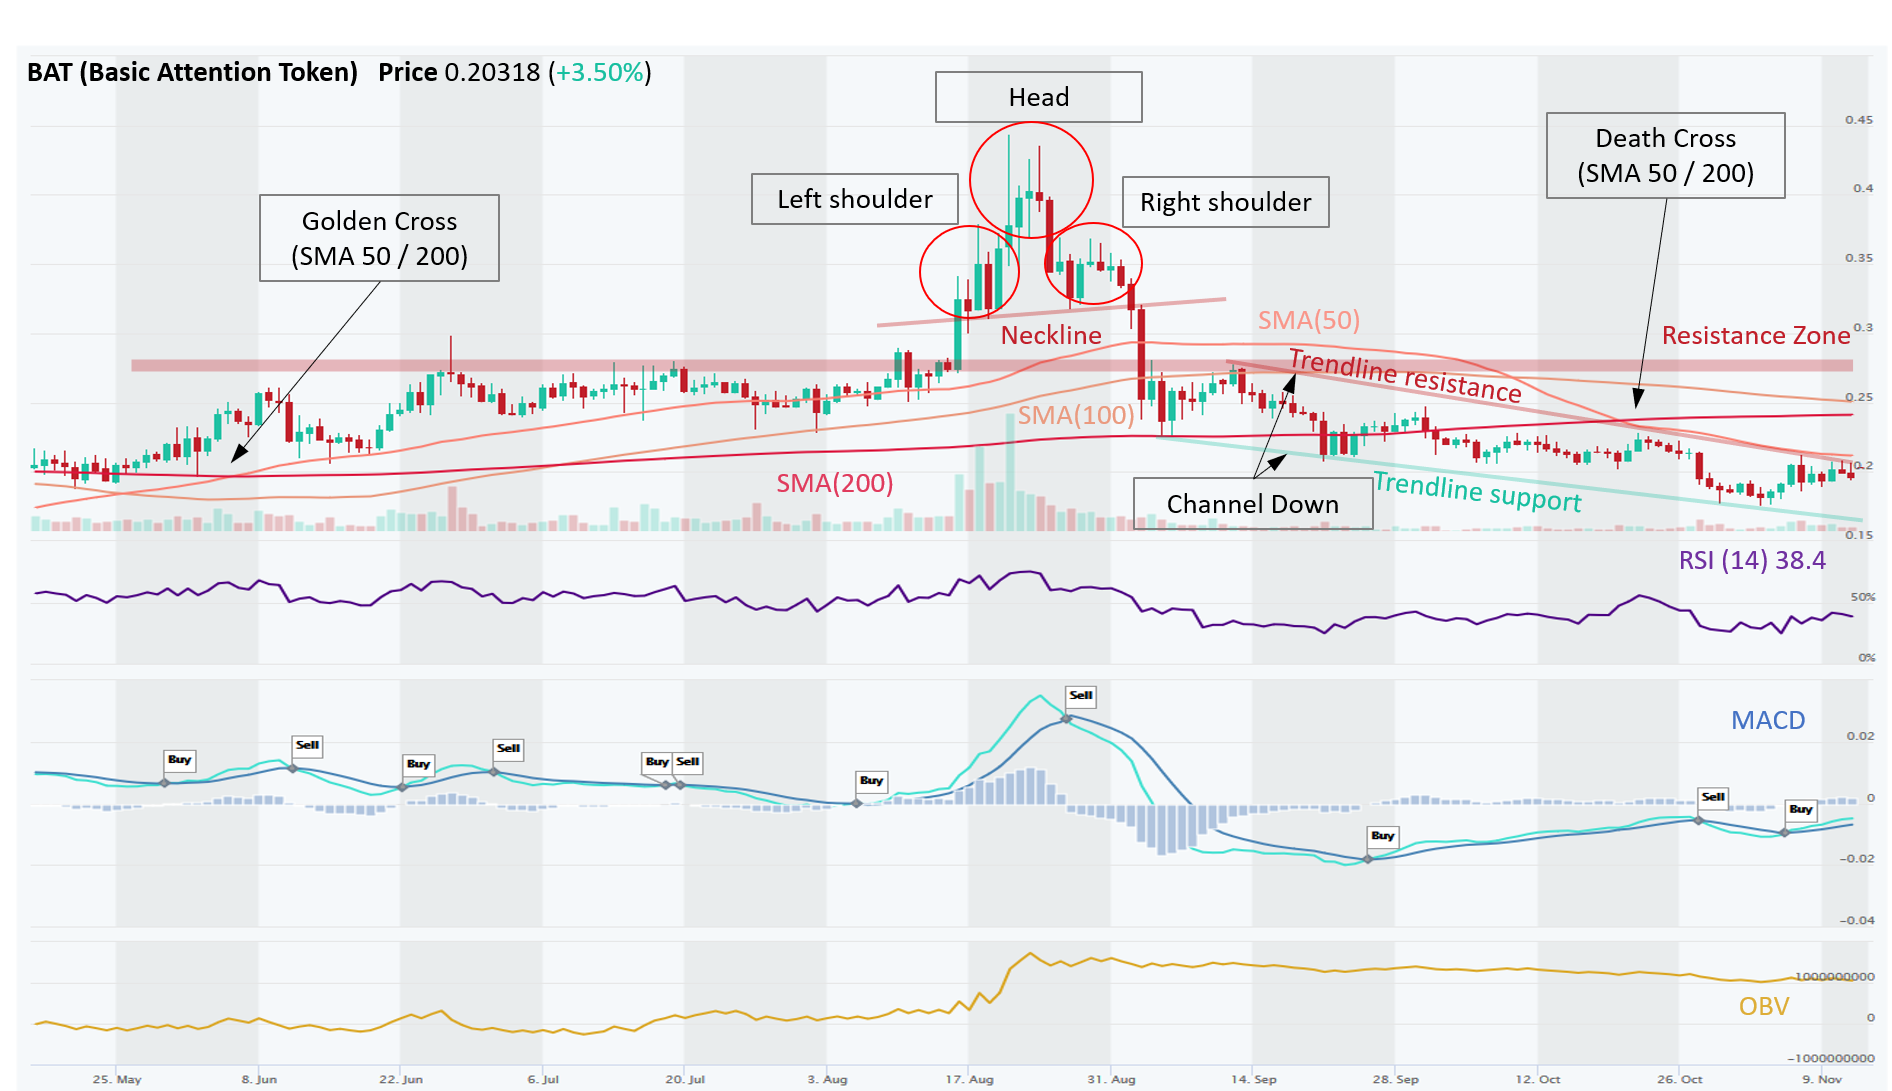
BAT – Trading in a Descending Channel During a Downtrend; Awaiting a Clear Breakout
BAT (Basic Attention Token) is in a Downtrend across all time horizons (Short-, Medium-, and Long-Term). Head & Shoulder pattern (bearish reversal) completed in August, when price broke a neckline and this pattern played out in its typical fashion (down). Confirming the Downtrend was a Death Cross on October 21. Price is trading below all major SMAs, which creates plenty of resistance overhead. Since September, BAT has been trading in a Descending Channel, which could be traded (Buy Support trendline, Sell Resistance trendline). Although RSI and MACD momentum indicators have perked up recently, it is likely just a pullback in an overall Downtrend. At 27, ADX (measures trend strength) still indicates Strong Downtrend (strong between 25 and 50), although it has weakened lately from 41 on Nov 6. Price is butting up against the Channel Resistance trendline currently; if it breaks through, it could go to the next Resistance level at 200-Day SMA at ~ $0.24.
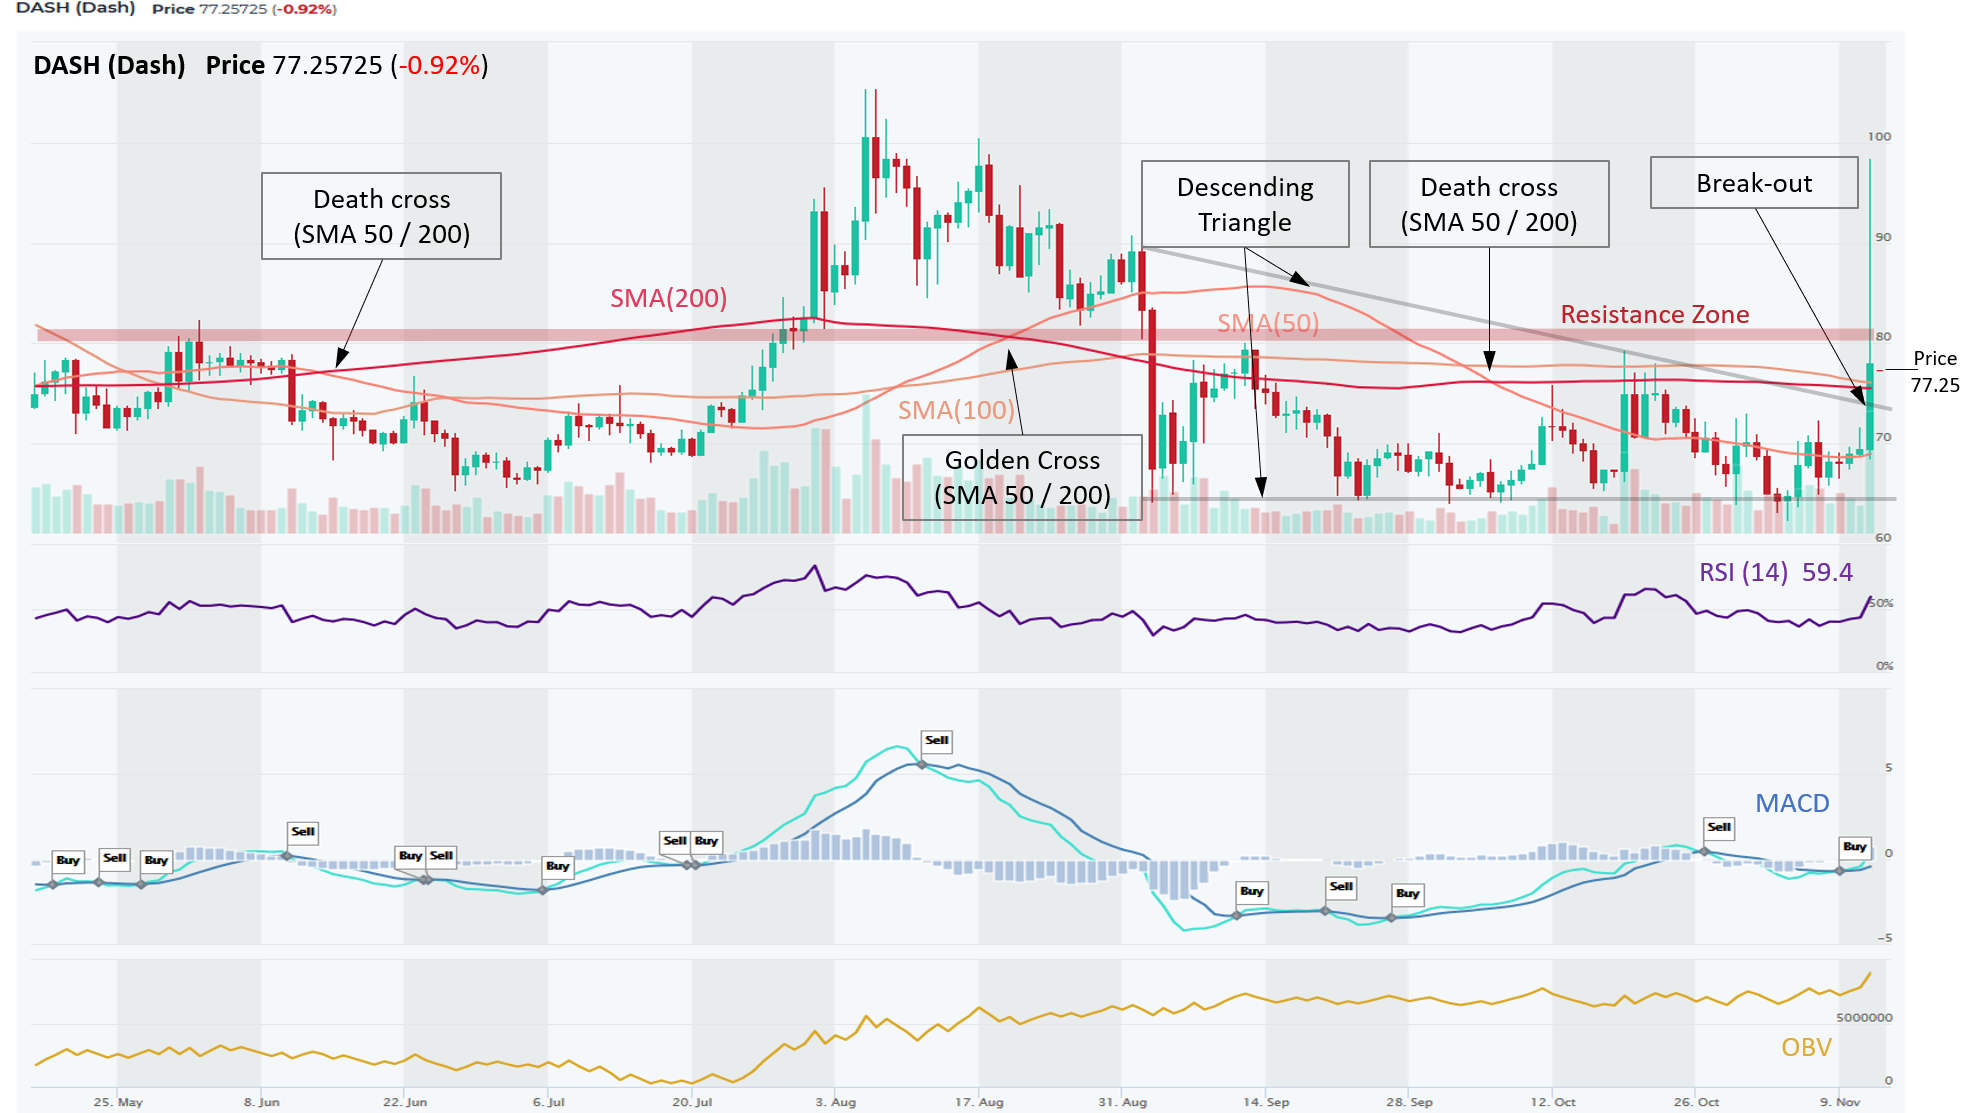
DASH – Descending Triangle Resolved in a Massive Bullish Breakout, But is it Real or just “Dumb Money”?
DASH (Dash) is in a Long- and Medium-Term Downtrend, but Short-Term outlook is improving. In early September, the coin started to form a Descending Triangle pattern, which is typically a bearish formation. This pattern was completed on November 12, when DASH had a monstrous bullish breakout, touching ~$100, and with big volume. The news that propelled DASH coin appears to have been about an unrelated company DoorDash, which filed for an IPO under a planned stock ticker: DASH. This raises the question of how sustainable this breakout price action really is. The breakout candle has a long upper wick, which suggests that after buyers aggressively pushed the price up, the sellers stepped in. This long upper wick tends to be followed by a retreat in price, so we could see DASH consolidate. It would be bullish if it stayed above the Trendline Resistance ~ $74. Since DASH blew through several resistances (trendline, 200-Day and 100-Day SMAs), they now turned to support. DASH still enjoys relatively strong support level at ~$65, which is holding since early September.
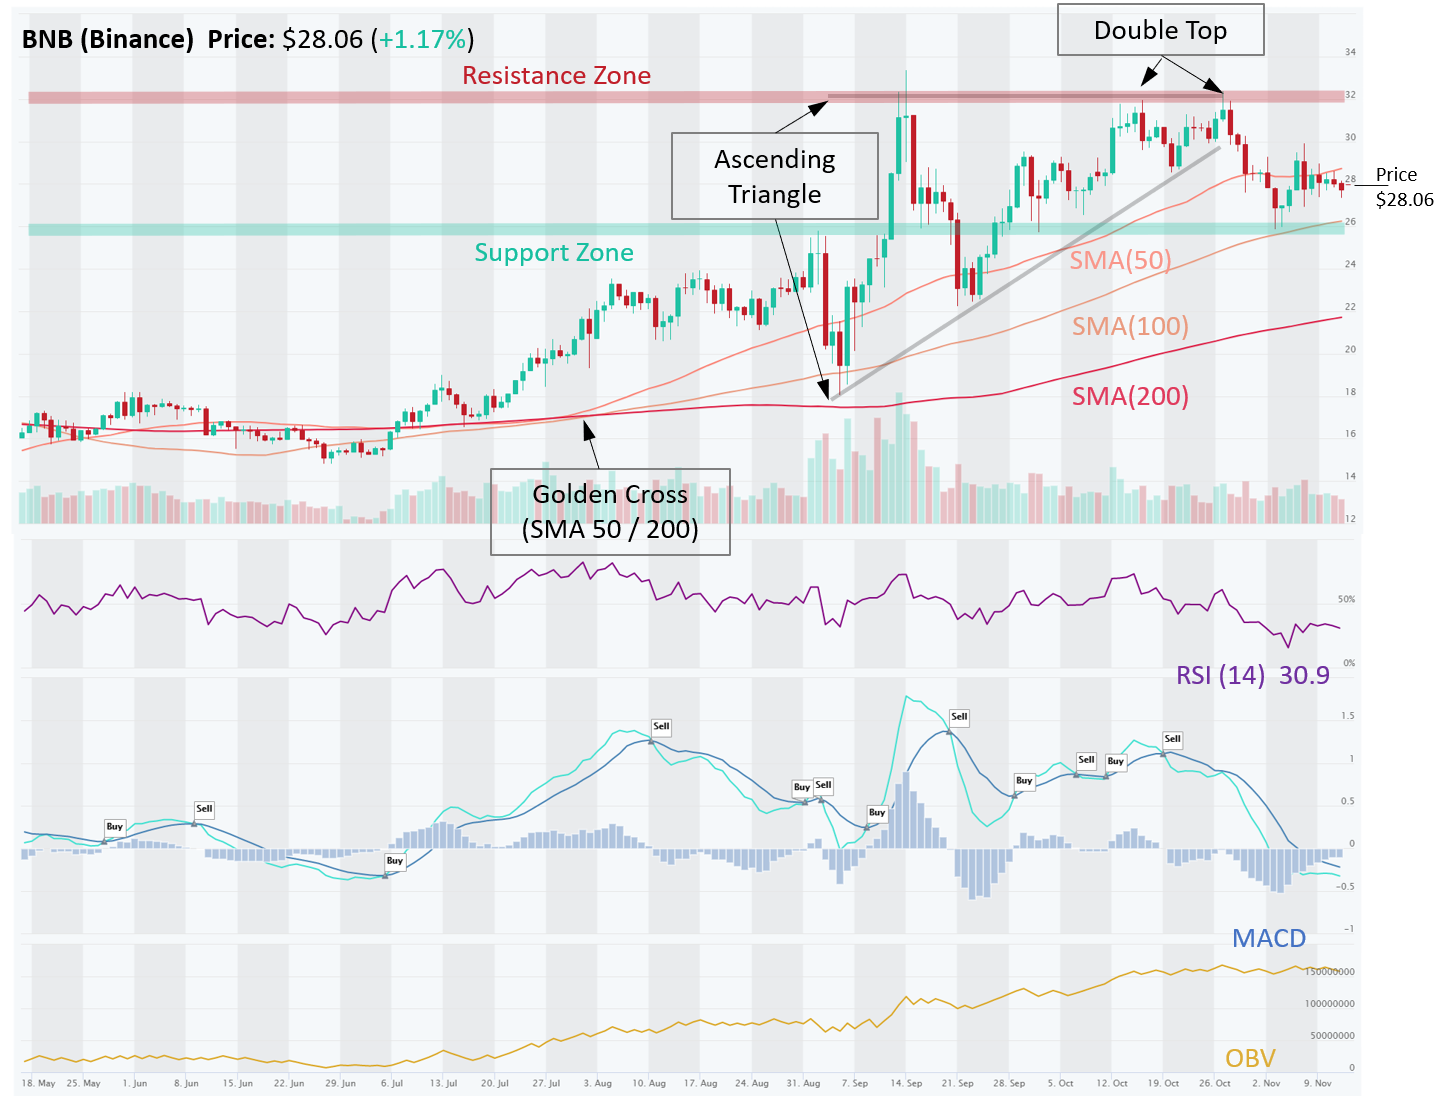
BNB – In a Consolidation Phase of a Long-Term Uptrend
BNB is in a Strong Long-Term Uptrend although Short Term Downtrend. After forming an Ascending Triangle, it broke through the lower triangle trendline. Ascending Triangles are typically bullish continuation patterns, meaning they typically resolve in an upward breakout. This one did not. It also formed a Double Top, which is a bearish reversal pattern, which coupled with a Sell signal from MACD momentum indicator on Oct 19 provided an early warning of a reversal. More recently, it rebounded from a Support Zone at ~$26. There remains a strong Resistance Zone around $31, which the price needs to break before it can resume its uptrend. It does appear oversold (RSI = 30, CCI = – 64) and also interestingly the OBV is stable, indicating that volume on Up days has exceeded or matched volume on Down days. Hence, bulls are still interested in owning BNB on this pullback. This still looks like mere consolidation phase of an Uptrend.
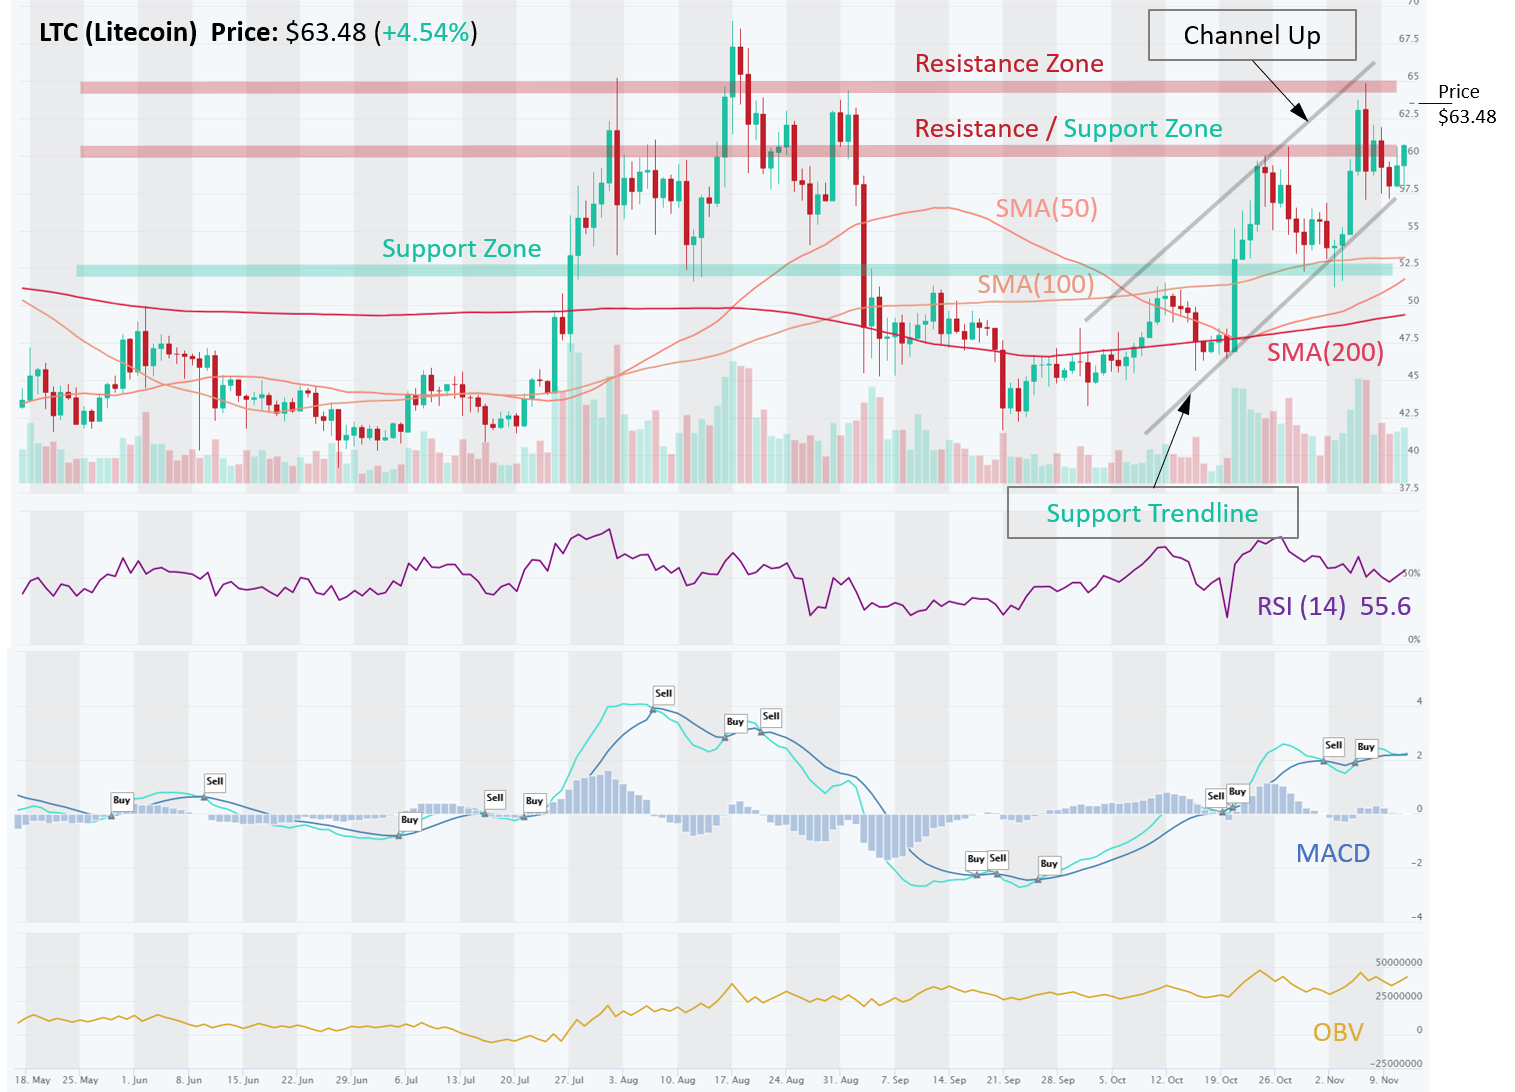
LTC – Trading in a Solid Up Channel, Has the Potential to Moon With Demand From PayPal Users
LTC is in an Uptrend across all three time horizons (Short, Medium, Long). Short term trend is highlighted by Higher Highs and Higher Lows, which also form a Channel Up trading pattern. Trend following traders would simply stay put, riding this uptrend until it breaks below the Channel Support Trendline. Swing traders could trade the channel (Buy Support Trendline and Sell Resistance Trendline). Following a PayPal announcement on Oct 21st (enable 350M users to trade four coins including LTC), the price broke through the Resistance Zone (~ $50 to $52), which then turned into a Support Zone, a critical TA concept known as Polarity. PayPal’s impact is just getting started as the company gradually enables more users to buy crypto assets. Also, due to demand, PayPal recently raised the max amount users can buy from $10K to $15K. Momentum indicators, MACD and RSI, remain bullish (MACD crossover and RSI > 50), yet not overbought. LTC is headed for the next modest Resistance Zone around $65, which if it clears, price could surpass this year’s highs of $68.
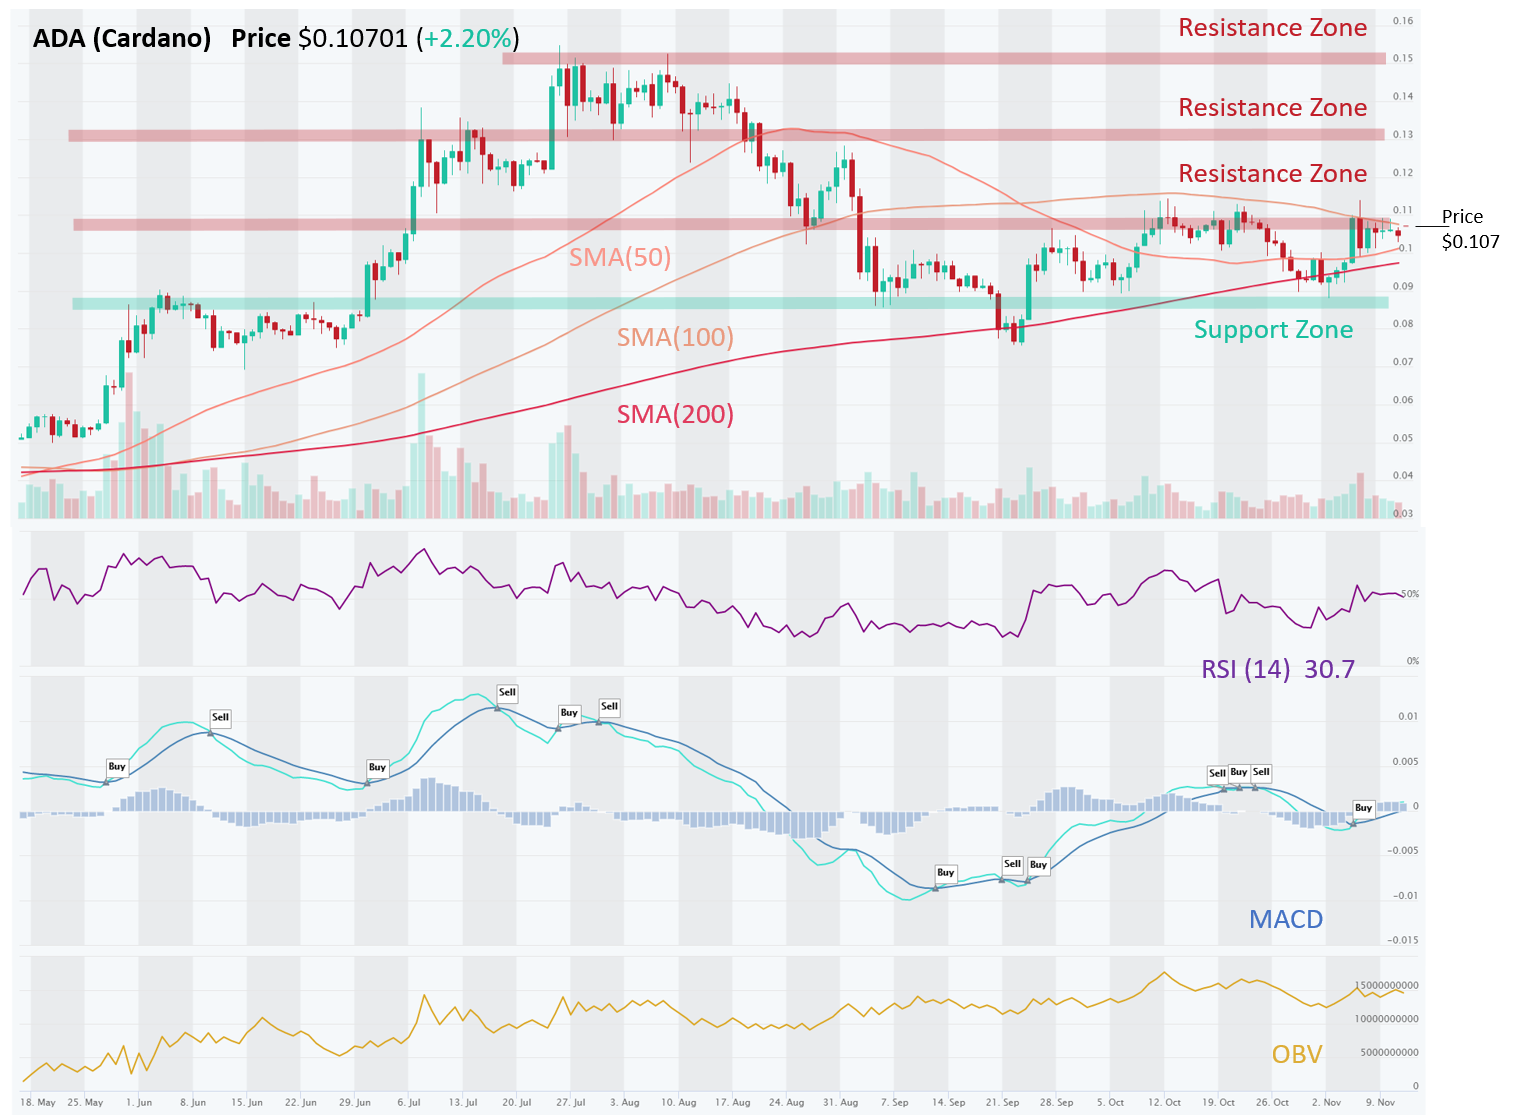
ADA – Trading in a Sideways Channel, Though Pushing Up Against Resistance
ADA remains in an Uptrend on a Long-Term basis, but Medium and Short-Term trends have been broken, and the price appears stuck in a sideways channel between a Resistance Zone (~ $0.11) and Support Zone (~$0.09). These also happen to be the levels for 100 Day and 200 Day SMAs currently, reinforcing the sideways channel pattern. Traders could trade this channel (Buy Support Sell Resistance) but a more potent signal is a breakout (Up or Down). Price has been butting up against the Resistance around $0.11 for several days now. If it manages to break through $0.11, it could then rise to the next resistance of $0.13 and then $0.15 afterwards. Momentum recently turned bullish (MACD, RSI), although volumes have declines (OBV).
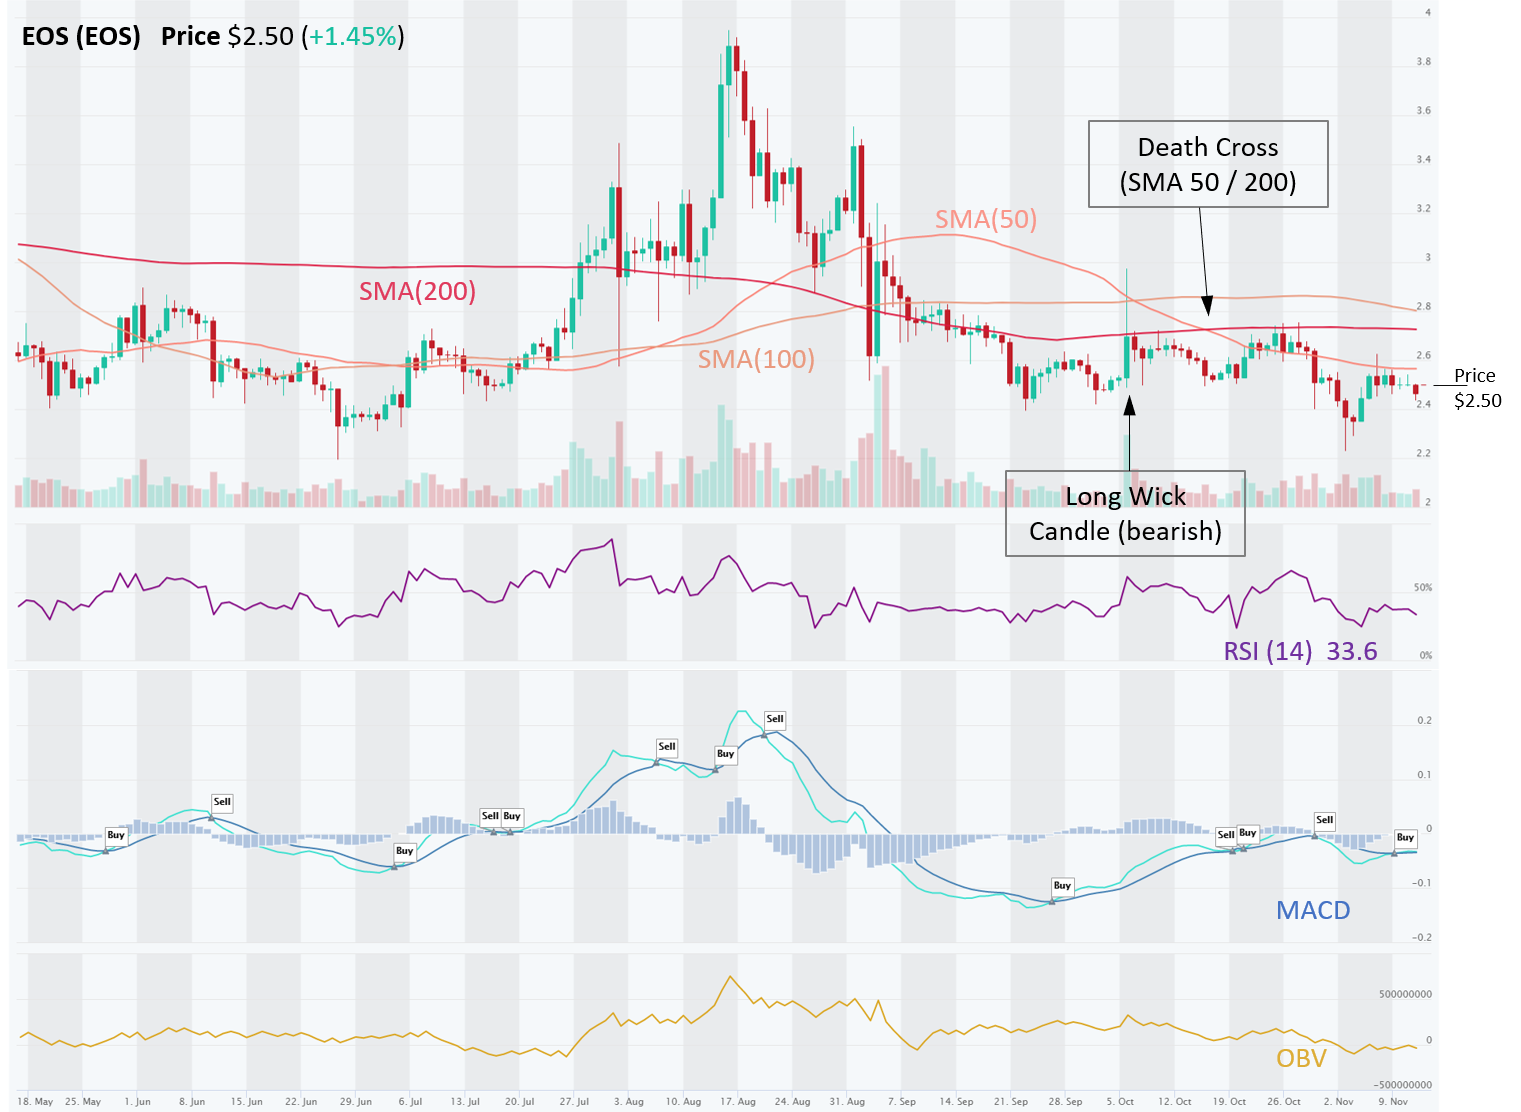
EOS – Downtrend Approaching a Strong Support Zone
EOS is in a clear Downtrend across all three time horizons (Short, Medium, Long-Term). 200 day SMA is acting as a strong Resistance (~ $2.70) where price was rejected twice in October. Notice a long wick candle on Oct 6. Price tends to go in the opposite direction thereafter. A long tail on the top part of a candle suggests that the market made a significant rise then quickly retreated because sellers overwhelmed the buyers. This is a bearish signal. That was followed by a Death Cross (SMA 50 / 200) on Oct 17 and the price was again rejected at the 200 day SMA, the Resistance zone. It’s been all downhill for EOS since then. It is near a decent Support Zone around $2.35, which it is likely to reach. It could find a footing there and bounce as it has on several occasions this year, but don’t bet on it, the Downtrend is too clear to bet on a reversal just yet.
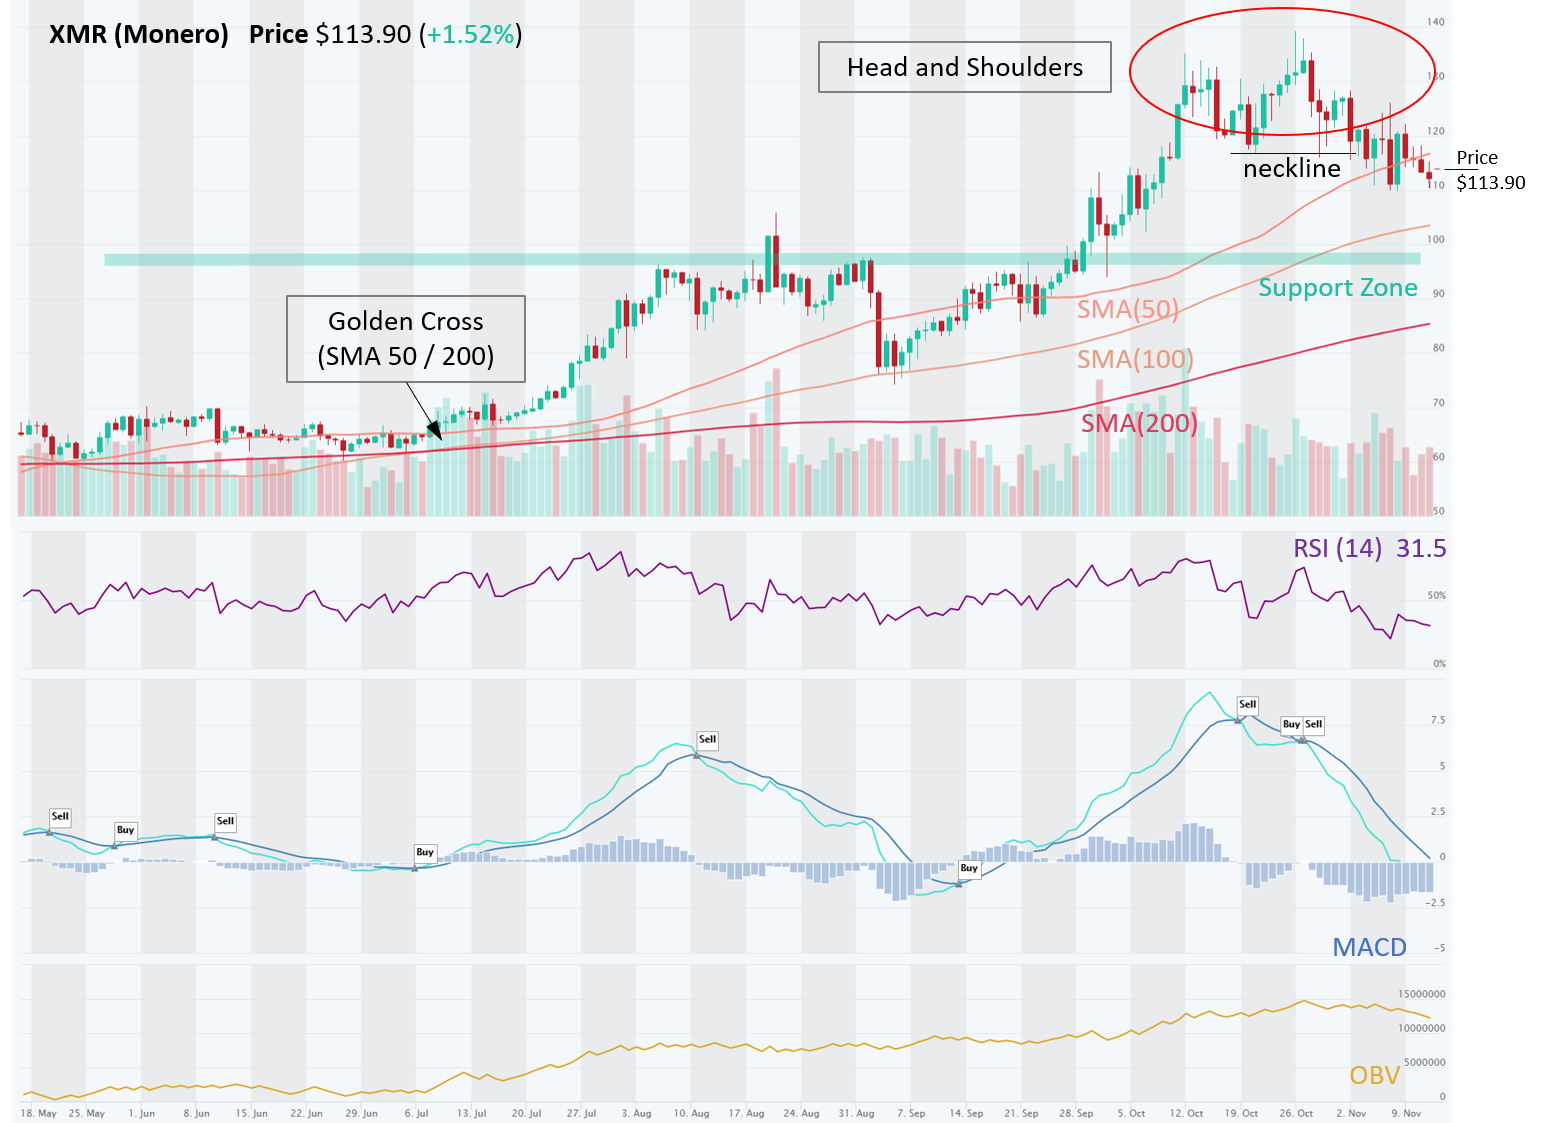
XMR – Consolidating After a Big October Run; Bearish Head and Shoulder Pattern Signaled Reversal, Approaching Better Entry Point
XMR is in a solid Uptrend on Medium- and Long-Term basis, but Downtrend on Short-Term basis as the coins is experiencing a correction after a great run in October. A similar consolidation happened after its July run, so be prepared to jump back in. There’s a solid Support Zone around $97-$103, where it could fall to before it heads back to it’s highs this year of $140. It also appears to have made a Head and Shoulders pattern, which tends to signal a trend reversal or at least a pause. That again points to a better entry point around the above mentioned Support Zone. Momentum (MACD, RSI) is also bearish currently, and OBV trend has deteriorated, indicating that volume on Down days has exceeded volume on Up days….sellers are overwhelming buyers, for now.
Risk management – Stop Loss and trade size. In all of these setups, traders should use Stop Loss orders to manage their downside risk, in case the trade goes against us, as it often will. Trading is about probabilities and even though these setups have a high win rate, one must be prepared to minimize losses on the trades that go bust. If Stop Loss order types are not supported by they exchange, at least set up a price alert (see video). Also, trade size should be such that you never risk losing more than 2% of your total equity. Keeping the trade size small allows the trader to setup a wider Stop Loss, which gives the trade more room and time to complete with success. Setting Stop Loss levels too tight can often result in getting knocked out of a trade prematurely.
Disclaimer: This content is for informational purposes only, you should not construe any such information or other material as investment, financial, or other advice. There are risks associated with investing in cryptocurrencies. Loss of principal is possible.