Trading Chart Patterns in Cryptocurrencies: Resistance Breakout (BAT example)
Trading Chart Patterns in Cryptocurrencies
We’ve prepared a video illustrating how to trade a Resistance Breakout pattern, using BAT as an example.
Among altFINS’ unique features is an automated chart pattern recognition system, which identifies 16 common chart patterns on four time intervals (1D, 4H, 1H, 15min).
Key levels (horizontal support and resistance) are pillars of technical analysis because these are areas where a lot of trading action happens!
Now, you could look at thousands of charts across multiple time intervals to identify support and resistance levels, or you can use our automated chart pattern recognition to save a ton of time.
Let’s take a look at some of examples of trade setups, which have achieved over 70% success rate in backtests.
There are three ways to trade key levels:
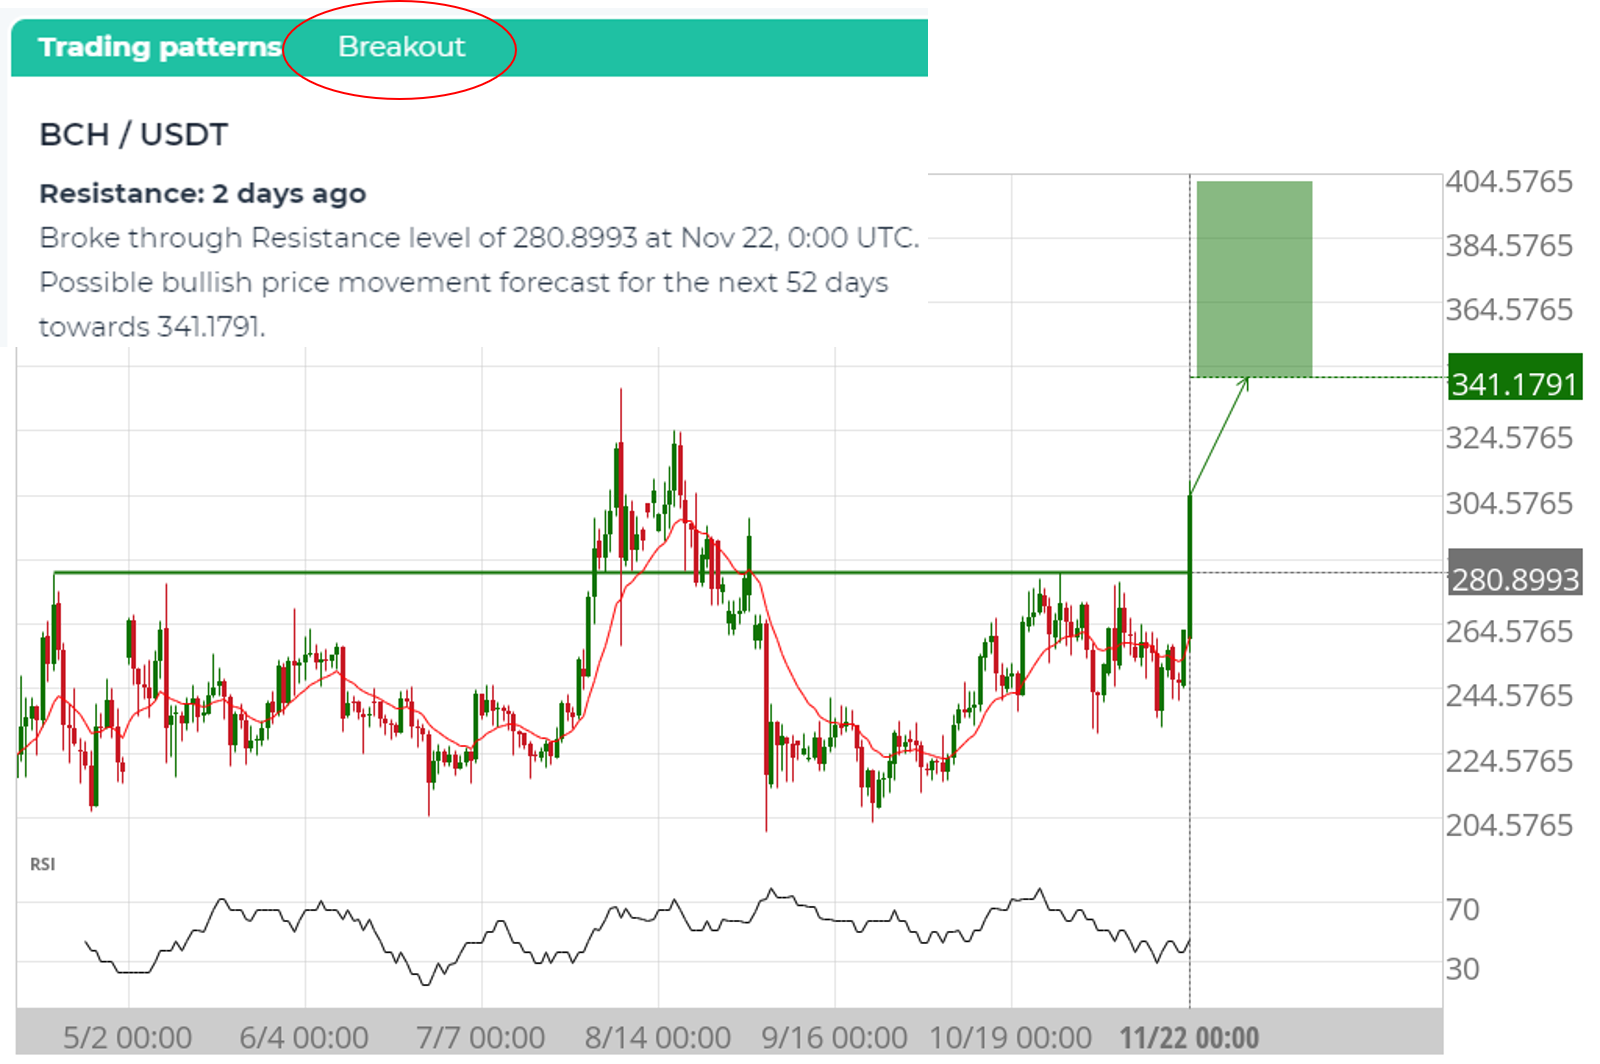
(1) Key level breakout.
If the price breaks through a key level, it tends to continue in its path for a while. Thus, traders would Buy breakouts through Resistance level (example below), and Sell breakouts through Support levels.

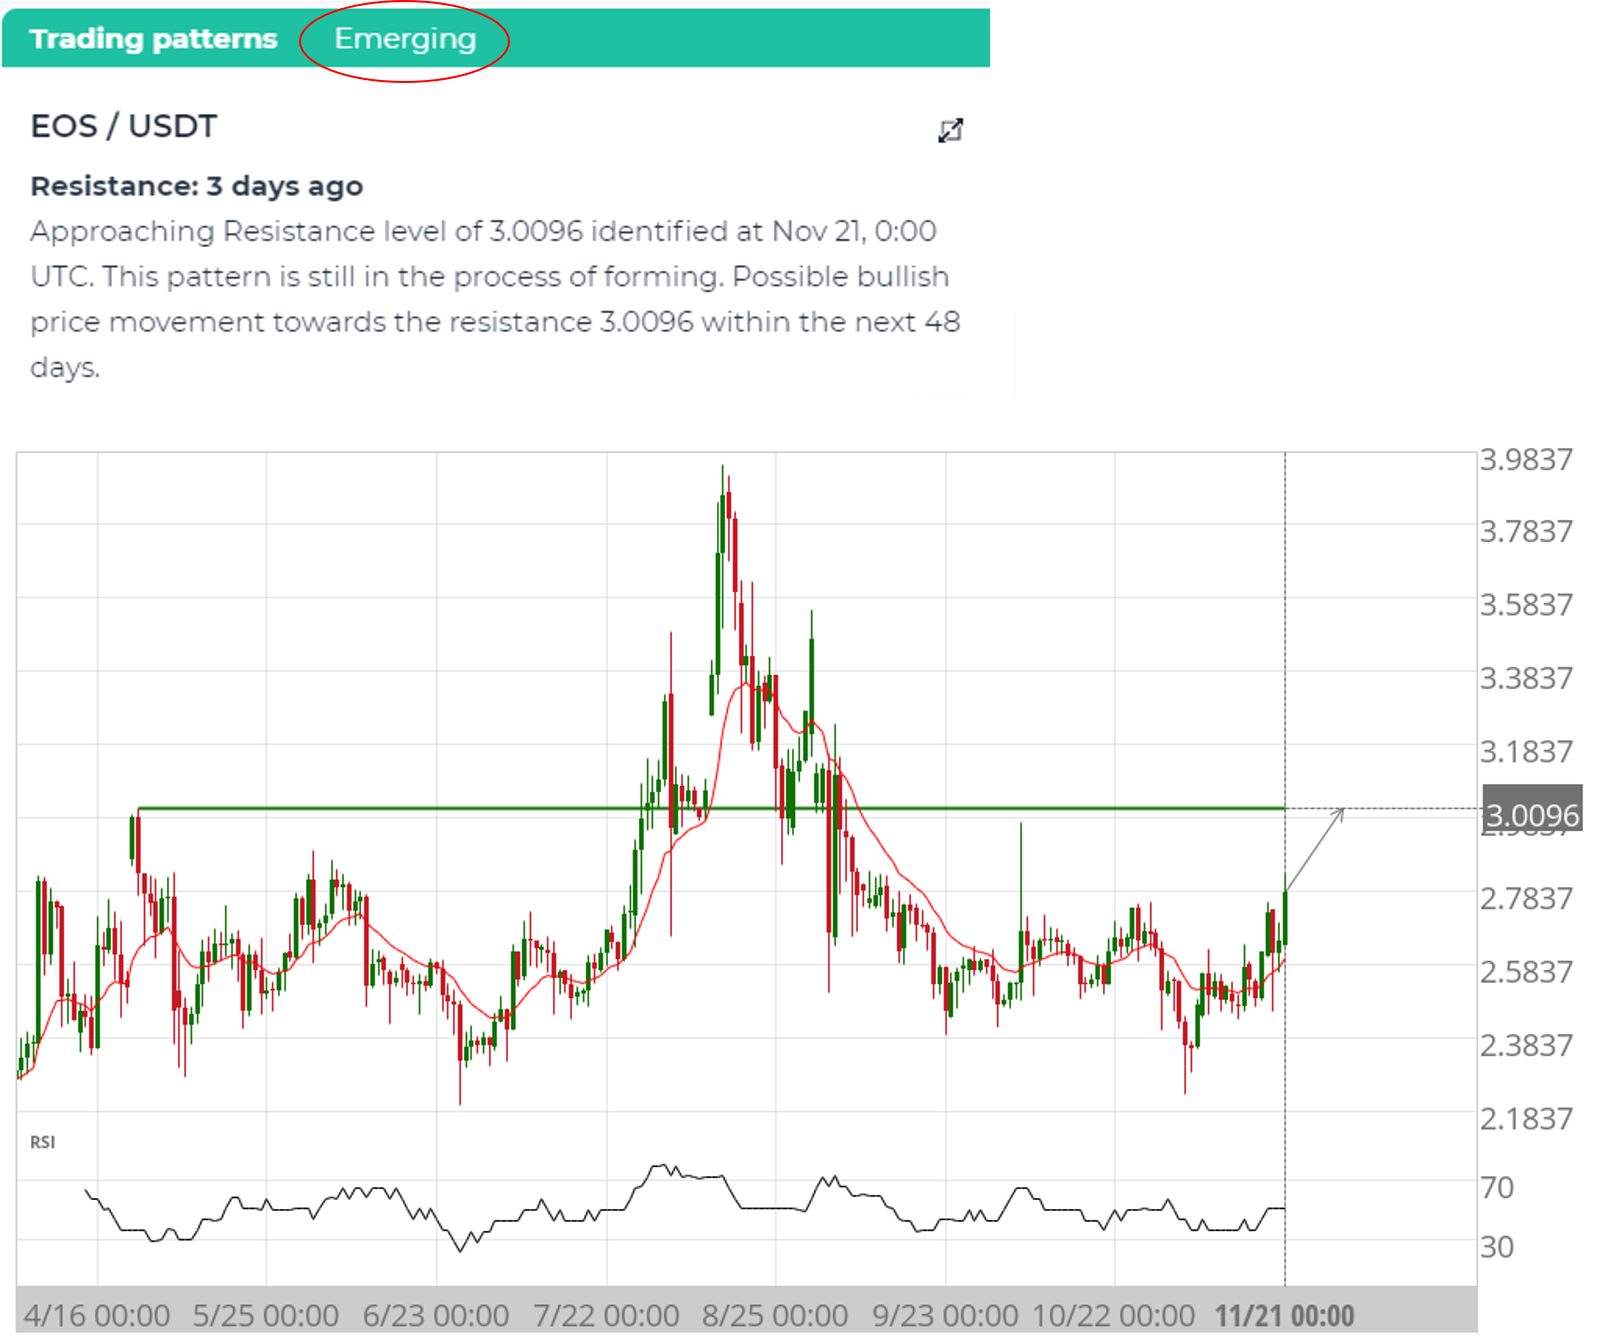
(2) Key level approach (aka Emerging pattern).
Prices tend to retest support and resistance levels, until broken. Thus, traders can Buy when a coin price is approaching Resistance (as in the example below), and Sell when approaching Support.

(3) Key level bounce.
Another possible setup is to wait for the price to enter the Support zone and Buy it then, since most of the time it will bounce off the Support level. Vice versa, traders can wait for the price to enter the Resistance zone and Sell (or short) it then, since it’s most likely to bounce back down.
Check out current trading chart pattern opportunities here
Check out video on how to trade an Ascending Triangle pattern.
Here’s also a great chart pattern cheat sheet.
Using altFINS’ automated pattern recognition system, you can search for patterns by coin or pattern type. Watch this 23 sec video to learn how:
Keep an eye on your time intervals. Beginners should work with longer intervals like 4h and 1d.
Also, keep these trades on for the length of one trade pattern, or until it reached the target profit or Stop Loss level.
Read more on identifying and trading chart patterns in our knowledge base and tutorial.
Download altFINS Mobile App
Follow us on:
✅ Telegram: https://t.me/altfinsofficialchat
✅ Twitter: https://twitter.com/AltfinsA
✅ Discord: https://t.co/uBvlTWgRgP
✅ Facebook: https://www.facebook.com/altFINS
✅ YouTube: https://t.co/QCvKBODSKH
✅ Reddit: https://www.reddit.com/user/altFINS_official
✅ Instagram: https://www.instagram.com/altfins_altcoins/
✅ LinkedIn: https://www.linkedin.com/company/altfins
Risk management – Stop Loss and trade size. In all of these setups, traders should use Stop Loss orders to manage their downside risk, in case the trade goes against us, as it often will. Trading is about probabilities and even though these setups have a high win rate, one must be prepared to minimize losses on the trades that go bust. If Stop Loss order types are not supported by they exchange, at least set up a price alert (see video). Also, trade size should be such that you never risk losing more than 2% of your total equity. Keeping the trade size small allows the trader to setup a wider Stop Loss, which gives the trade more room and time to complete with success. Setting Stop Loss levels too tight can often result in getting knocked out of a trade prematurely..
Disclaimer: This content is for informational purposes only, you should not construe any such information or other material as investment, financial, or other advice. There are risks associated with investing in cryptocurrencies. Loss of principal is possible.

1 Comment
Aqib yasin March 20, 2021
Nice info