This Bullish Indicator Could Signal Trend Reversal: Dragonfly Doji
Crypto took a nosedive on Monday and has been declining steadily since April highs. In fact, most altcoins are now down 70% from those April levels and some are even lower than post FTX collapse!
We have highlighted how to profit from a downtrend in prior newsletters and blogs (here and here).
But we’ve just noticed a candlestick pattern that could suggest that market is poised to reverse trends, at least temporarily.
It’s called Dragonfly Doji.
TIP: use altFINS Screener to scan for over 30 candlestick patterns. Read tutorial.
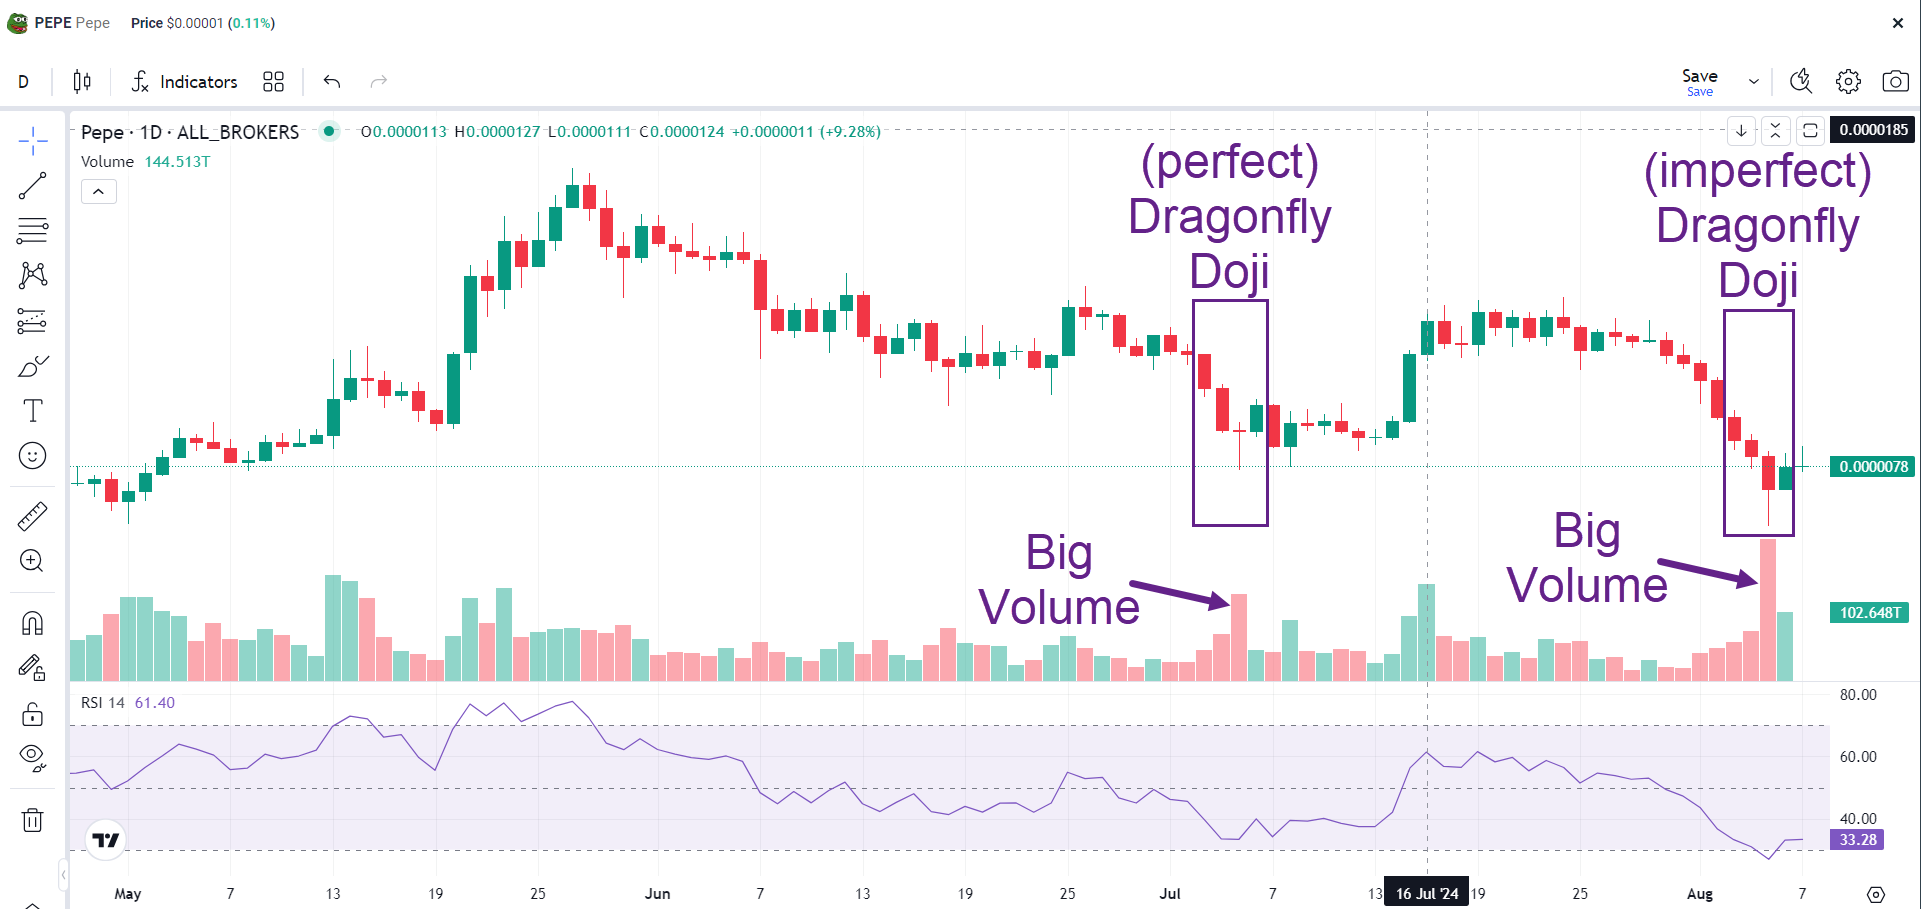
Here’s price chart for PEPE with one perfect Dragonfly pattern and recently one imperfect Dragonfly pattern.
PEPE: Dragonfly Doji

Source: altFINS
Dragonfly Doji can signal a bullish trend reversal.
It consists of two down (red) candles, one doji candle with long downwick, followed by a up (green) candle.
The long downwick candle indicates that after sellers pushed down the price, buyers stepped up and bought it back up almost where it started the day. And that buying followed through the following day (green up candle).
Also, notice the elevated, above average volume on that Dragonfly Doji. That’s another indication that sellers were exhausted and new buyers bought up of lot of volume.
This signal worked perfectly in early July.
Will it repeat again?
Notice also that after the Dragonfly Doji appeared, the price still had a few bumps before it took off higher.
And that could be what’s ahead of us. A bounce, some retracements, but eventually a steady rise higher.
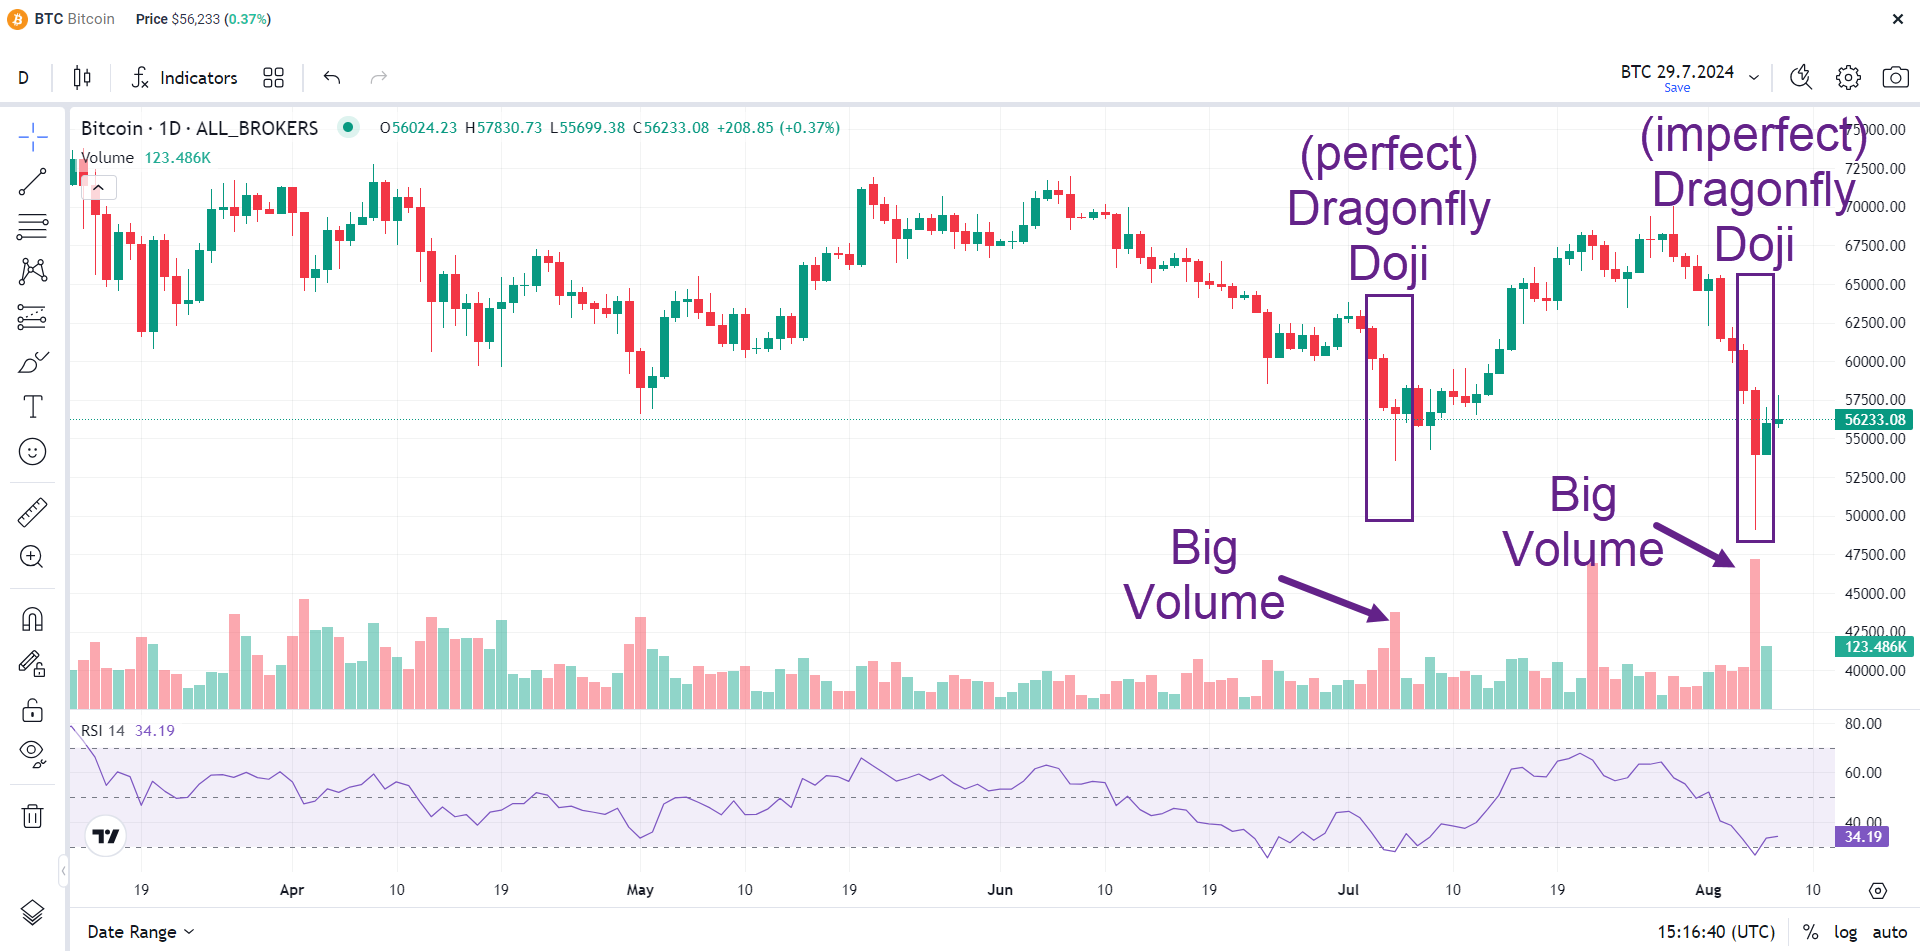
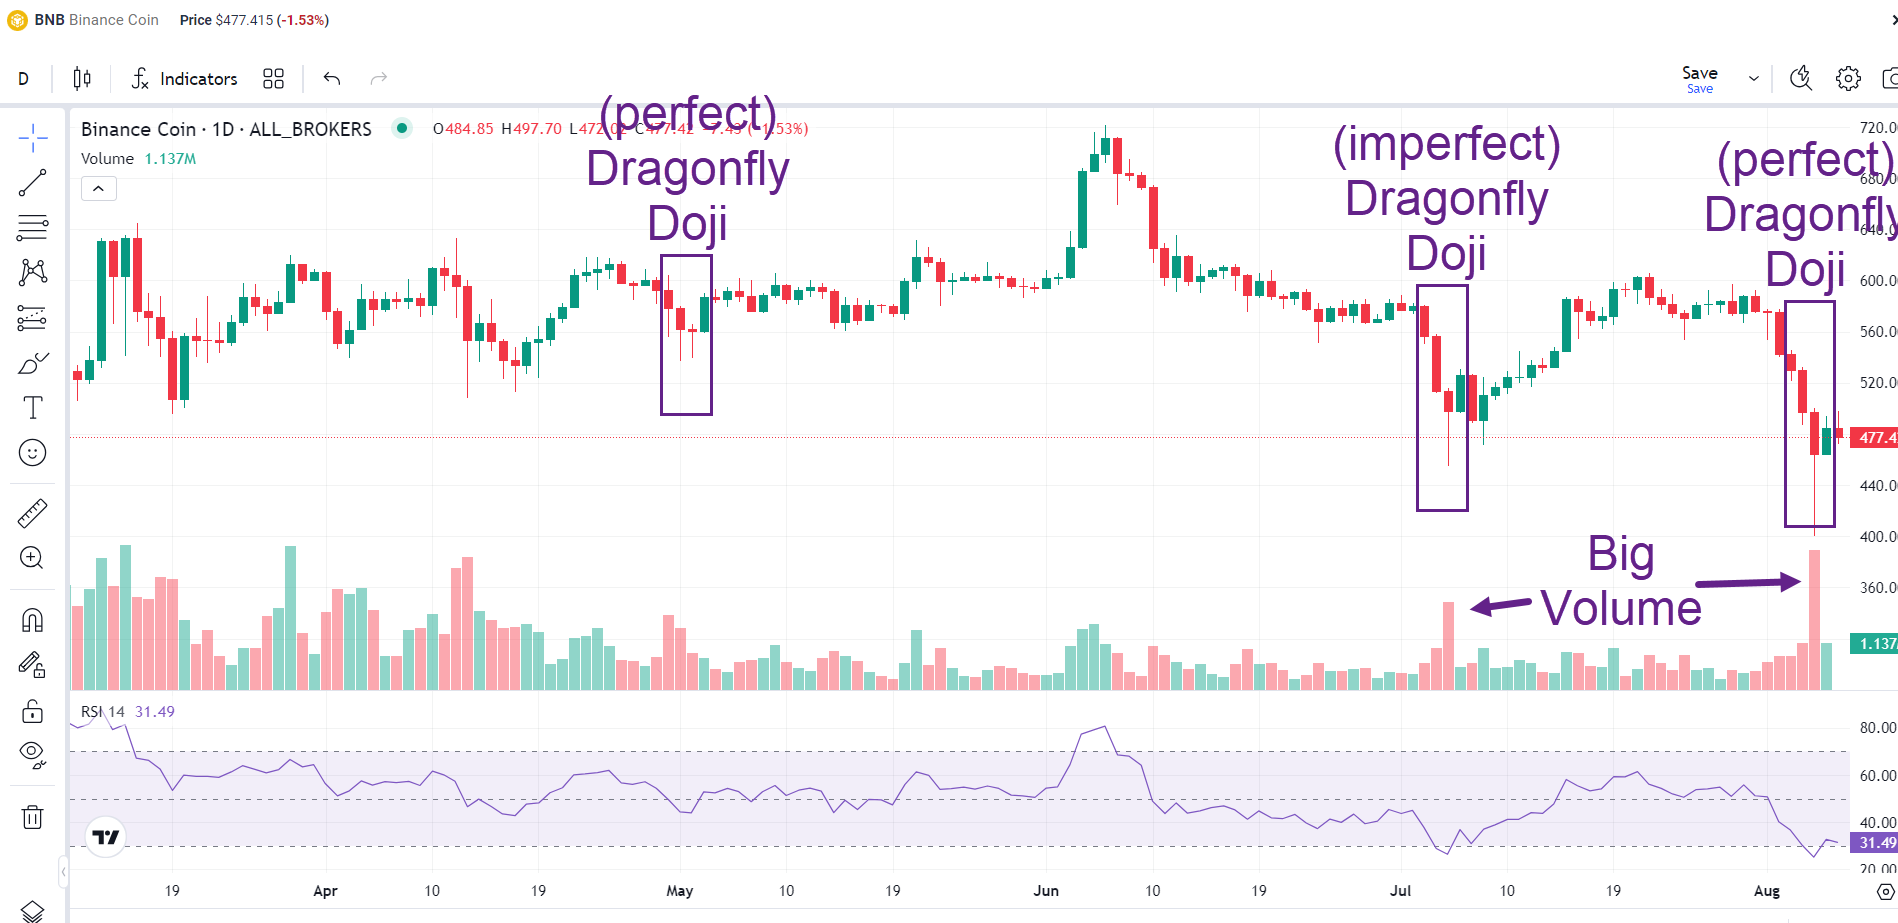
We’re seeing this candlestick pattern in many charts:
BTC: Dragonfly Doji

Source: altFINS
BNB: Dragonfly Doji

Source: altFINS
Join our VIP telegram group to get the best trade signals and expert tips.
You can scan thousands of crypto assets to find over 30 candlestick patterns. Read tutorial.


0 Comments
Leave a comment