How to Profit from Market Corrections?
As the crypto market goes through a correction, our AI-based Chart Pattern recognition system is identifying nice winners…on the sell side.
Here are AI-based trade signals that our system identified recently and generated +30%, +25%, +24%, +38%, +18%, +24%, +28% and +32% profit. (see trade signals below)
When price is in a downtrend and gets rejected at resistance, there tends to be a follow through weakness and further decline in price.
Traders can profit from price declines by Short Selling.
We teach Short Selling and how to find assets for short selling in Lesson 10 of our new Crypto Trading Course, which covers 7 trading strategies for any market stage, as well as risk management and leverage trading.
It has received some raving reviews! (check here)
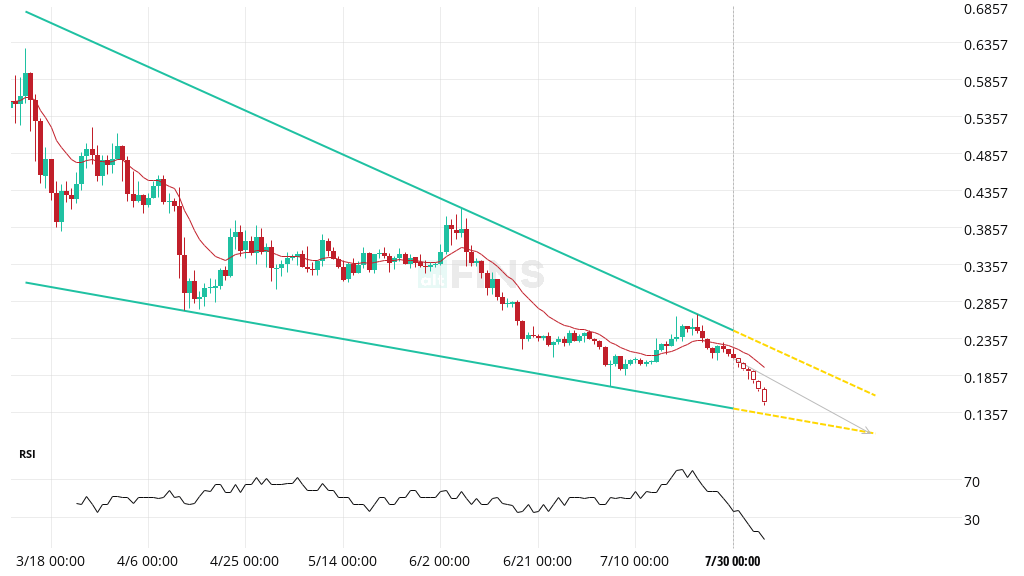
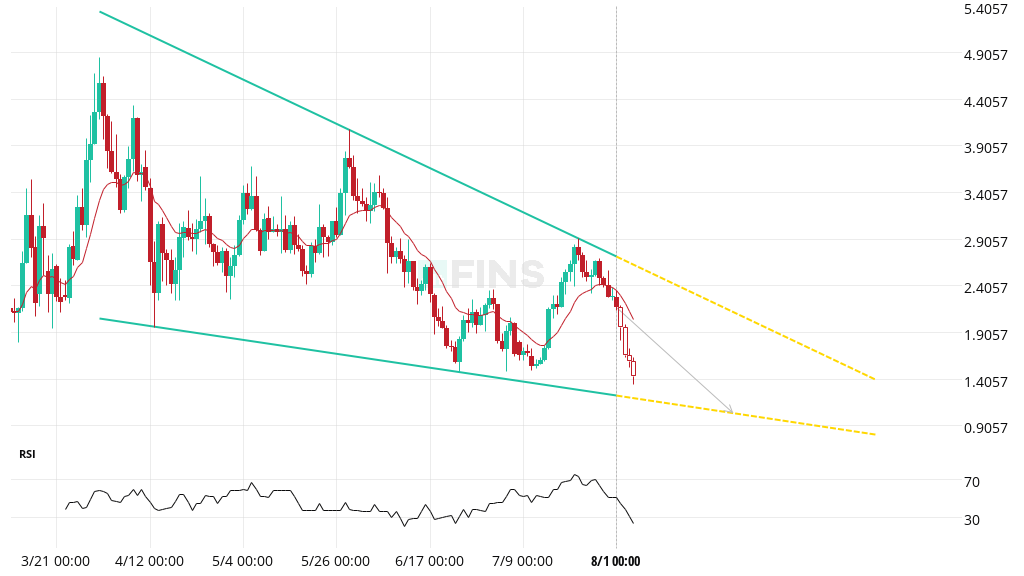
MBOX: Falling Wedge
(+30% Profit)
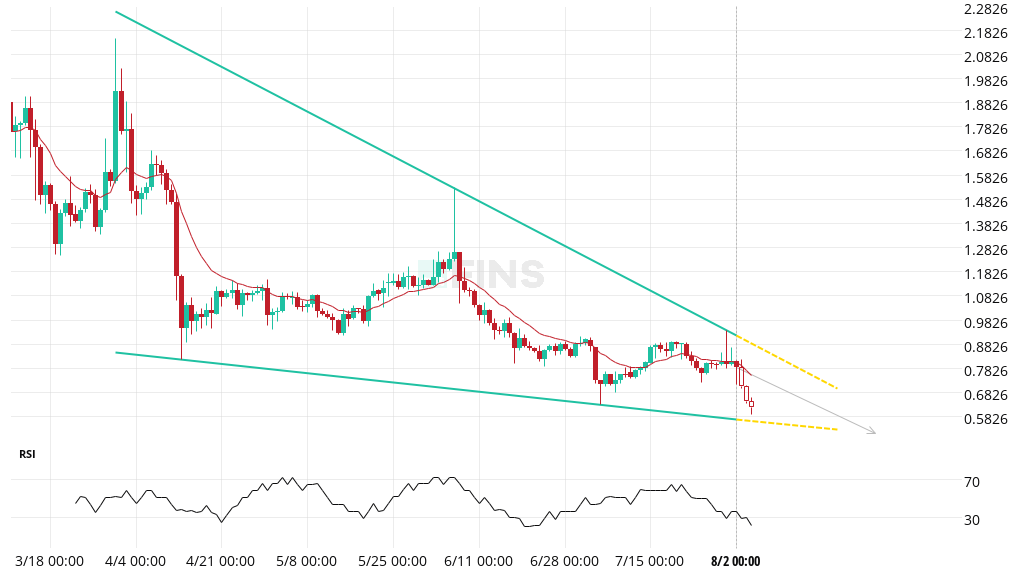
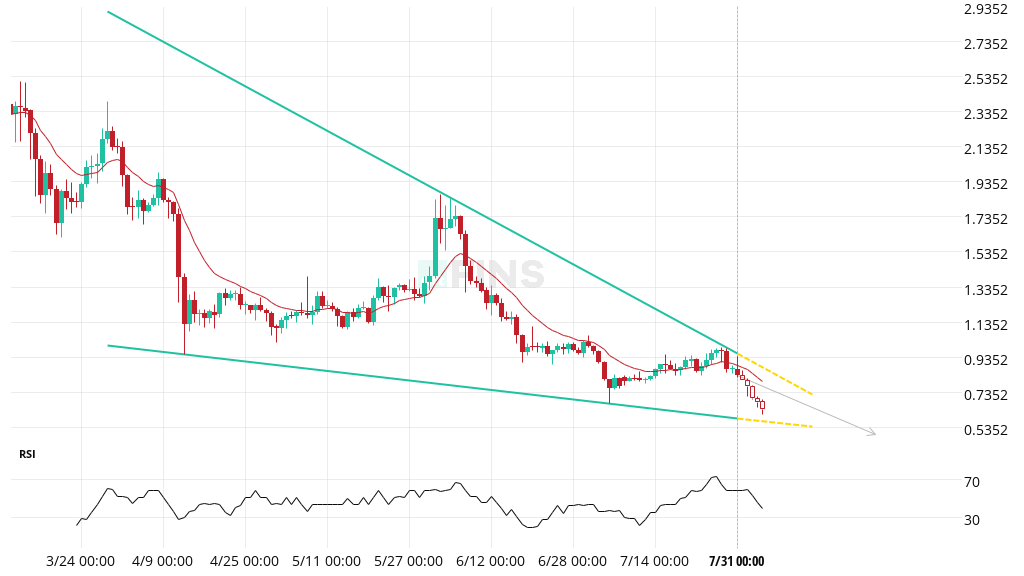
LQTY: Falling Wedge
(+25% Profit)
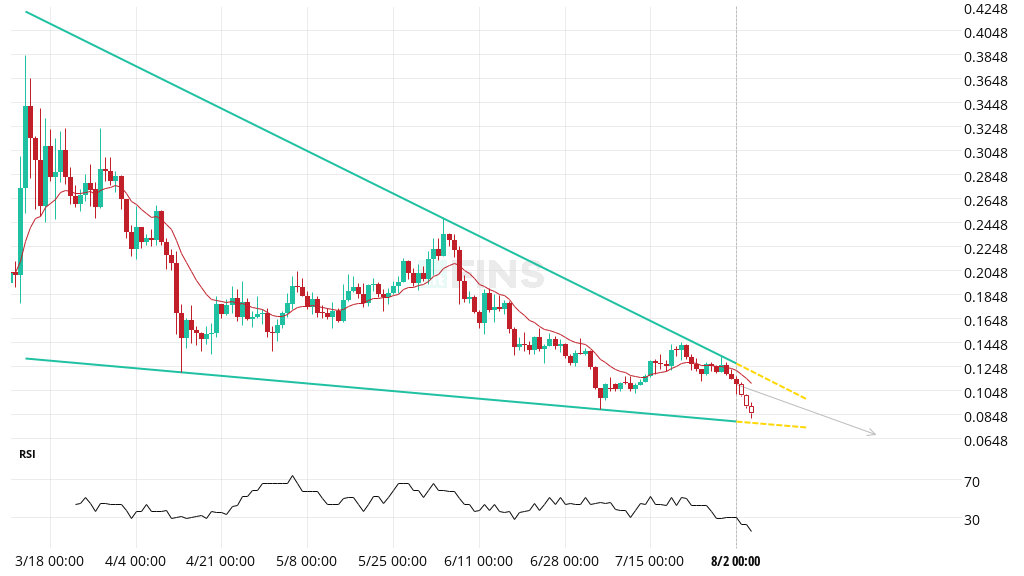
VANRY: Falling Wedge
(+24% Profit)
WIF: Falling Wedge
(+38% Profit)
GTC: Falling Wedge
(+32% Profit)
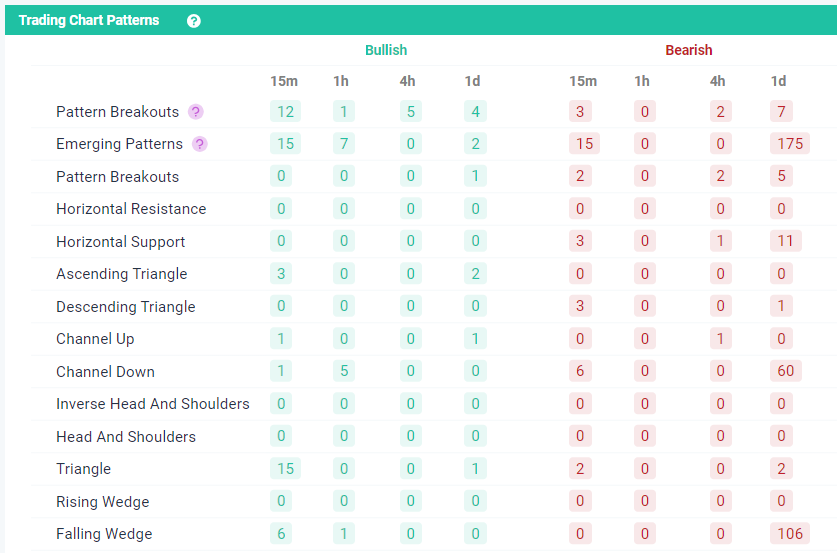
altFINS automatically detects 26 pattern types across 4 time intervals (15m, 1h, 4h, 1d) for hundreds of assets.Save hours and hours of your time manually scanning charts!
Traders can easily monitor all trading signals in our Signals Summary section:
Don’t ever miss a trade signal and create an alert for Chart Patterns.
We teach trading Chart Patterns in Lesson 8 of our new Crypto Trading Course, which covers 7 trading strategies, margin trading, short selling and risk management.
☑ Watch a free Tutorial Video: Custom Chart Pattern Filters!
In this step-by-step guide, we’ll walk you through the process of creating and utilizing custom chart pattern filters to enhance your trading strategies.
Watch Tutorial Video
altFINS AI-based Chart Pattern recognition engine identifies 26 trading patterns across multiple time intervals (15 min, 1h, 4h, 1d), saving traders a ton of time, including:
- Ascending / Descending Triangle
- Head and Shoulders, Inverse Head and Shoulders
- Channel Up / Down
- Falling / Rising Wedge
- Double Bottom / Top
- Triple Bottom / Top
- Bullish / Bearish Flag
- Bullish / Bearish Pennant
- Rectangle
- Support / Resistance and other.
Price patterns appear when traders are buying and selling at certain levels, and therefore, price oscillates between these levels, creating chart patterns.
When price finally does break out of the price pattern, it can represent a significant change in sentiment.
Watch this introduction video to learn more about our AI chart patterns.
But how to trade chart patterns?
Beginners should stick with the patterns that are easiest to understand and have the highest success rates.
That means Horizontal Resistance, Ascending Triangle, Channel Down, Falling Wedge, Inverse Head and Shoulders. Those patterns tend to have 67-83% success rate.


0 Comments
Leave a comment