Technical analysis of VET, THETA, ETC
VET – On a Verge of a Bullish Reversal from Falling Wedge Pattern
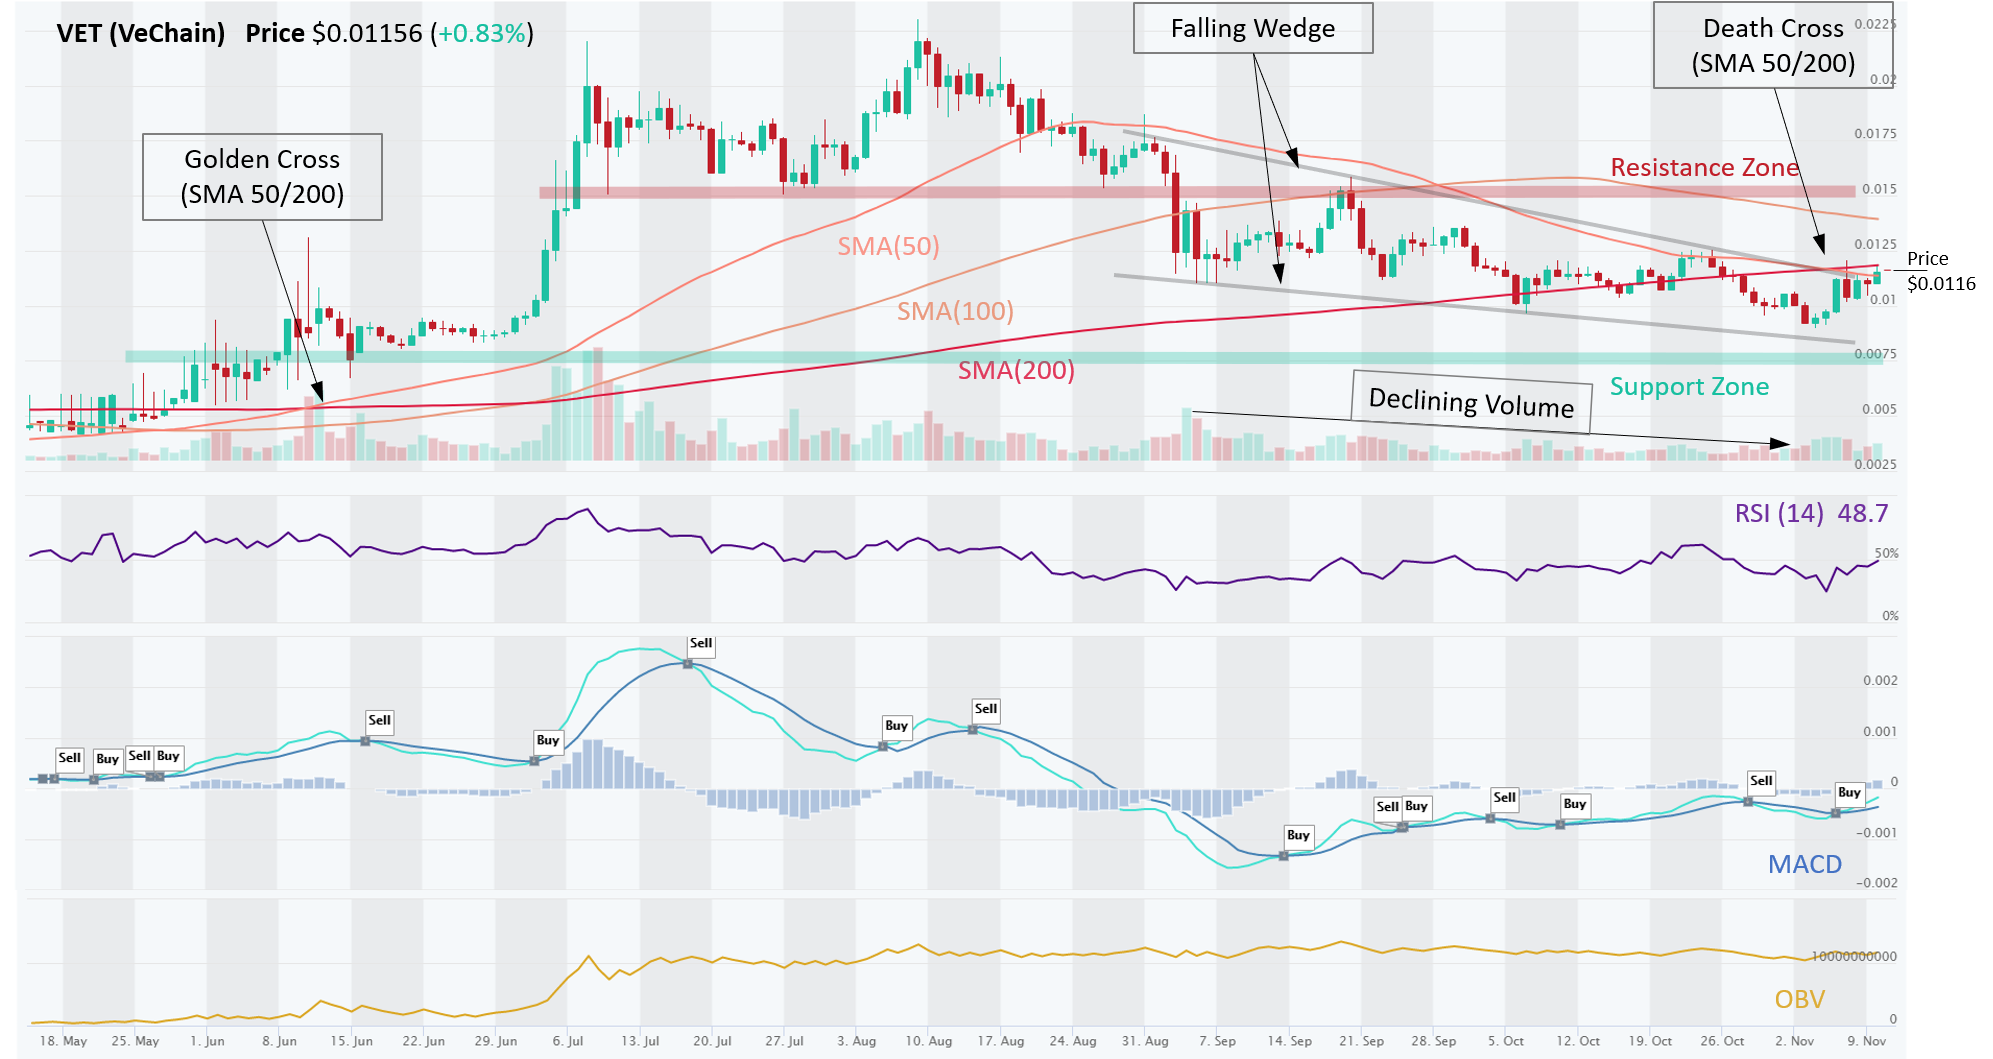
VET (VeChain) is in a Downtrend, as indicated by a recent Death Cross (SMA 50/200) but Short-Term trend is improving. During September and October, price has formed a Falling Wedge, which is a bullish reversal pattern formed by connecting the lower highs and lower lows. It is also typically accompanied by declining volumes, as is the case here. In a Falling Wedge pattern, price starts to trade sideways in more of a consolidation pattern before reversing sharply higher. Recently, momentum indicators (MACD, RSI) have turned bullish and recent uptick in volume lends credibility that price may be at a verge of a breakout. In fact, on Nov 10, the price did break and close just above the trendline (gray line in chart).
Trade setup: A break and close above the resistance trendline would typically signal an entry. For confirmation, traders could wait for another day’s close above that, ideally with decent volume. The next Resistance on the way up would be around $0.015. Stop loss can be placed below the recent swing low (~ $0.009). If the breakout does not occur, price is likely to retreat to the lower trendline and Support Zone around $0.0075.

ETC – Falling Wedge Nearing a Breakout, Could be a Reversal of Downtrend
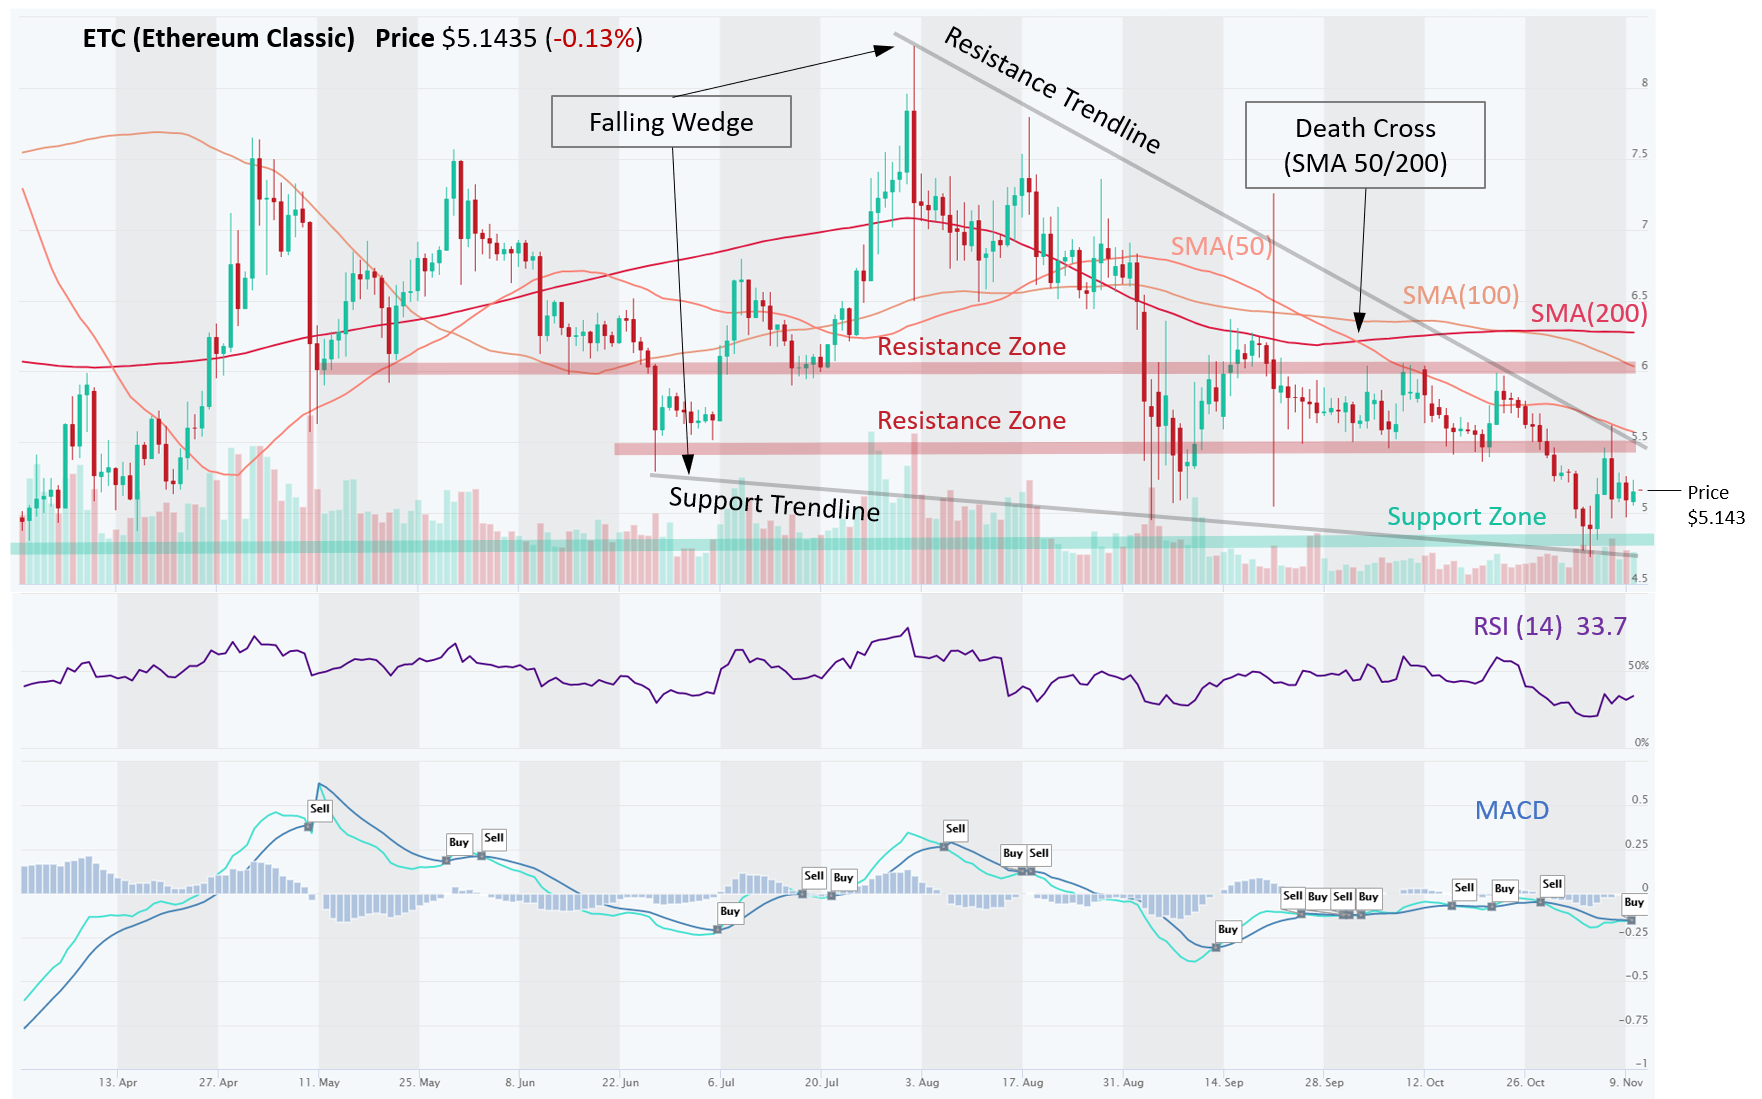
ETC (Ethereum Classic) is in a strong Downtrend and trading below long-term SMAs. Ethereum Classic blockchain suffered three 51% attacks in August. First attack was on August 1, which marked the beginning of a downtrend. The blockchain implemented a defense mechanism on October 13. The price has formed a Falling Wedge, which is a bullish reversal pattern formed by connecting the lower highs and lower lows. It is also typically accompanied by declining volumes, as is the case here. In a Falling Wedge pattern, price starts to trade sideways in more of a consolidation pattern before reversing higher. The Wedge is narrowing and approaching pinnacle; hence a breakout is near, but price is likely to touch the Support trendline first (~$4.75). The Wedge can be traded between the trendlines (Buy Support, Sell Resistance) or traders can wait for a breakout, either Up or Down. A break and close above the resistance trendline would typically signal a trade entry. To be conservative, traders could wait for another day’s close to confirm a breakout, ideally with decent volume. The next Resistance on the way up would be around $5.50. Support Zone is around $5.00-$4.50.

THETA – After a Huge Uptrend, Two Bearish Reversal Patterns Spell Trouble
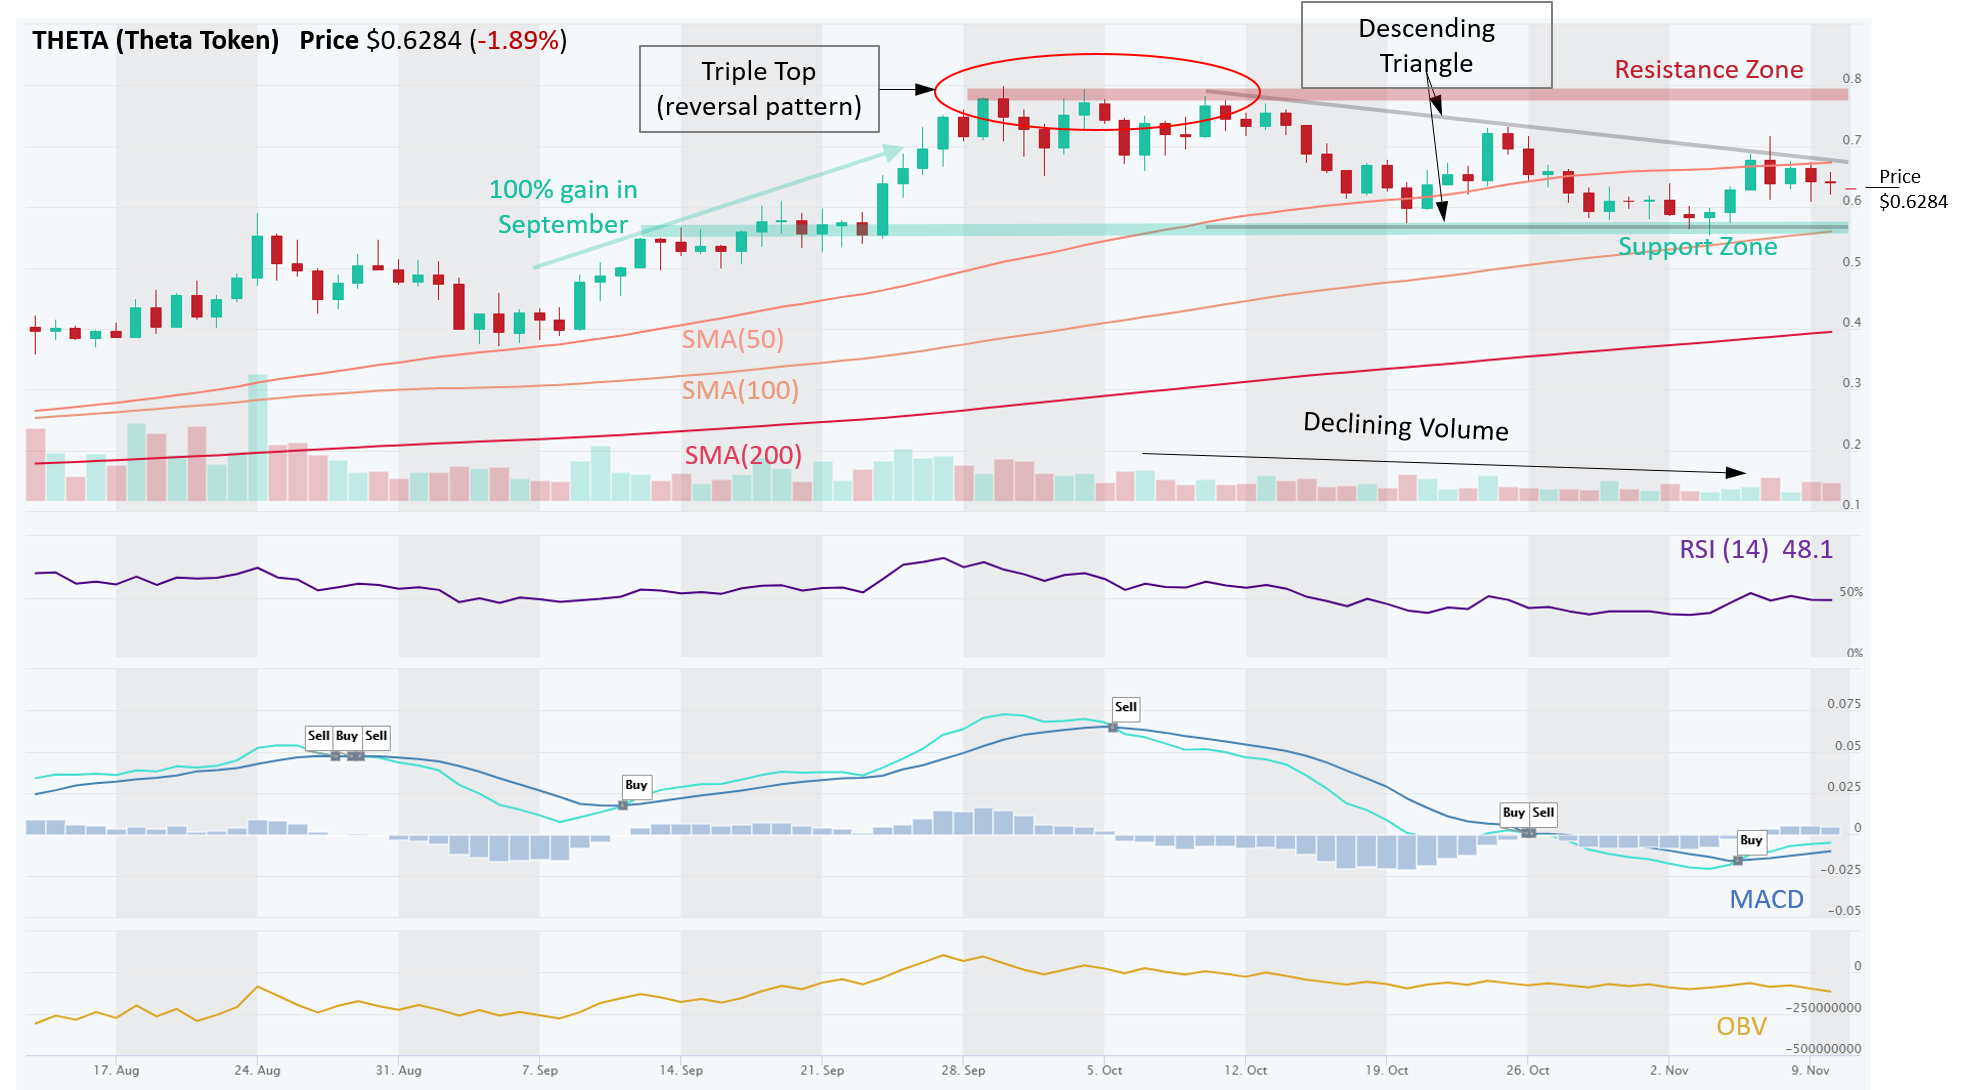
THETA (Theta Token) is still in an Uptrend overall, however, following major gains (~100%) in September, the price hit a resistance and formed a Triple Top reversal pattern. Since then, it has been consolidating in what appears to be an emerging Descending Triangle pattern, indicating that sellers are more aggressive than buyers, pushing the price lower. There is a solid Support Zone at ~ $0.575, which is also the lower trendline of the triangle pattern. If the price breaks and closes below this level, more pain could be in store for THETA. Traders should wait for a decisive breakout of the triangle trendlines, either Up or Down, although there’s higher chance of Down.

Risk management – Stop Loss and trade size. In all of these setups, traders should use Stop Loss orders to manage their downside risk, in case the trade goes against us, as it often will. Trading is about probabilities and even though these setups have a high win rate, one must be prepared to minimize losses on the trades that go bust. If Stop Loss order types are not supported by they exchange, at least set up a price alert (see video). Also, trade size should be such that you never risk losing more than 2% of your total equity. Keeping the trade size small allows the trader to setup a wider Stop Loss, which gives the trade more room and time to complete with success. Setting Stop Loss levels too tight can often result in getting knocked out of a trade prematurely.
Disclaimer: This content is for informational purposes only, you should not construe any such information or other material as investment, financial, or other advice. There are risks associated with investing in cryptocurrencies. Loss of principal is possible.