Cryptocurrency trading analysis: Bitcoin (and most altcoins) at a Critical Juncture
Cryptocurrency trading analysis of BTC, ETH, BCH, ZIL, QTUM, ICX, HBAR, HEDG, DCR
Bitcoin (BTC) is fighting to surpass its all-time-high (ATH) of ~$19,800. The first approach on Nov 24 and 25 was rejected, price cratered 15% to $16,200 on big volume, then buyers stepped in again.
If it gets rejected again, it could result in a bearish Double Top pattern, which indicates a reversal or at least a pause in the near-term trend.
Considering how fast BTC advanced to get to this point in the last two months, we would not be surprised to see it consolidate in a $16,000-$19,000 range for a while. Most BTC holders are in the money at these levels, and some are looking to take some money off the table. Yet, long-term, adoption by retail, institutional and corporate investors is undeniable and should push BTC higher.
Consolidation is in order for many altcoins as well, particularly those that blasted up a week ago. Yet, these are exactly the coins that trend following traders are keeping an eye on, because they’ve already shown us that these are the coins the traders and investors care about the most. Follow the money.
With increased volatility, we are forced to frequently update our technical analysis (TA). Here’s an update on BTC, ETH, BCH, ZIL, QTUM, ICX, HBAR, HEDG, DCR.
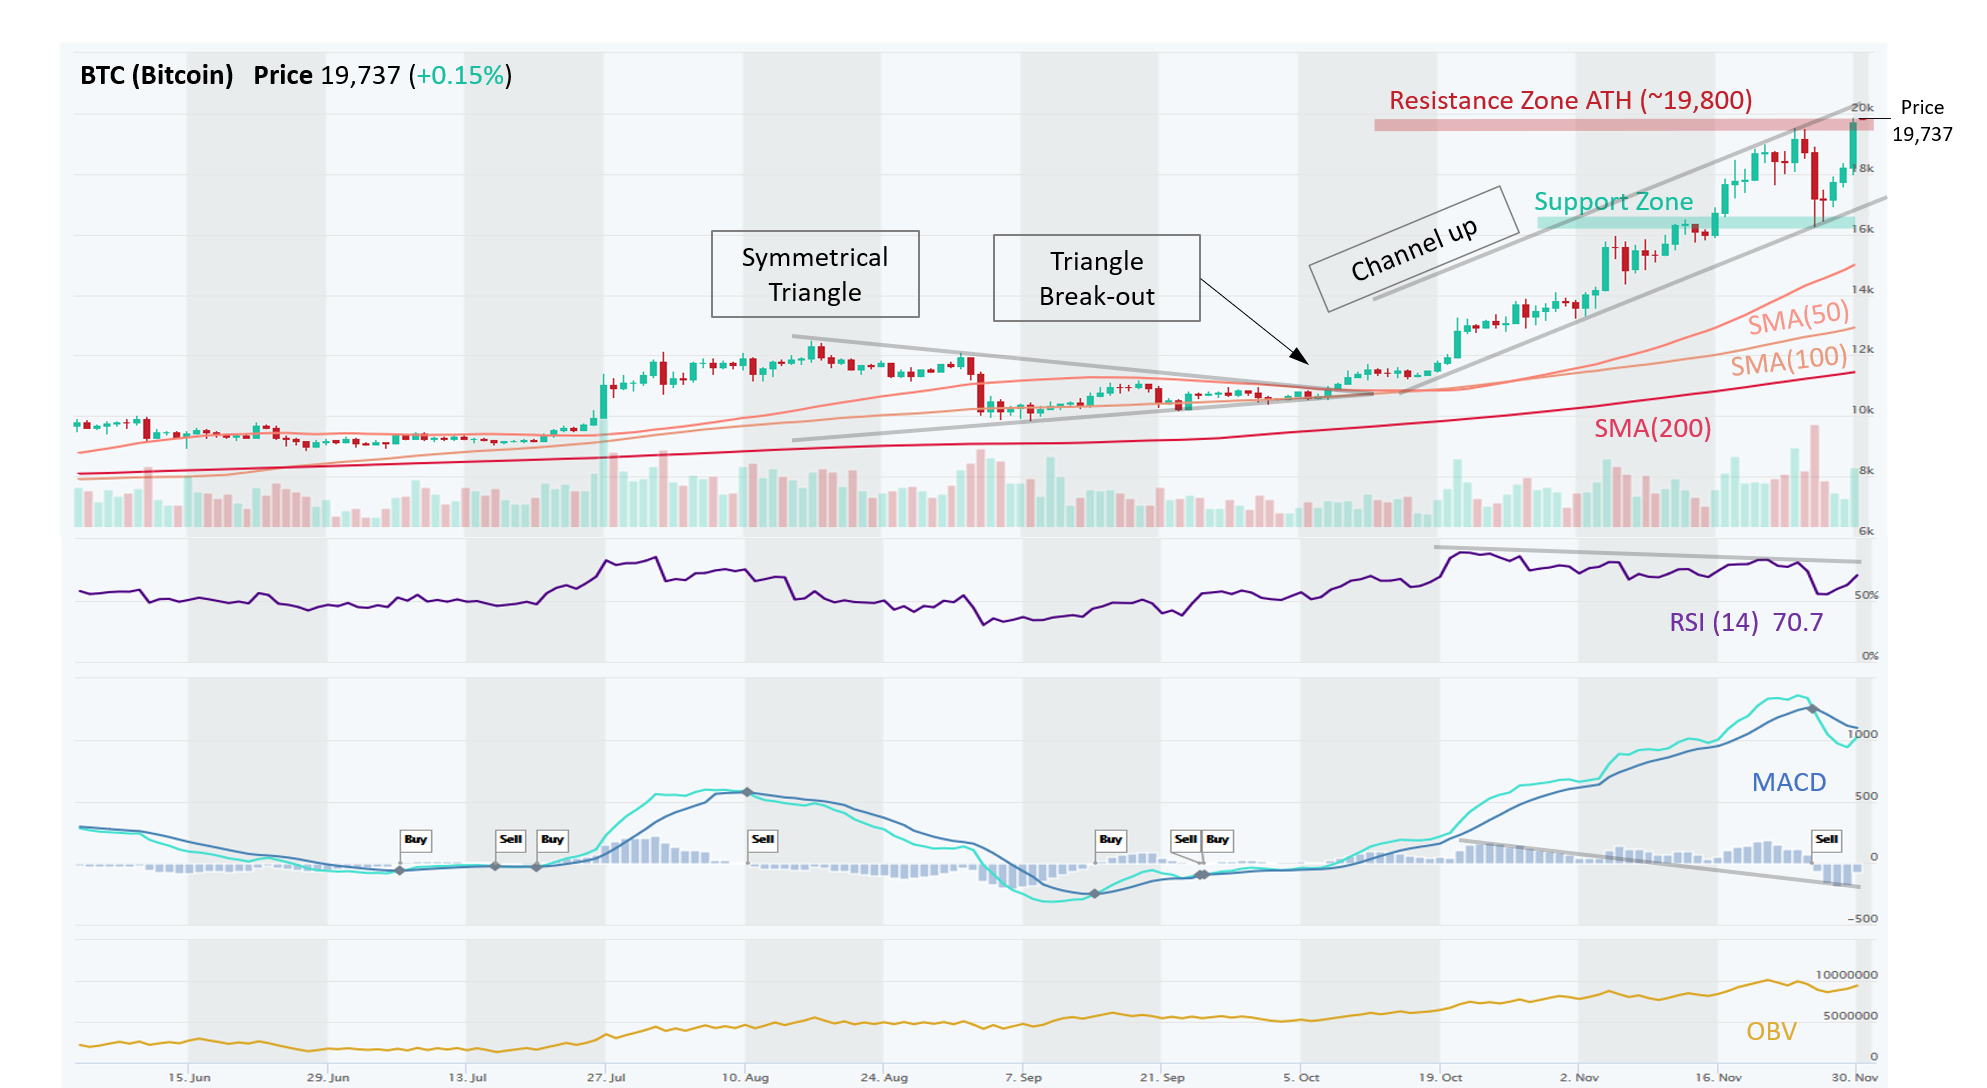
BTC – Likely to Consolidate Sideways Before Breaking Through $20K
Bitcoin (BTC) is in an Uptrend across all time horizons (Short-, Medium-, and Long-Term). In early October, BTC broke upwards from a Symmetrical Triangle formation and marched strongly upwards ever since. BTC touched resistance at $13,560, which was the 61.8% Fibonacci retracement from the 2017 high, but after consolidating there for a couple of days, it broke this resistance as well as the resistance at $16,300 which was the 78.6% retracement from the 2017 high. These prior Resistance Zones (~$13,500 and ~$16,300) have now turned into Support Zone, which is a critical TA principle known as Polarity.
It is now battling to surpass all-time-high (ATH) at ~ $19,800. There’s a lot of sellers and buyers around this level. It was rejected once on Nov 23, dropped from $19,200 to $16,200 and now rebounded for another attack with solid volume during yesterday’s (Nov 30) advance. Our guess is that it will fail, however, and consolidate further sideways. Trend following traders would buy the dips. Price has lost bit of momentum (bearish MACD Crossover on Nov 26 and RSI in a downtrend). OBV is trending upwards since channel break-out, this is a positive indication of growing demand pressure from buyers. ADX at ~ 45 signaling a very strong trend, but ADX is declining, which points to trend weakening.
Long-Term (i.e. 2021) we still see BTC advancing well ahead of $20K, which would pull altcoins with it.
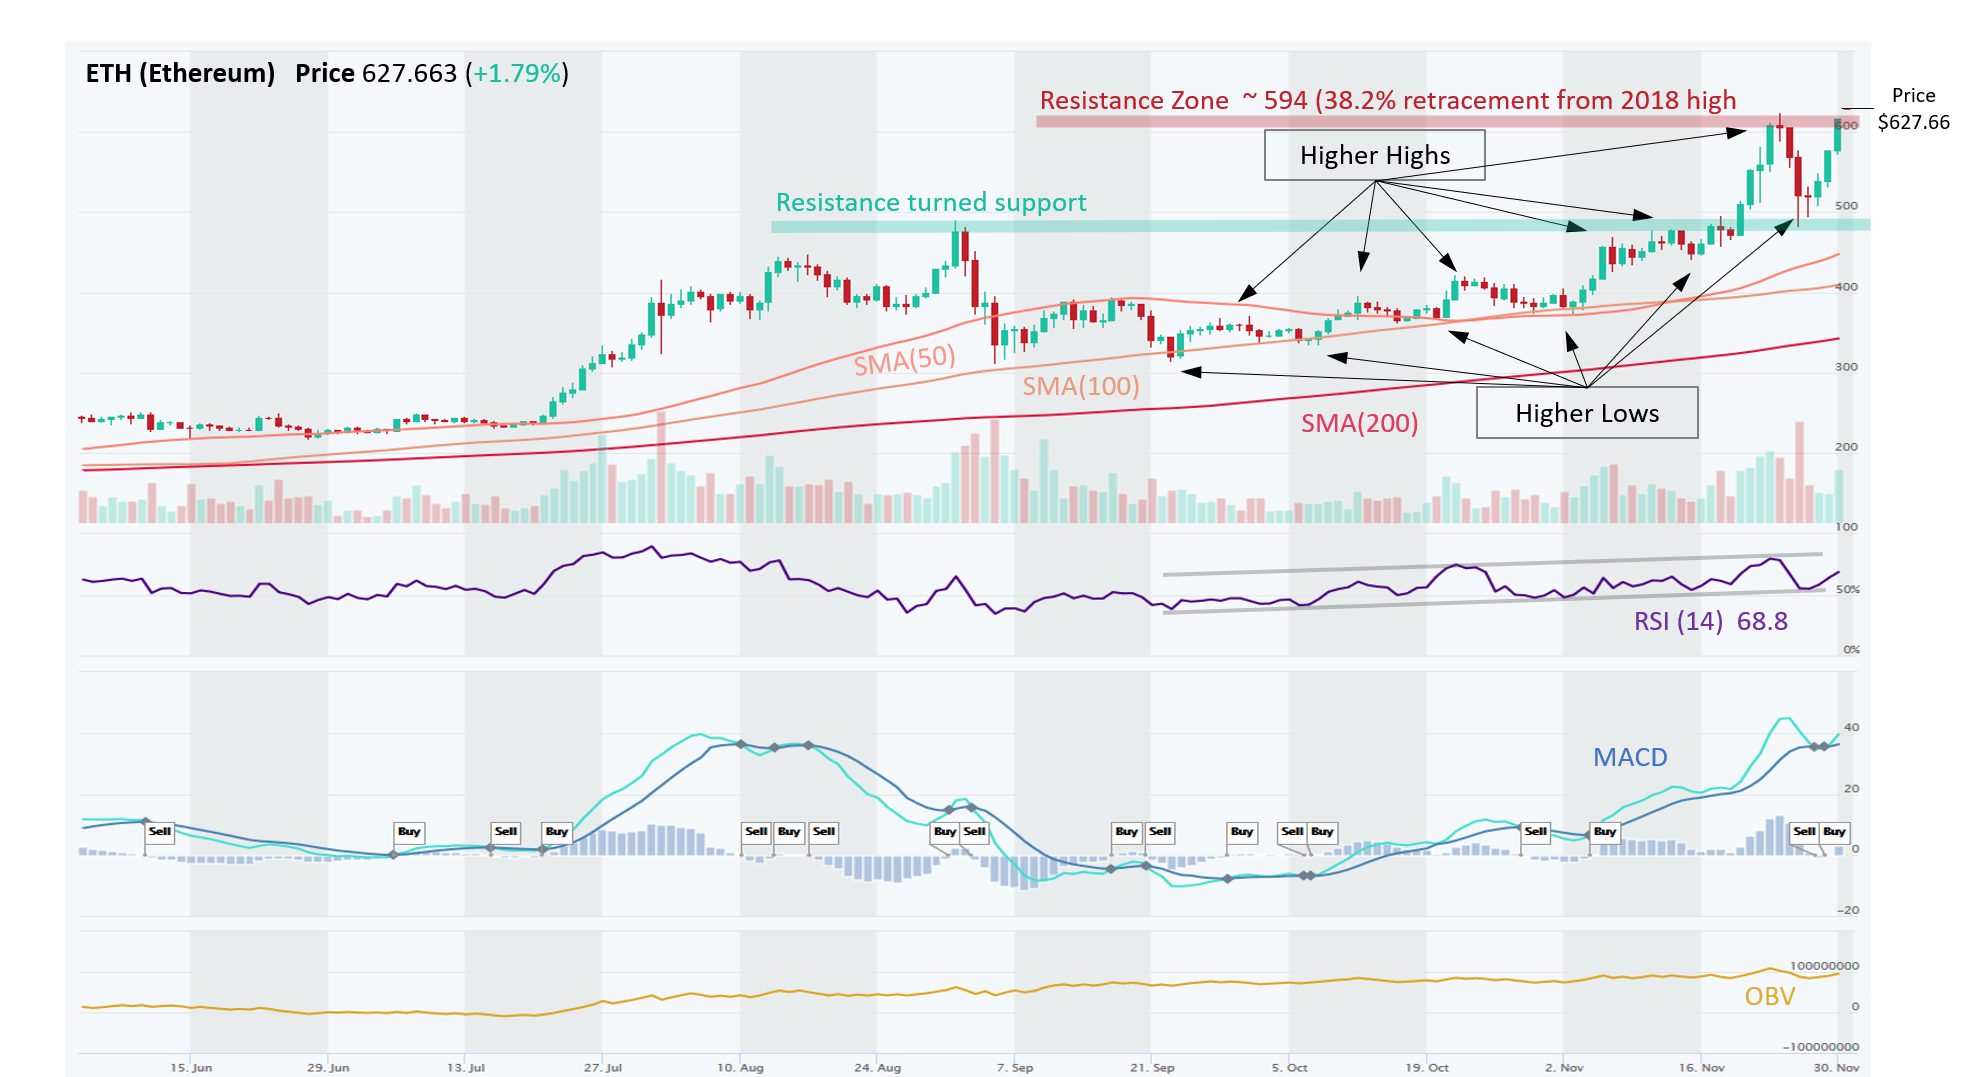
ETH – Textbook Uptrend; Making New Highs This Year; But Beware of Double Top
Ethereum (ETH) is in strong uptrend across all time horizons (Short-, Medium-, and Long-Term). Since September, ETH was struggling with a Resistance Zone around $375, which it finally broke out of on Oct 21. Shortly afterwards, it cleared another Resistance Zone around $450. Now that Resistance Zone has become a Support Zone, in a TA principal known as Polarity. Price has been marching steadily upwards, forming a textbook uptrend with a series of Higher Highs and Higher Lows. ETH has cleared this year’s high of $490, and very swiftly approached $594 level, which is the 38.2% retracement from the 2018’s ATH price) and is currently attacking this big resistance level.
Price has exceeded this level a few times but has not closed above it. If it gets rejected again, it would then form a Double Top, a bearish reversal pattern and would likely to revisit the $500 Support Zone. MACD Crossover and RSI over 50 are indicating solid momentum. ADX is at 43, which indicates that the current trend remains strong although ADX is easing up. OBV also has an upward trend, indicating that volume on Up days has exceeded volume on Down days.
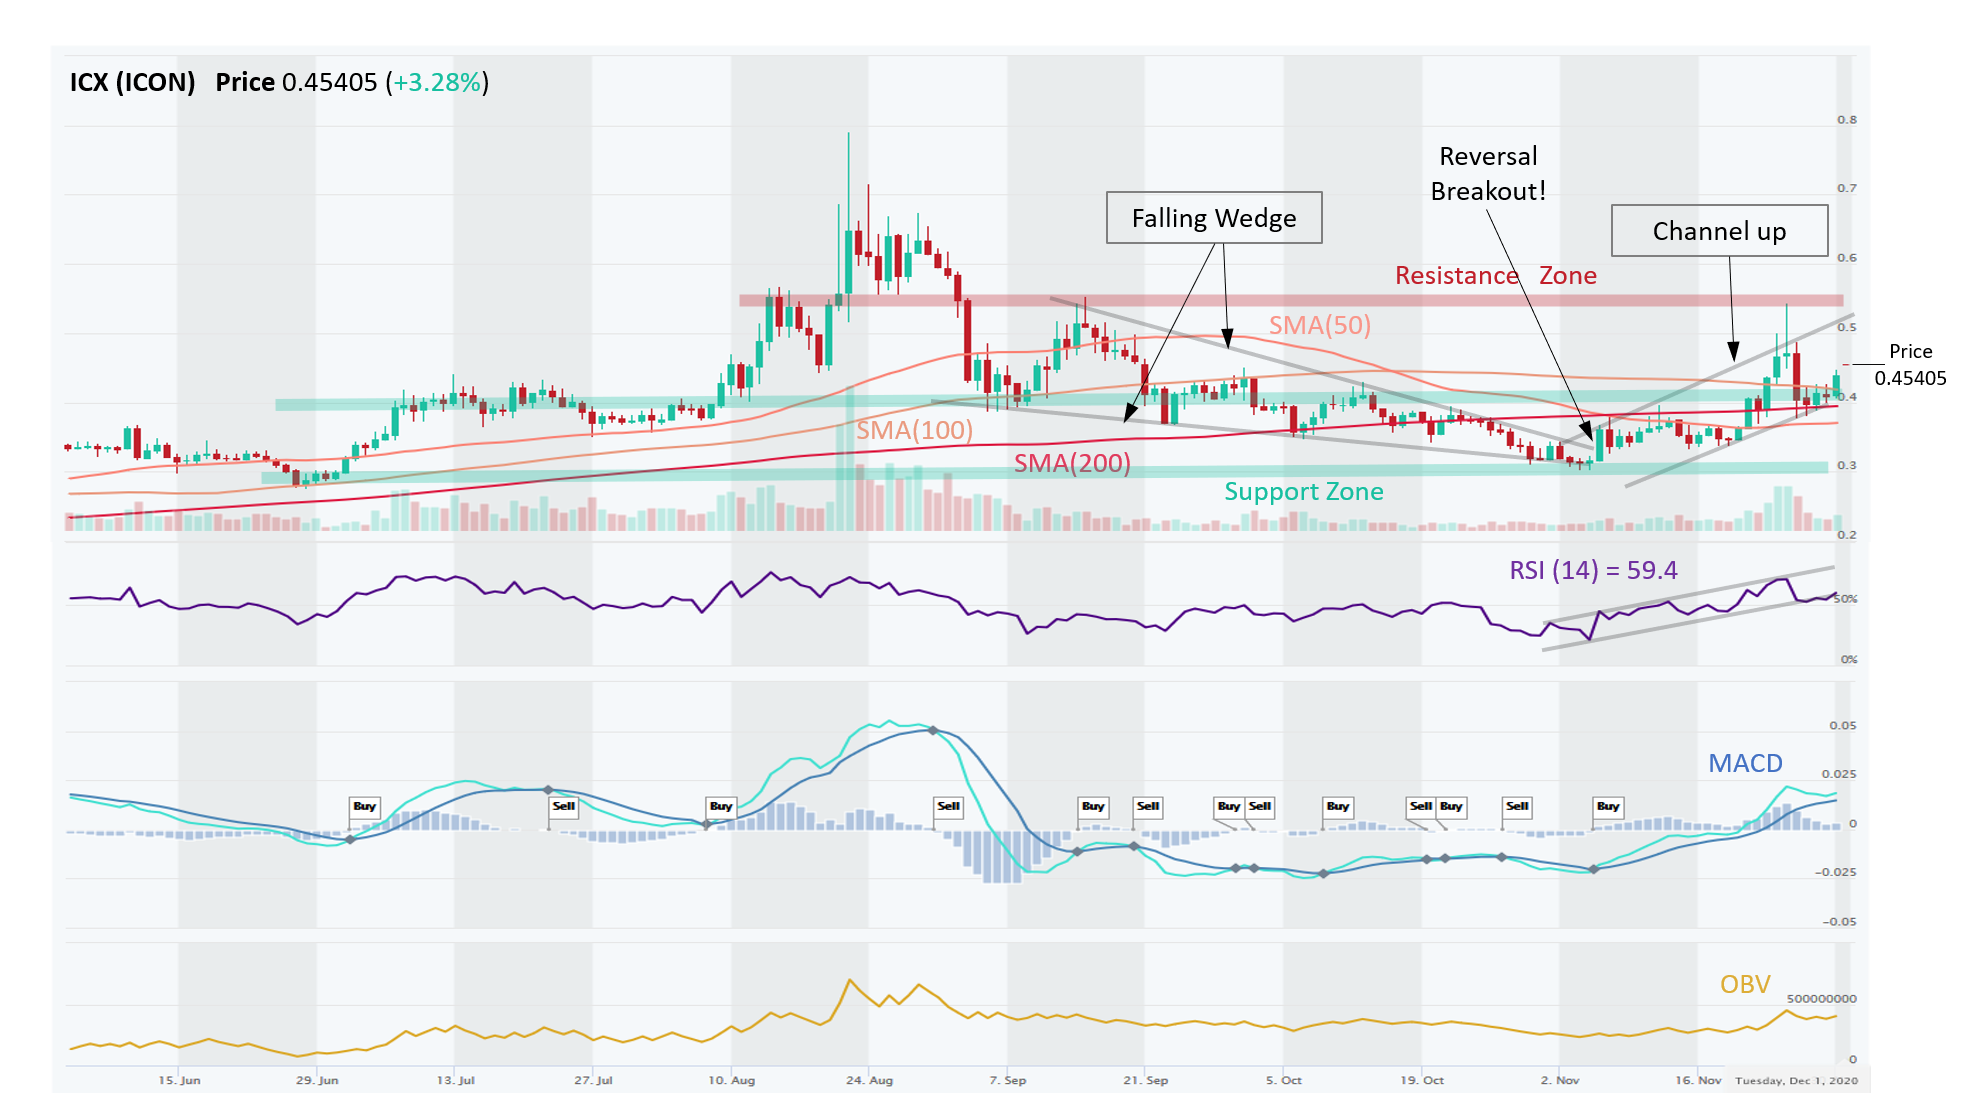
ICX – Reversal Breakout From Falling Wedge Turned Into a Blossoming Uptrend
ICX (ICON) is in an Uptrend on Short- and Medium-Term basis, although still in a modest Downtrend on a Long-Term basis. Following consolidation in a Falling Wedge pattern (Sep-Oct), ICX broke out on Nov 6 when it hit a Support of $0.30, and began a steady rise towards Resistance (now Support) at ~$0.40. Price broke through this Resistance on Nov 23 along with a general rally in altcoins and shot up all the way to $0.55. It retreated back to $0.40 but held this Support (switched from Resistance previously – critical concept of Polarity). Momentum remains bullish (MACD Crossover and RSI > 50), which along with rising OBV (volume on Up days vs Down days) and ADX at 28 (strong trend) suggest that ICX can continue its ascend higher in a Channel Up pattern.
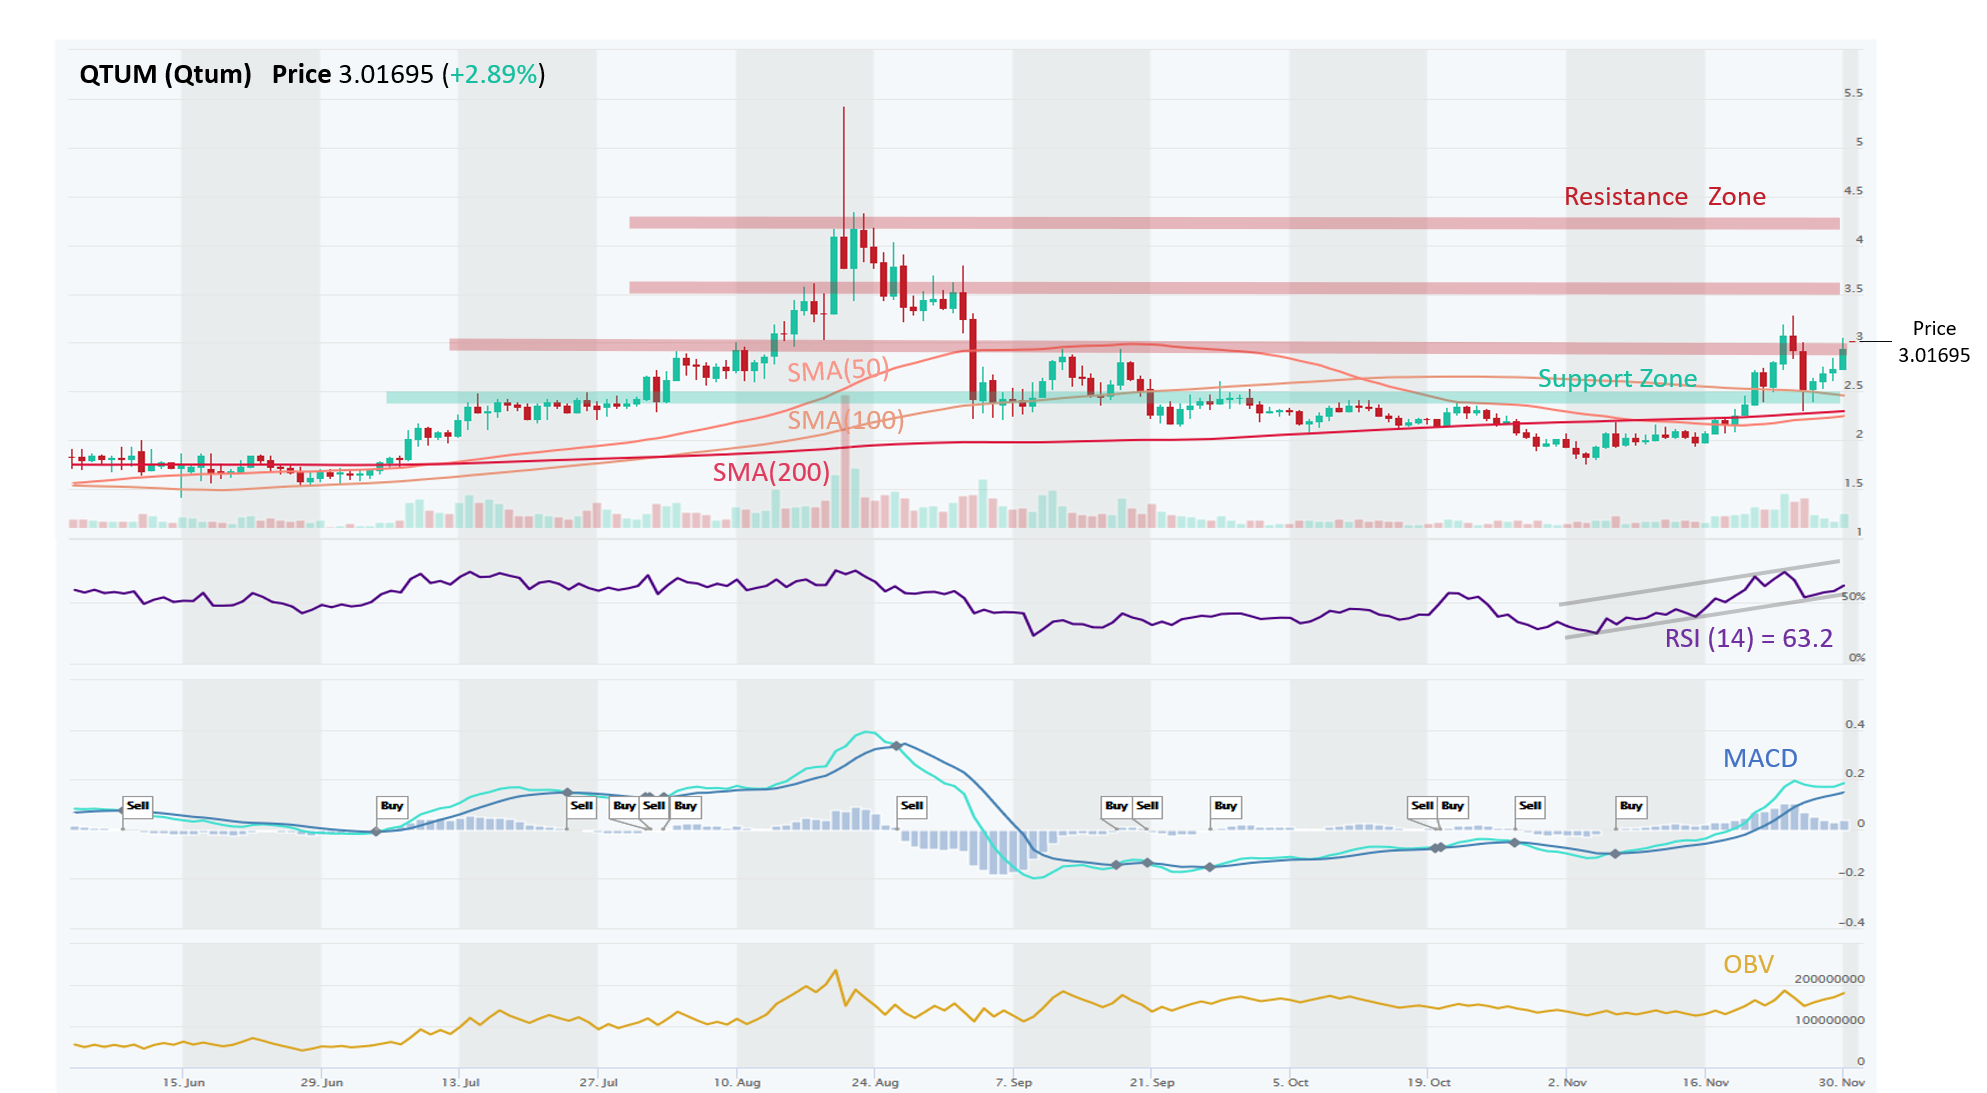
QTUM – Up Against a Critical Resistance at $3.00, With Solid Momentum and Uptrend
QTUM (Qtum) is in an Uptrend on Short- and Medium-Term basis, although still in a modest Downtrend on a Long-Term basis. Price sat and even dipped below the 200 Day SMA during September and October sideways consolidation, but more recently it decisively turned bullish (MACD Crossover, RSI > 50 and rising trend, OBV rising, ADX ~ 33). Price reached and was rejected by a formidable Resistance Zone at ~ $3.00, which dates back to September. If it can break through, it could be clear sailing until the next Resistance Zone of $3.50 and possibly $4.25.
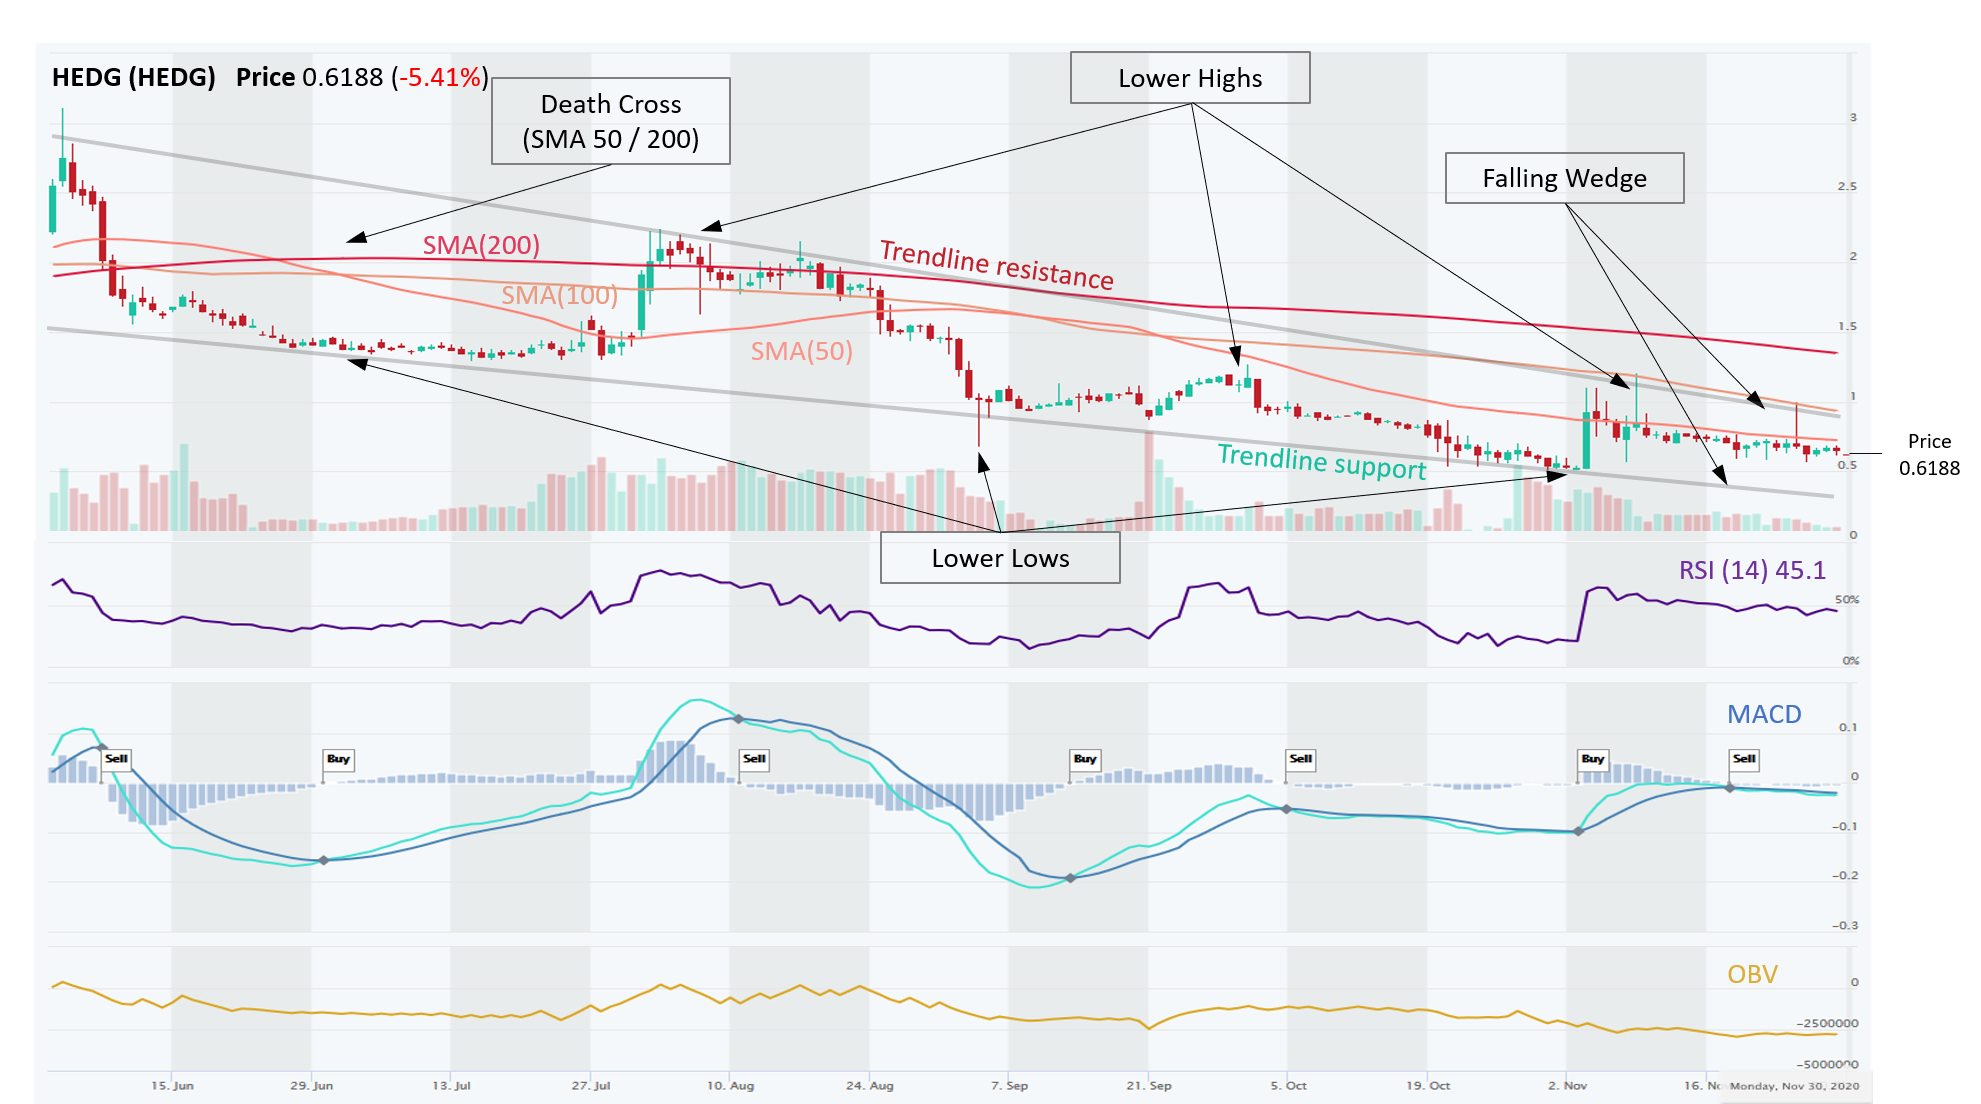
HEDG – Shocking Lack of Interest Lately; Remains in Downtrend Although an Emerging Falling Wedge Pattern Could Result in a Bullish Reversal at Some Point
HEDG (Hedge Trade) is in a Downtrend across all time horizons (Short-, Medium-, Long-Term). HEDG is stuck in an emerging Falling Wedge, which is a bullish pattern; however, this bullish bias cannot be realized until a resistance breakout occurs (that’s why it’s still just emerging, not complete pattern). There were signs of such breakout in early Nov, but that faded that HEDG resumed its downtrend within the pattern.
The most positive thing that can be said about HEDG at this point is that the selling pressure appears to be abating with RSI, MACD and OBV flattish, indicating that buyers and sellers have reached a balance. The nearest Support Zone is $0.50, which is where it bounced off of in early Nov. It is also concerning that this name did not participate in last week’s altcoin rally at all, showing lack of interest among traders and investors alike.
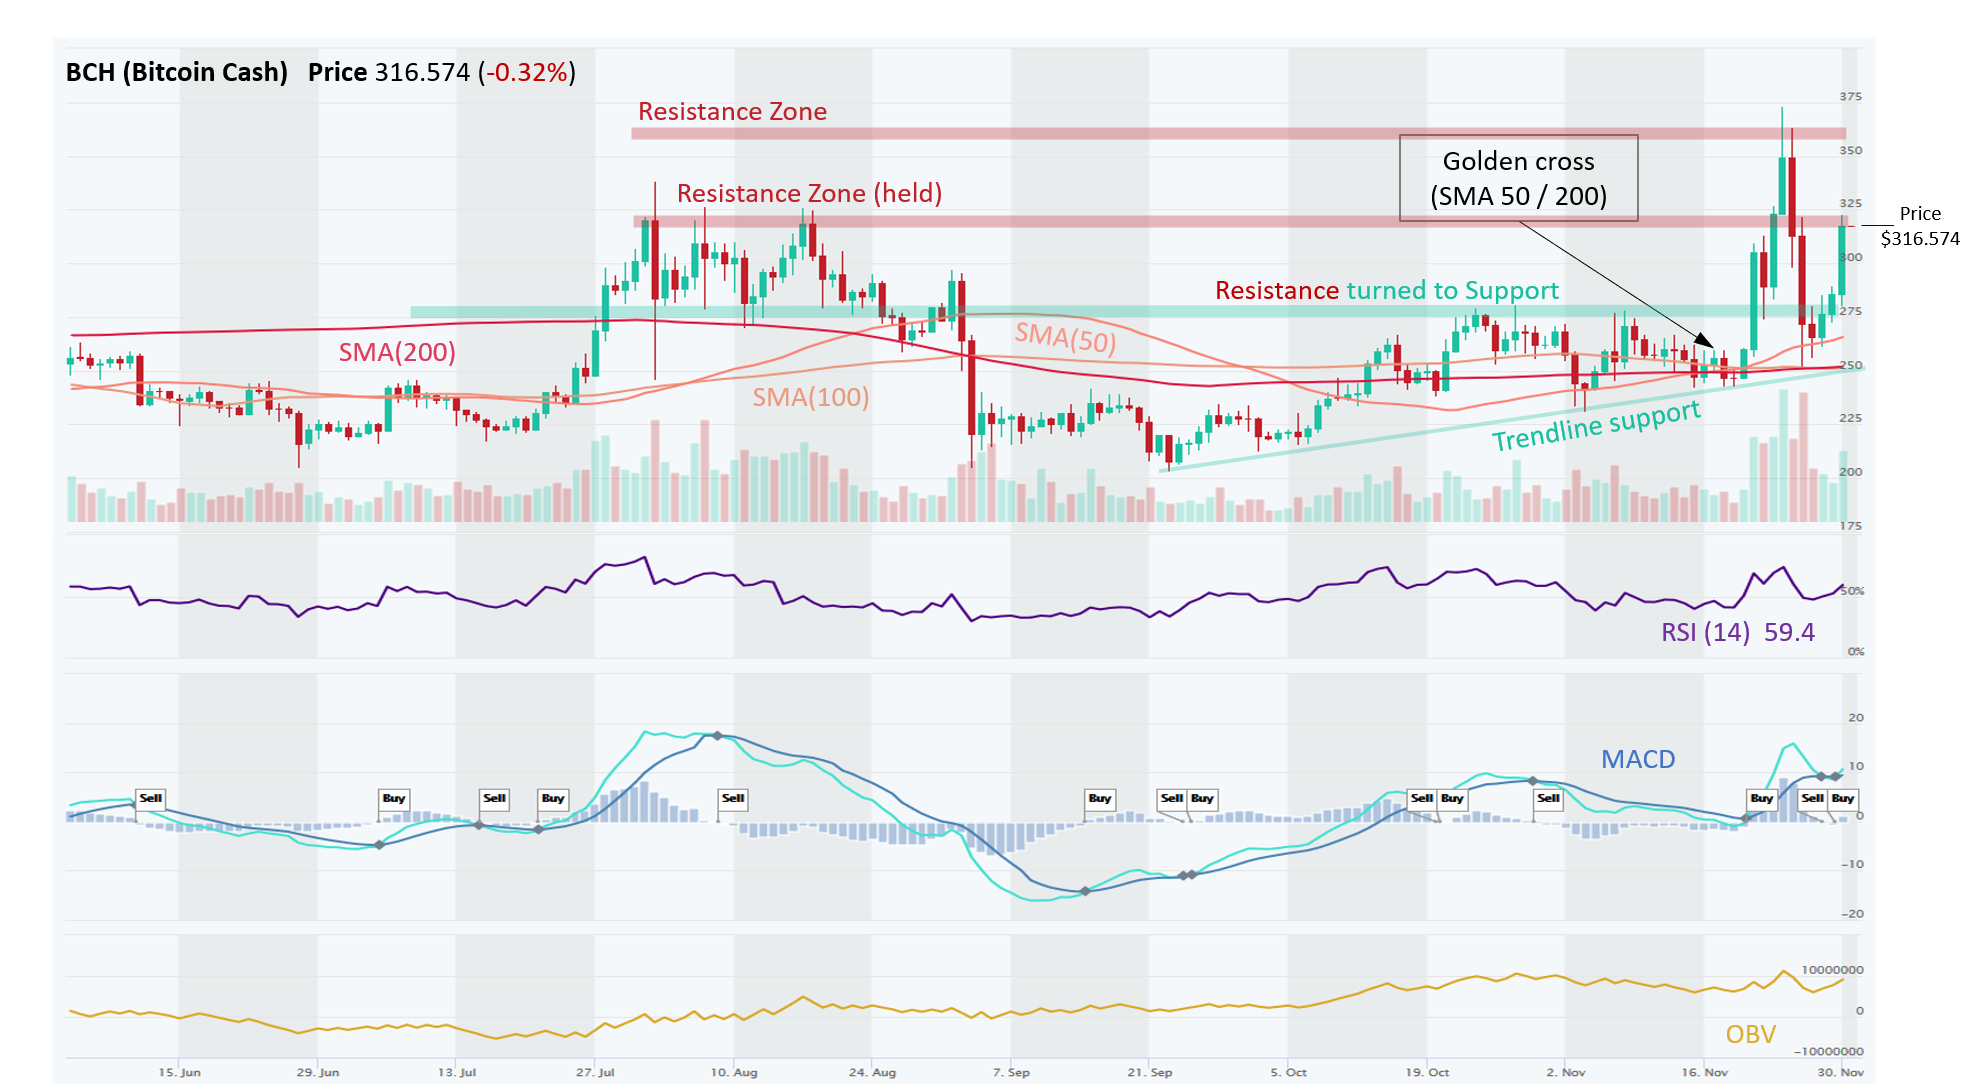
BCH – Likely To Consolidate Sideways Before Breaking $325 Resistance
Bitcoin Cash (BCH) is in a strong uptrend across all time horizons (Short-, Medium-, and Long-Term). BCH is one of four cryptocurrencies that PayPal initially supports, which we believe gives it strong tailwinds and sparked a recent rally. BCH formed a golden-cross formation on 17th November and broke out of a sideways trading channel ($240-$275), through the Resistance at $275 and $325. However, it retraced and $325 remains a formidable Resistance Zone that dates back to July and August months where it was rejected on several occasions. Momentum looks bullish again (MACD Crossover and RSI > 50) but we believe that BCH is bound to consolidate sideways for a few days before it breaks through $325 on a sustained basis.
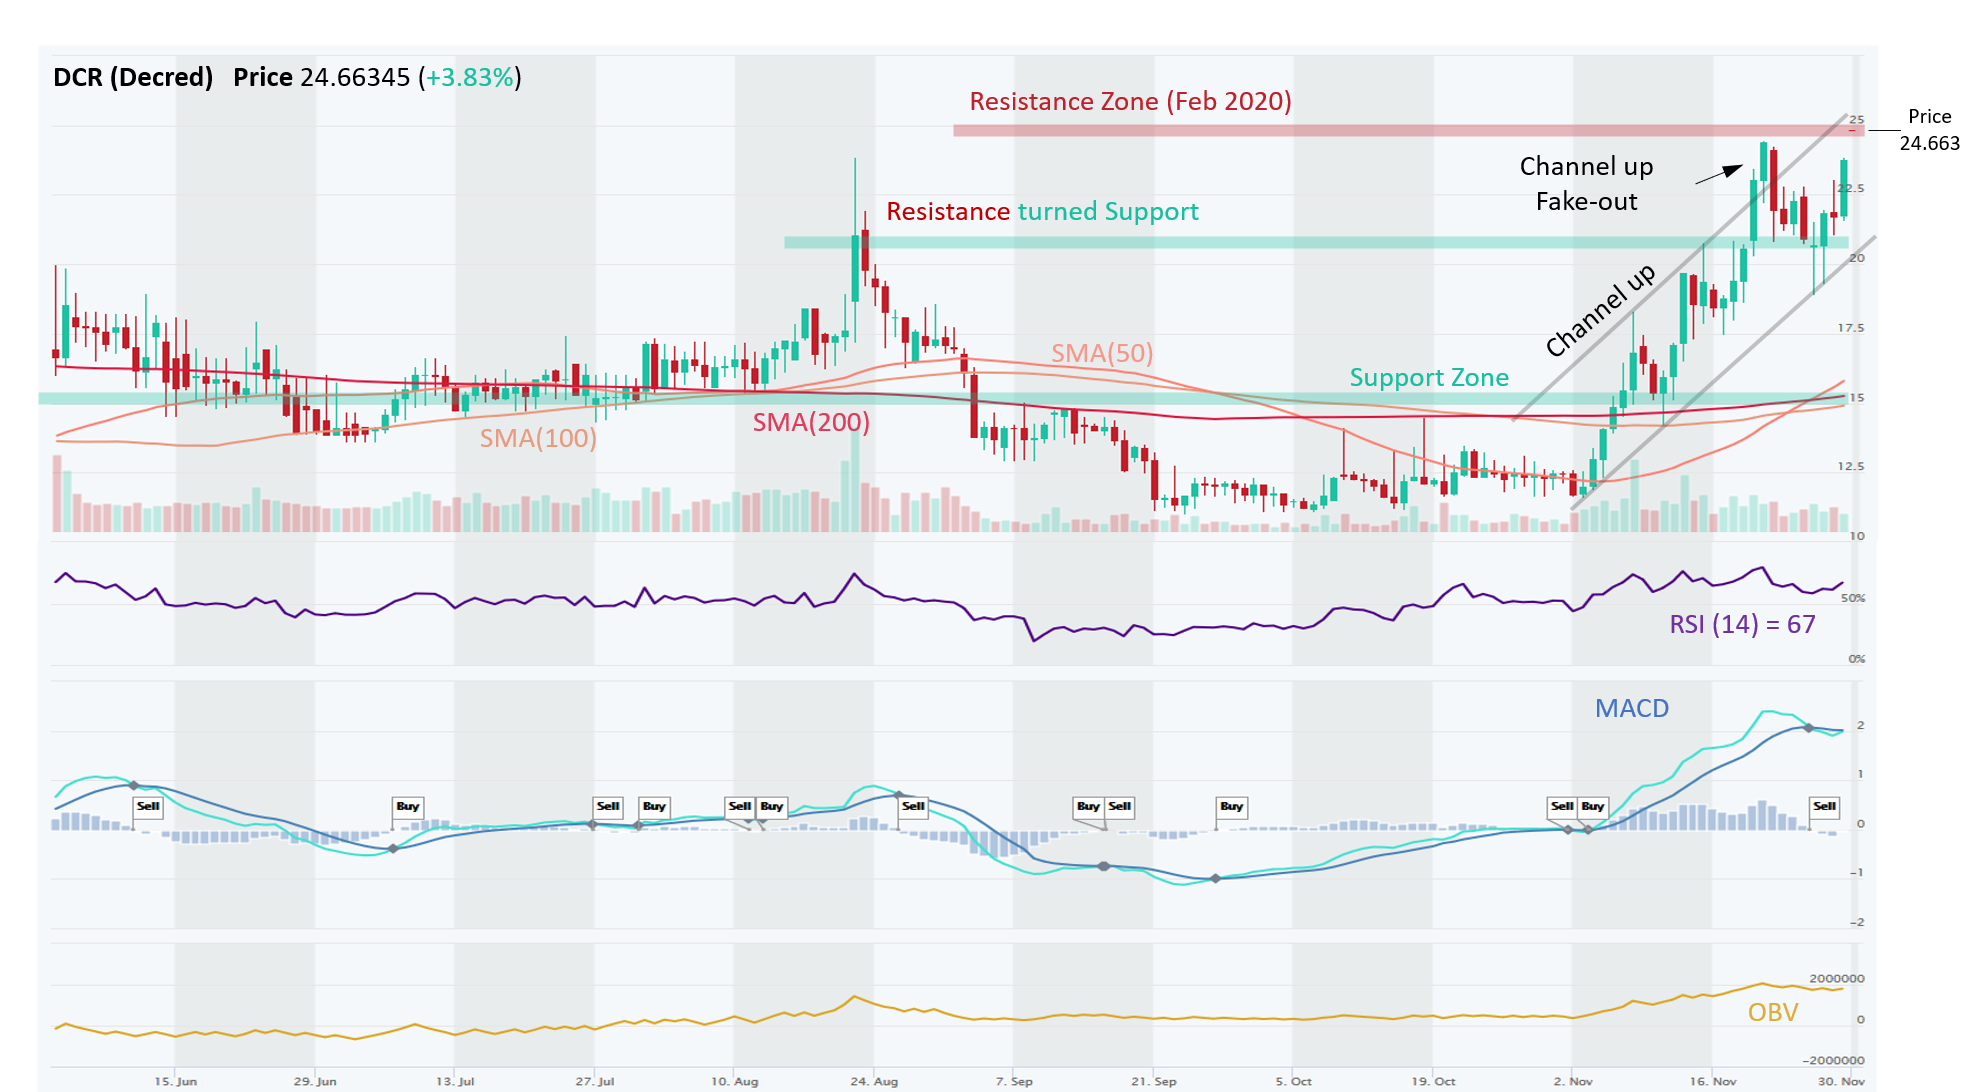
DCR – Strong Momentum in a Channel Up Pattern Continues
DCR (Decreed) is in an Uptrend across all time horizons (Short-, Medium-, Long-Term)x. After consolidating in a range in September and October, DCR began a steady ascend, breaking through multiple Resistance Zones that have now turned into Support Zones at $12.50, $15.00, $17.50, and $21.00. It is now trading near Resistance zone from February 2020. Golden Cross (50 Day SMA above 200 Day SMA) formed on November 26 and DCR is trading in a bullish Channel Up. Price has lost some momentum recently (MACD, RSI, OBV flattish) but that is normal during an pullback in an Uptrend. ADX of 48.3 is well in a Very Strong trend strength territory
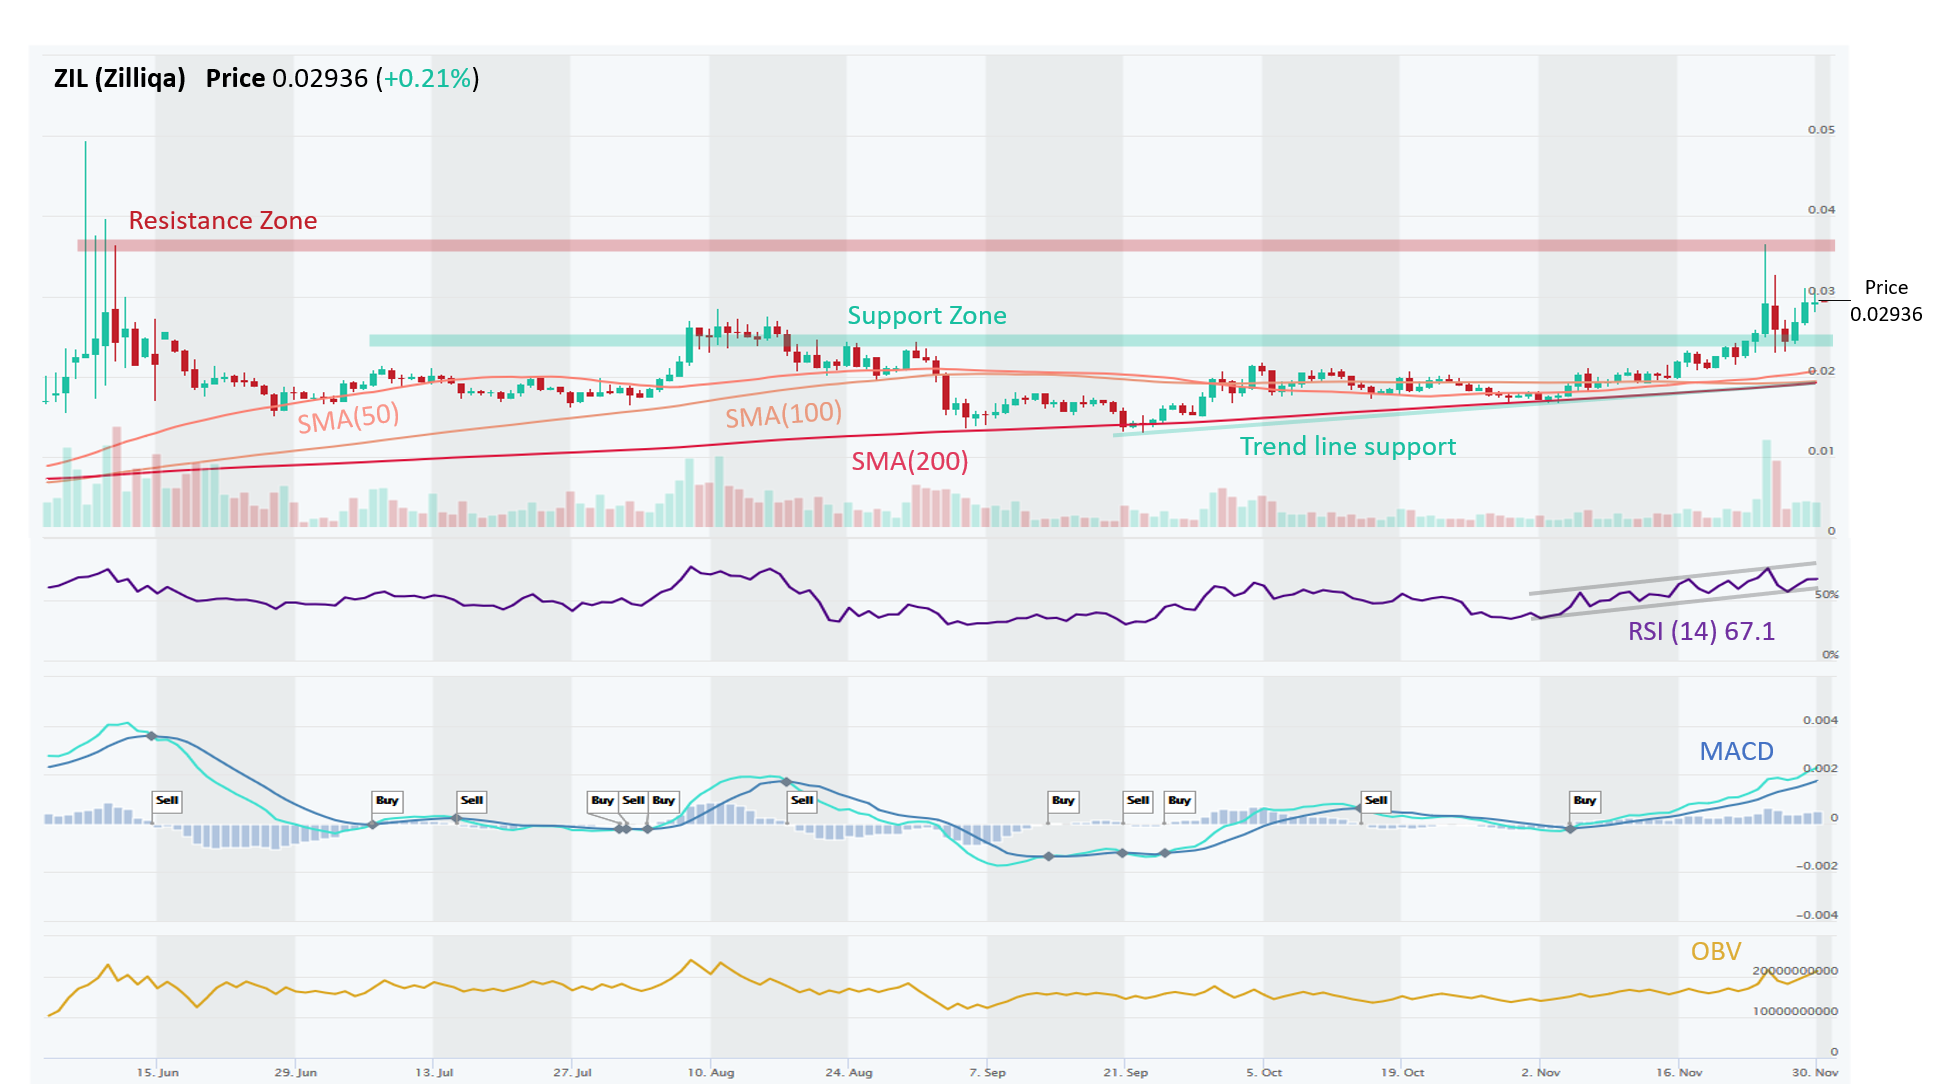
ZIL – Successful Breakout From Sideways Channel Turns Into a Solid Uptrend
ZIL (Zilliqa) was stuck in a sideways range ($0.015-$0.020) for couple of months before it broke out in mid-Nov and resumed a solid Uptrend across all time horizons (Short-, Medium-, Long-Term). Recently it cleared Resistance at ~$0.027 with growing volumes (breakout confirmation) and spiked up to $0.0375. Momentum indicators remain bullish (RSI > 50, MACD bullish Crossover on Nov-6) and are confirmed by an uptick in OBV as well (volume on Up days exceeded volume on Down days). ADX (trend strength) is at 44.7, indicating strong trend, moreover, ADX is rising, which indicates that Uptrend is strengthening.
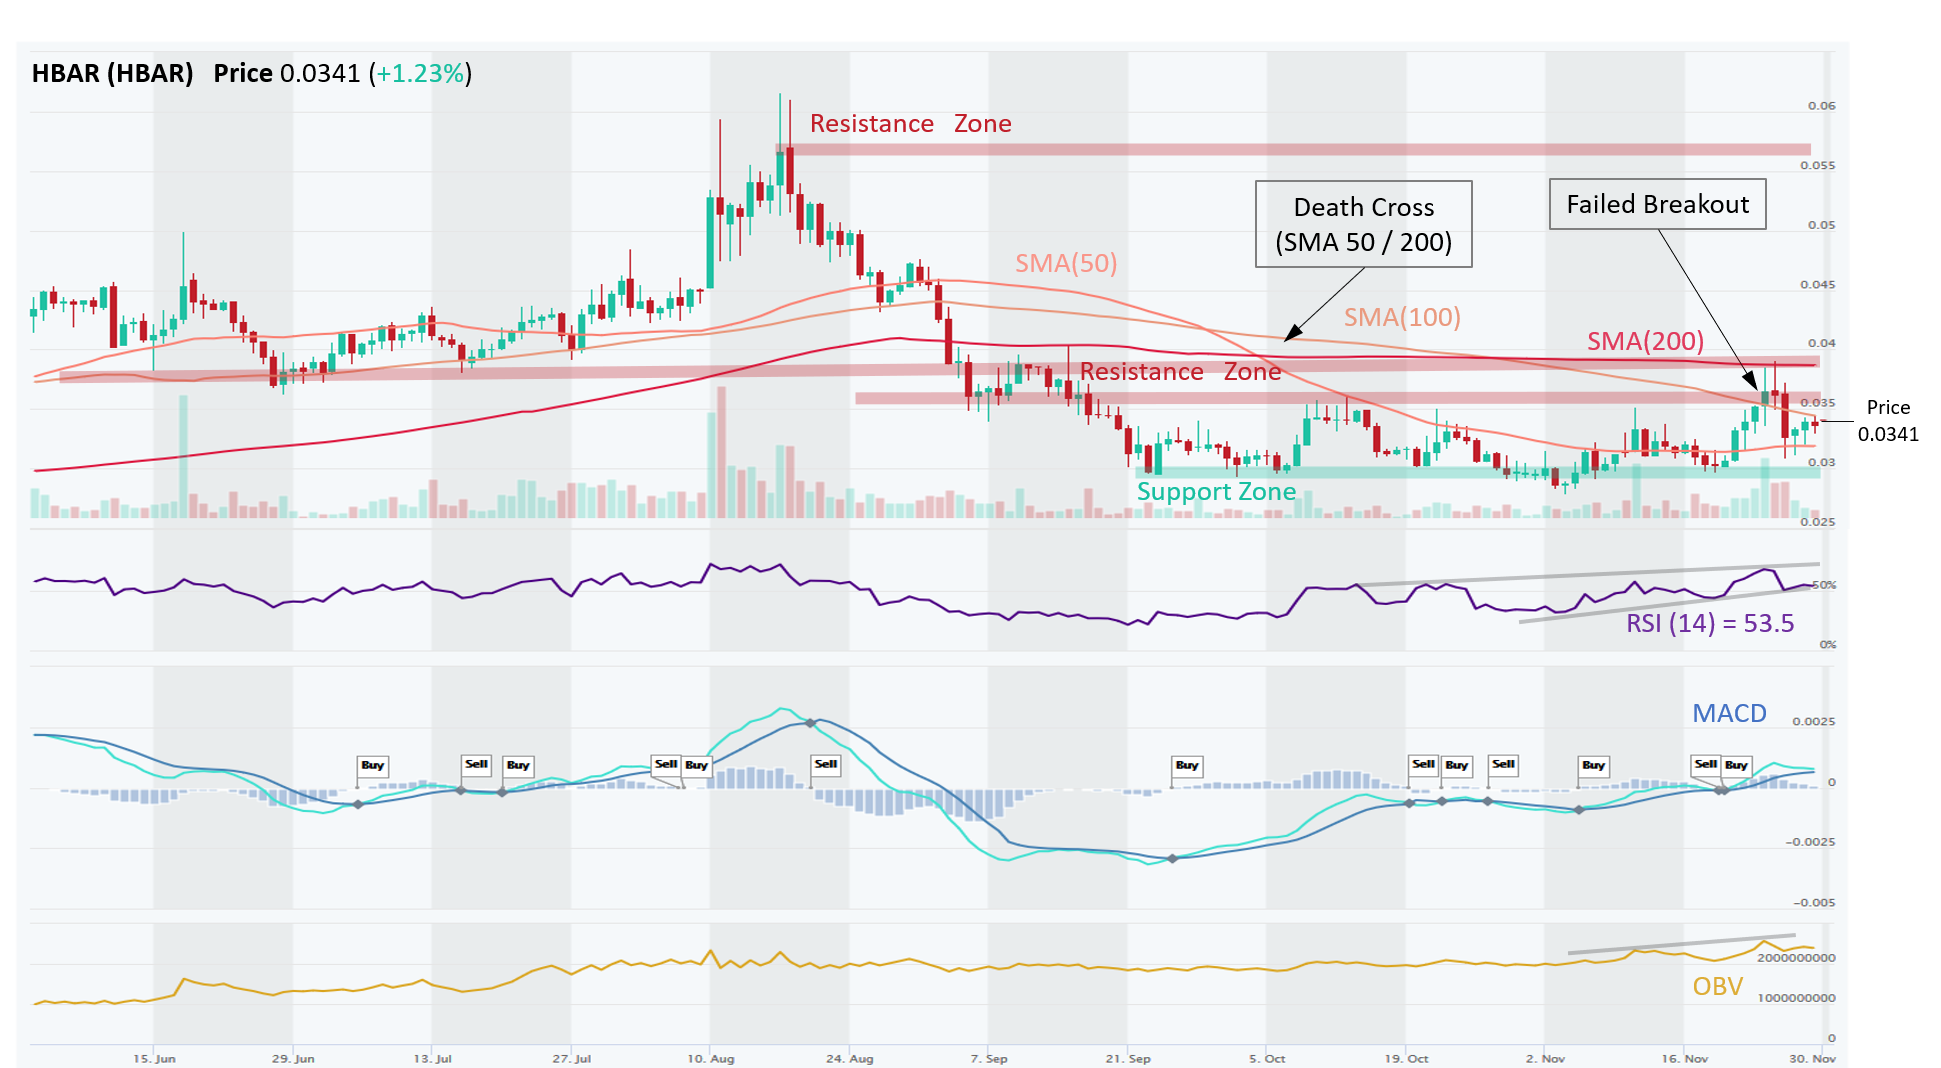
HBAR – Big Resistance Overhead Following a Failed Breakout
HBAR (Hbar) is in a sideways trading channel on a Short-Term basis, but still in a Downtrend on a Long-Term basis, which was confirmed by a Death Cross (50 Day SMA below 200 Day SMA) that formed early on October 4. The current sideways channel is bracketed by $0.030 Support and $0.035 Resistance areas. Recent altcoins rally boosted HBAR past its Resistance for an instance, but it wasn’t able to hold that. Note that it touched the 200 Day SMA of $0.038, another Resistance level. Traders can trade the sideways channel (Buy Support, Sell Resistance) or wait for a breakout (Up or Down). Some of the vitals (MACD Crossover, RSI > 50, OBV rising) appear positive, suggesting that HBAR will make another go at it.
Disclaimer: This content is for informational purposes only, you should not construe any such information or other material as investment, financial, or other advice. There are risks associated with investing in cryptocurrencies. Loss of principal is possible.