SNX and LINK - breakout analysis and trades
SNX and LINK analysis – breakout and trades
We recently launched our Curated Charts section, where our inhouse analysts publish their technical analysis of top 30 cryptocurrencies.
We’re seeing lots of bullish formations and breakouts after weeks of consolidation.
Two weeks ago we posted videos with analyses and trades of THETA and TRX breakouts, which have both gained 50% since then. Today, we closed THETA after a bearish MACD crossover indicated a period of consolidation is in order.
Yesterday, we shared a video with analyses and trades of BNB and XTZ, which are up now 10% and 5%, but we see more upside.
You can view these on our YouTube channel.
Today we’re going to review breakouts seen in SNX and LINK, both popular plays on DeFi.
Also a reminder that following our launch of live platform, we’re offering our registered users a 15-30% lifetime discount on subscription plans. Offer ends on April 6th.
A free version is still available, albeit with limited access to features like automated patterns, curated charts, crypto signals, alerts and news.
We highlight an analysis on SNX and LINK, which recently broke through resistance and seem poised for additional gains.
You can find fresh trade set-ups for top altcoins in our Curated Charts section.
Watch video of SNX and LINK analysis and trades.
Synthetix (SNX) analysis – Triangle breakout:
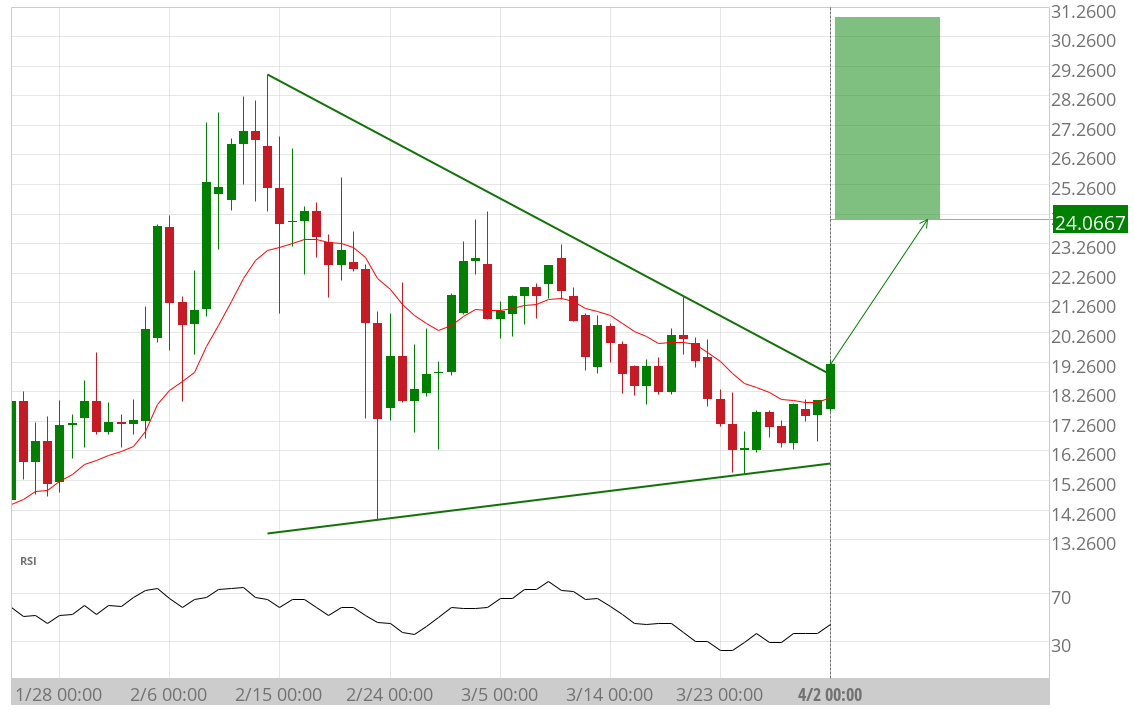
Trade setup: SNX was consolidating in a Symmetrical Triangle, which is a neutral pattern – it can break out in either direction. It just broke out to the upside and could be heading back to the next resistance level of $24+ The breakout is supported by a recent bullish momentum onset (MACD crossover as well as RSI > 50 crossover and rising).
Trend: despite a retracement from ATH ($29), SNX is still in an Uptrend across all time horizons (Short-, Medium- and Long-term). It has been consolidating in a Symmetrical Triangle and it now seems to resume it’s uptrend, along with many coins in the hot DeFi category.
Momentum: is bullish with MACD Line above MACD Signal Line and RSI > 50 and rising.
OBV (On Balance Volume): is flattish, indicating that volume on Up days is about equal to volume on Down days. Hence, demand and supply forces are in equilibrium.
Support and Resistance: Nearest Support zone is $16 and nearest Resistance zone is $20, which it just broke, and then $24.

Trade setup: For Trend Traders – price broke out of a sideways channel through $30 resistance, which could see the price revisit ATH at $35-37 again. This breakout happened with relatively low volume (less convincing) but is accompanied by a bullish MACD crossover and a monthly high on RSI, both of which indicate strong momentum that could carry the price back to ATH. Swing traders could wait to see if price pulls back into the channel ($25-30) and Buy support / Sell resistance. Rinse and repeat.
Trend: Solid Uptrend across all Short-, Medium- and Long-Term basis. Uptrend.
Momentum: turned bullish recently (MACD Line is above MACD Signal Line), and RSI crossed over 50 and is rising (bullish).
OBV (On Balance Volume): is rising, indicating that volume on Up days is greater than volume on Down days. Hence, demand from buyers exceeds supply from sellers.
Support and Resistance: Nearest Support Zone is $23-26 and the nearest Resistance is at $30 and then $35-37 (ATH). Fibonacci levels are $27.50 (78.6%) and $21.60 (61.80%).
Disclaimer: This content is for informational purposes only, you should not construe any such information or other material as investment, financial, or other advice. There are risks associated with investing in cryptocurrencies. Loss of principal is possible.