Cryptocurrency analysis of Waves (WAVES), NEM (XEM), Litecoin (LTC), Celsius (CEL), and Neo (NEO)
We have updated our technical analyses of cryptocurrencies including Waves (WAVES), NEM (XEM), Litecoin (LTC), Celsius (CEL), and Neo (NEO). These were also among the biggest cryptocurrency gainers in November including 150%, 89%, 31%, 26%, and 10%, respectively.
Check our blog for analyses of other top 50 altcoins as well as our automated chart pattern recognition for fresh trading ideas. Also, on a down day like today, it’s always good to revisit coins in an Uptrend but with a pullback. Our Signals Summary has this and other pre-defined filters ready for action.
Generally speaking, after big runs that altcoins experienced in November along with Bitcoin (BTC), most are going through a consolidation phase. Some are sitting at critical Support Zones. Traders should observe whether prices bounce and confirm these Support Zone, which could lead to resumption of an Uptrend to recent Resistance areas (20-50% higher).
XEM – Solid Uptrend Appears Intact Despite a Recent Pullback
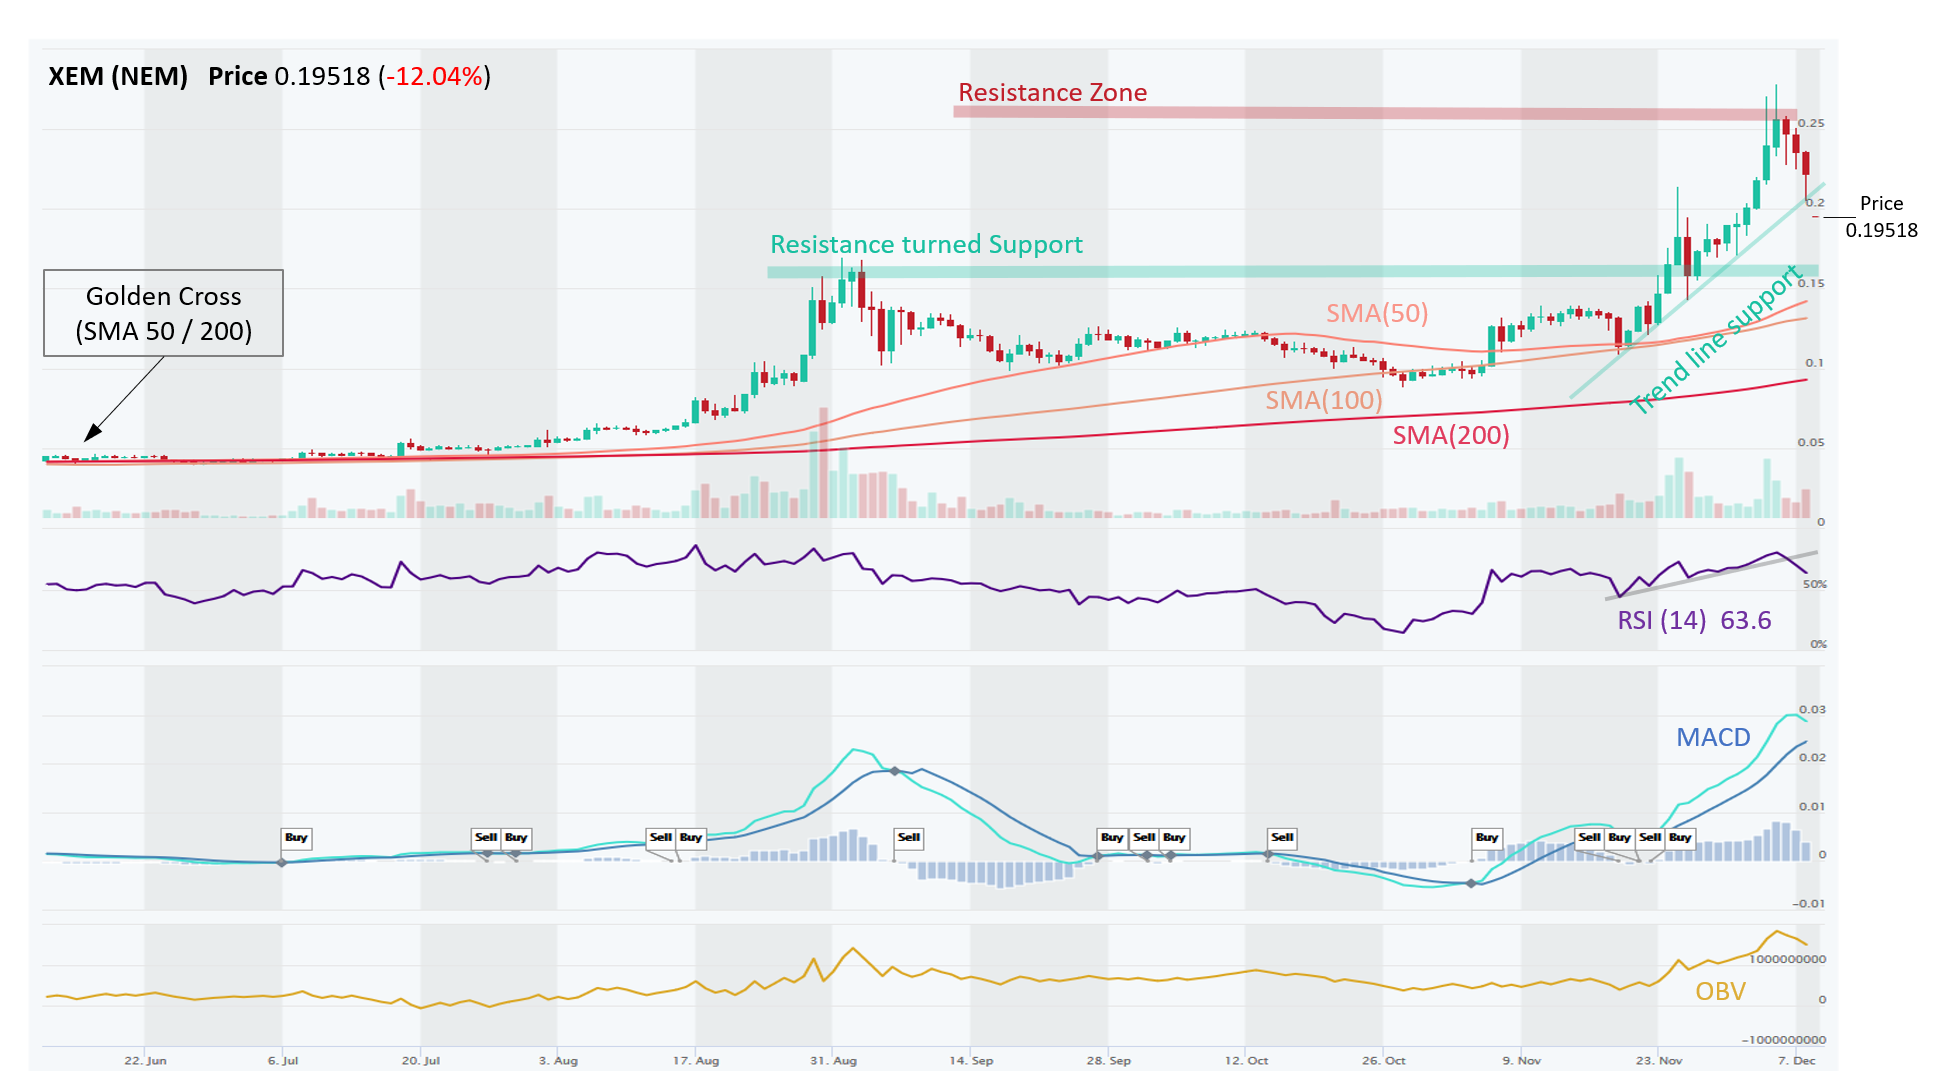
XEM (NEM) is in a solid Uptrend across all time horizons (Short-, Medium-, Long-Term). XEM had a monstrous price action during the last two weeks, burning through two Resistance zones ($0.125 and $0.160), which now turned into Support zones.
Current retracement so far seems merely like a pullback rather than a trend reversal. The Uptrend is intact, marked by a series of Higher Highs and Higher Lows.
Momentum, while cooling off, remains positive with RSI above 50 and MACD forming a bullish crossover. Moreover, higher prices had been accompanied by higher RSI readings, and MACD histogram made a higher high as well, in synch with peaks in price. All of which serves as a solid confirmation.
OBV (volume on Up days vs Down days) was trending nicely upwards, which supports the price action.
ADX (trend strength) is above 40, which indicates a very strong trend and ADX is rising.
WAVES – In a Correction Following Big Gains; Which Support Level Will Hold?
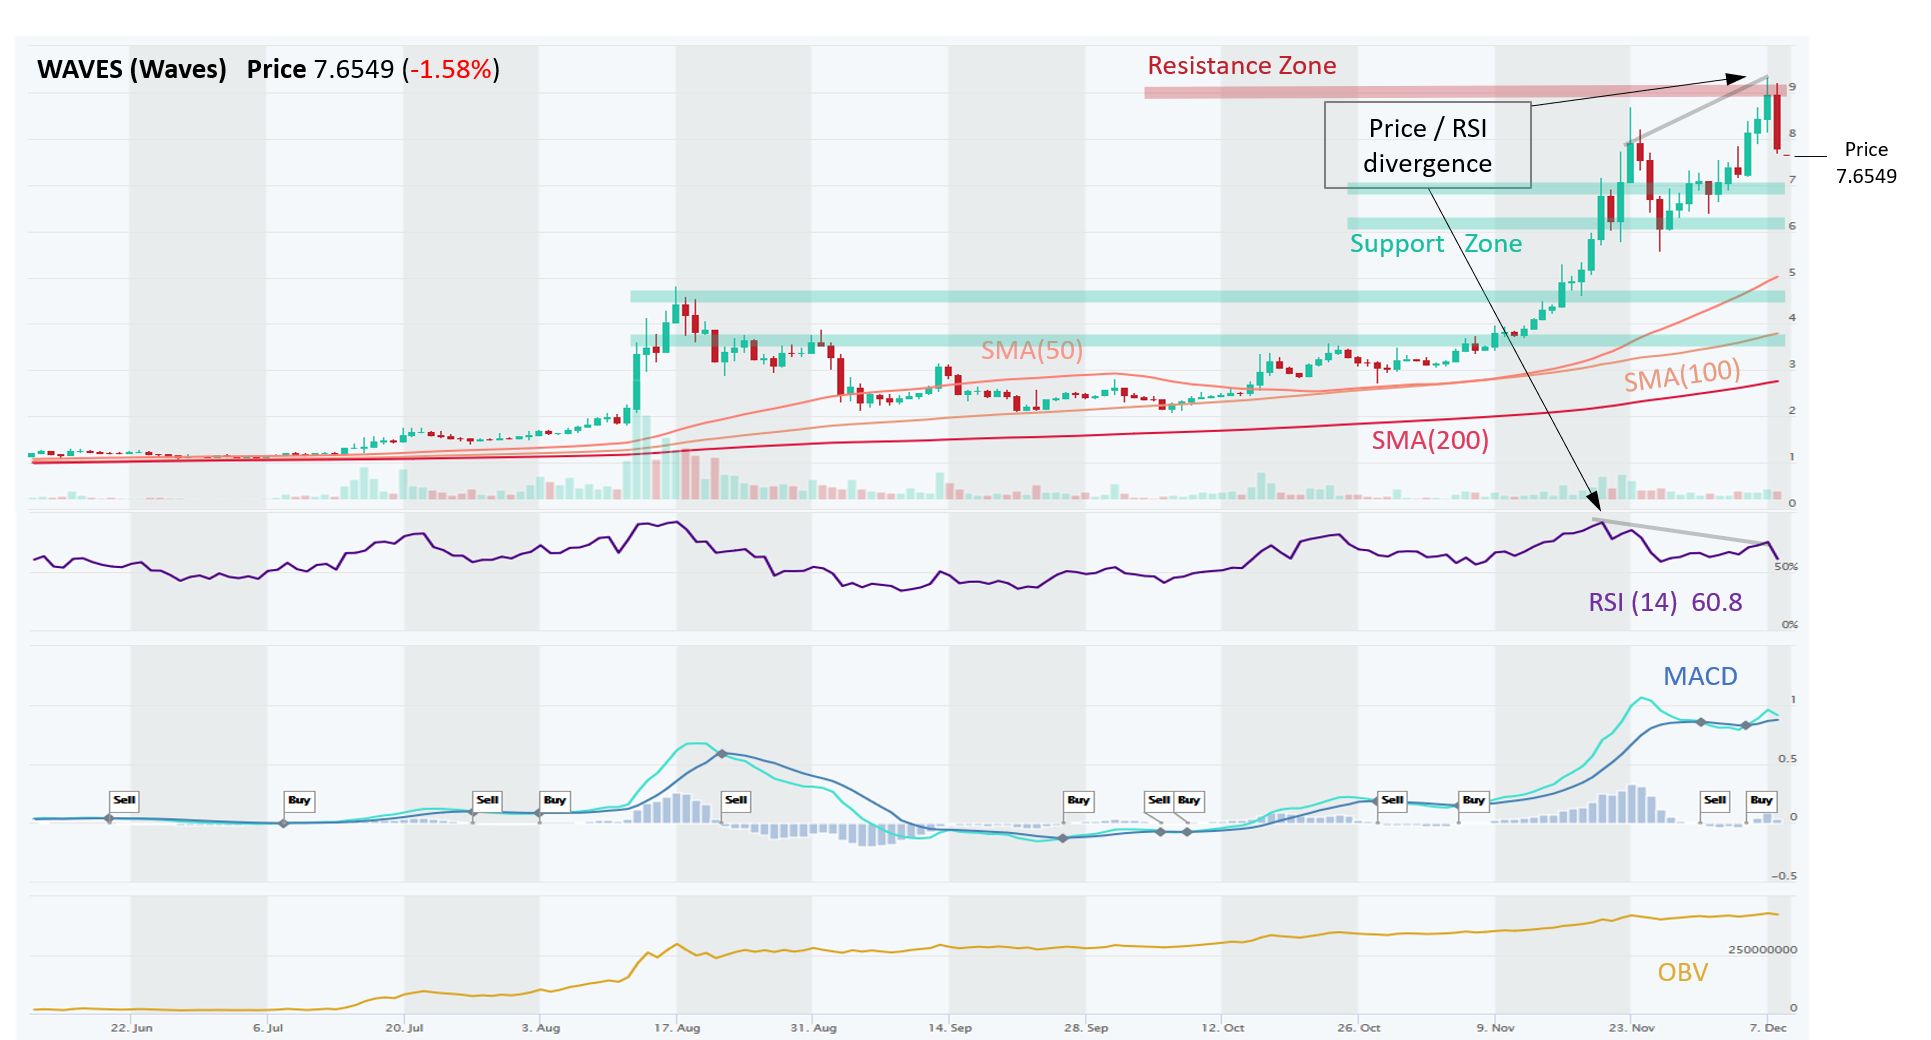
WAVES (Waves) is in a strong Uptrend across all time horizons (Shot-, Medium-, Long-Term). For now, the current pullback still appears to be just that, a pullback in a Uptrend, rather than a trend reversal since the series of Higher Highs and Higher Lows has not been broken.
During October, price started making steady Higher Highs and Higher Lows, markings of solid Uptrend, then it broke through a $3.75 Resistance area and accelerated higher on good volume (OBV rising).
The last sprint higher, however, was on thin ice, forming an RSI Divergence (Price rises but RSI declines). Perhaps that was a forewarning of momentum exhaustion. Price will now correct and consolidate, but it is unclear which Support Zones will hold. WAVES produced some support zone on its way up, but couple of them appear weak ($7.00, $6.00 and $4.75), since little volume exchanged hands there. $3.75 is a far more formidable Support Zone.
Momentum is weakening now, as is typical during a consolidation phase, with RSI declining and MACD also flatlining. OBV is still trending up, which indicates that these bullish price movements were accompanied by adequate volume. ADX (trend strength) is above 40, indicating very strong momentum, but it is declining.
NEO – Consolidating in a Symmetrical Triangle With $15.00 Looking Like a Strong Support Area
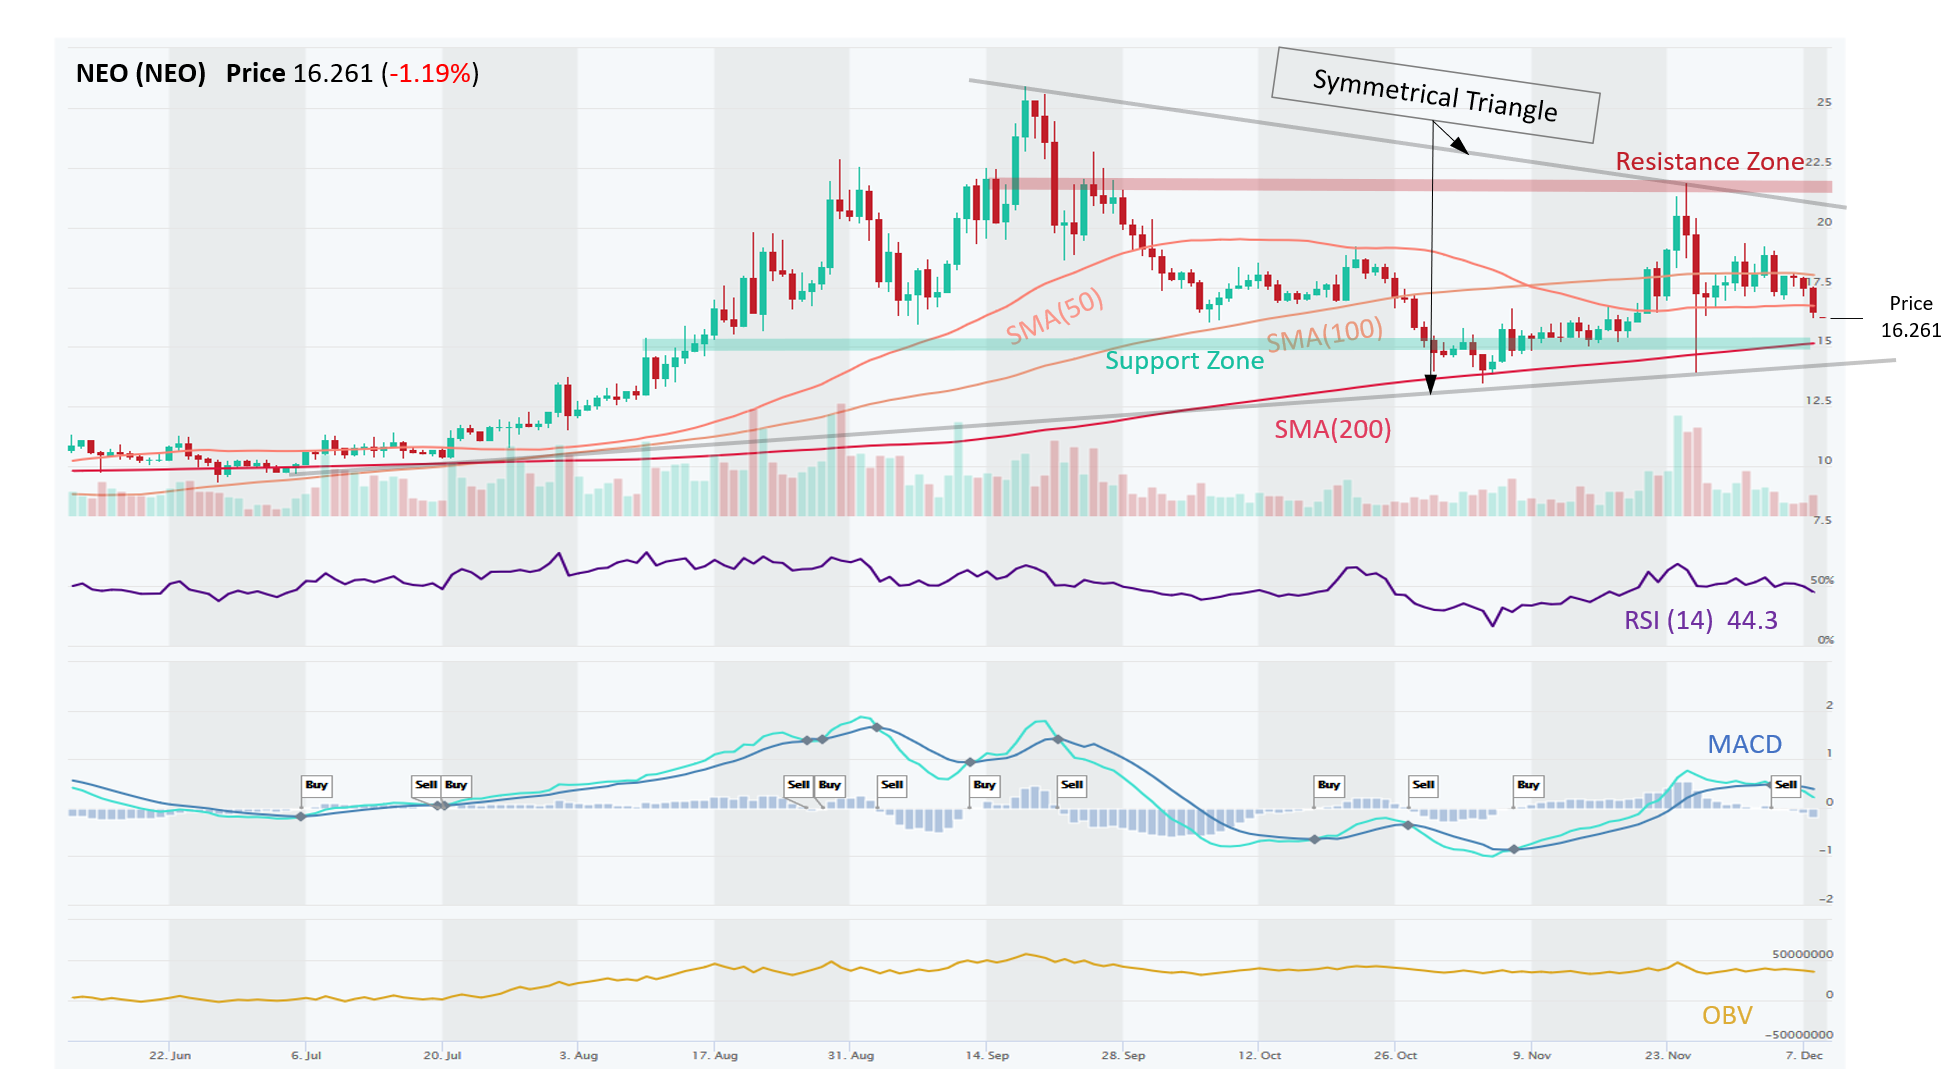
NEO (NEO) is in an Uptrend on all time horizons (Short-, Medium-, Long-Term). Price has formed an emerging Symmetrical Triangle (identified by altFINS’ automated pattern recognition system on 30th November). It is “emerging” because it hasn’t had a breakout yet, then it’ll become “complete”. This means that price is likely to trade within the bounds of the triangle, which can be traded (Buy Support trendline, Sell Resistance trendline).
Other traders prefer to wait for a breakout. Symmetrical triangles are typically continuation patterns, which in our case (Uptrend) means that it should resolve in an upward breakout.
The Triangle Support trendline appears to line up with a horizontal Support Zone and the 200-Day SMA around $15.00, which makes it significant support area. Hence, swing traders could use it as a trade entry area.
Near term, momentum is bearish with RSI crossing below 50 and MACD also making a bearish crossover.
OBV (volume on Up days vs Down days) is flattish, indicating that sellers and buyers are in a relative balance. ADX is below 20 and declining, indicating a weak trend, which suggests further consolidation.
LTC – Rejected Twice, Forms a Bearish Double Top But Most of the Correction Could Have Been Realized Already
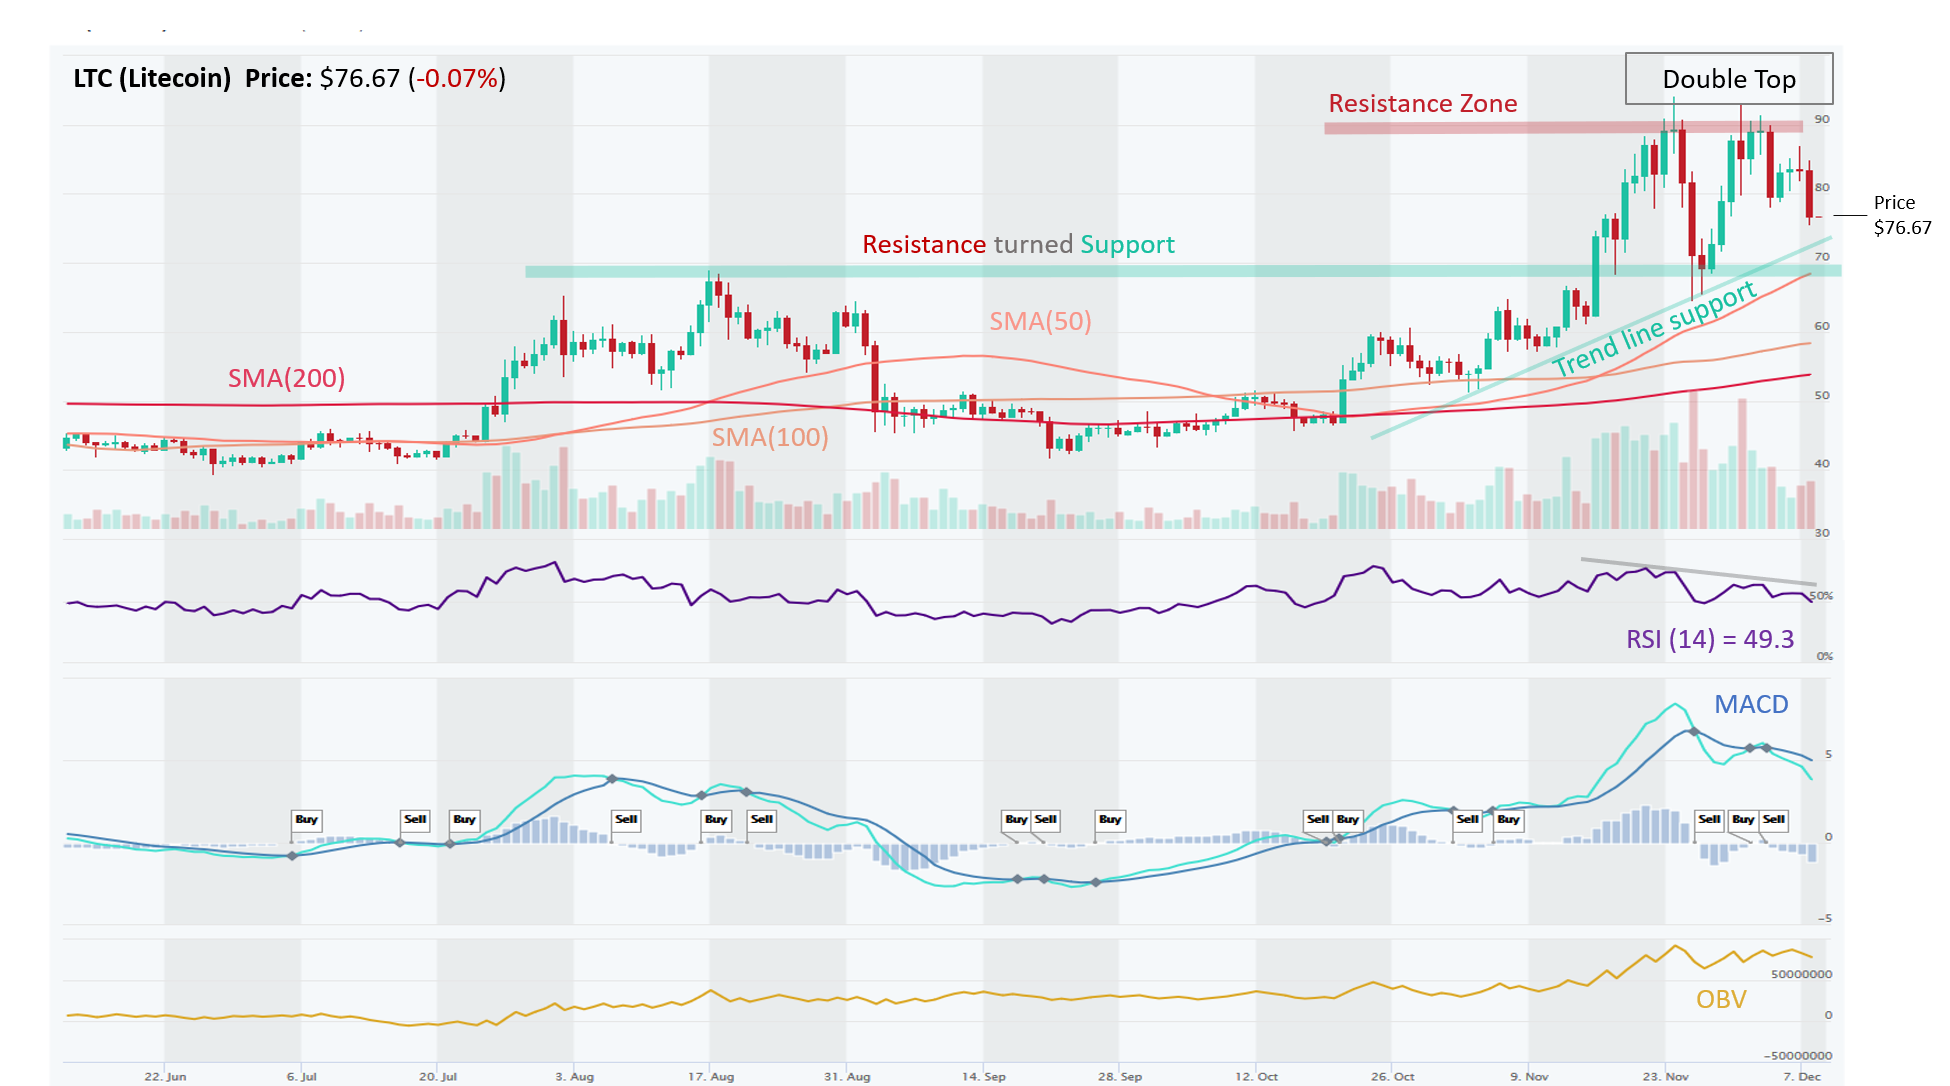
LTC (LiteCoin) is in an Uptrend across all three time horizons (Short, Medium, Long). Short term trend recently ran into a strong Resistance area around $90, which it failed to break on two occasions, forming a bearish Double Top pattern. Now it will correct and consolidate. It is likely to drop down to the Trendline Support (~$75), which it has respected during the recent runup. If not, the next stop is not far away with a horizontal Support Zone around $70.
Momentum has faded following the failed attempt to break $90. Both momentum indicators are indicating a bearish trend (RSI crossed under 50 and MACD crossed under signal line). RSI trend is also downward.
OBV (volume on Up days vs Down days) is flattish, indicating a relative balance between sellers and buyers. ADX is between 20-40, indicating that the overall trend is still strong, but ADX is slightly decreasing.
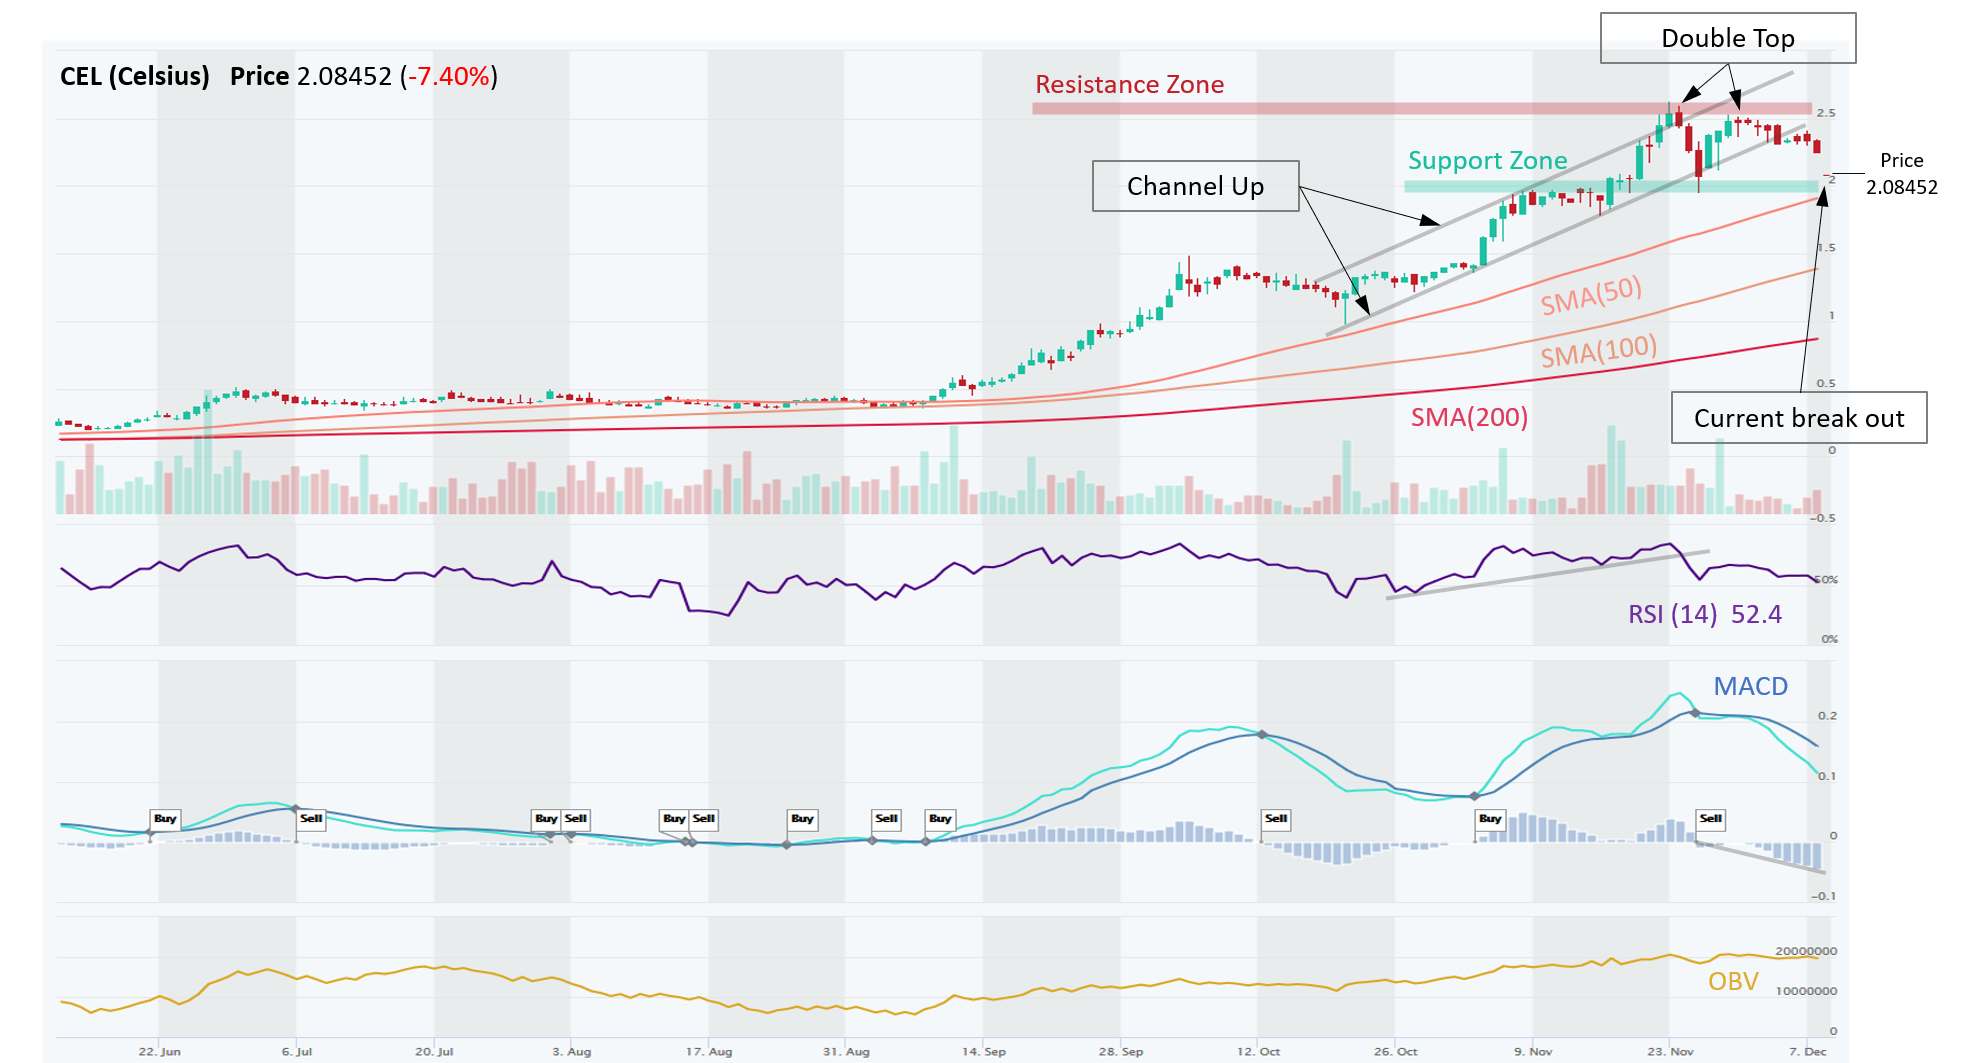
CEL – Broken But Not Out
CEL (Celsius) is in an Uptrend across all time horizons (Short-, Medium-, Long-Term). CEL was trading in a Channel Up until it reached $2.50 Resistance area. It tried to break through twice, failed, and formed a bearish Double Top pattern, which broke the steady series of Higher Highs and Higher Lows we had seen for three months (Sep-Nov).
Volume during this correction has thinned out, so the issue is not that sellers are overwhelming but rather the demand from buyers has dried up. We can also see that in OBV (volume on Up days vs Down days), which is flattish lately, indicating relative balance between buyers and sellers. This offers hope that the Uptrend can resume after a brief consolidation period.
Following the Double Top formation, price recently broke out of the channel to the downside and is revisiting Support area at $2.00, where traders should watch the price action closely. If it holds and bounces, price could revisit the Resistance Area of ~$2.50 again.
Both momentum indicators provided an early warning of changing momentum on Nov 26th when RSI crossed under 50 and MACD had a bearish crossover (Sell).
ADX (trend strength) is between 20-40, which indicates a trend is strong, but ADX is declining.
Disclaimer: This content is for informational purposes only, you should not construe any such information or other material as investment, financial, or other advice. There are risks associated with investing in cryptocurrencies. Loss of principal is possible.
2 Comments
Ray Nielsen December 09, 2020
Thank you for the analysis. I really like the fact that you reiterate the signals and what they mean. I am new to crypto and this is incredibly helpful
Richard Fetyko December 10, 2020
Thanks for reading and your feedback. I believe in keeping things simple and consistent. RSI, MACD, OBV, ADX are foundational building blocks for technical analysis, along with using moving averages (SMA) for spotting trends.