Crypto Market Weekly Recap: Bitcoin, Altcoins and Macro

How did major cryptocurrencies perform last week (W38/2025) compared to traditional equities?
In week 38 of 2025, major cryptocurrencies corrected lower while equities advanced. Bitcoin (BTC) declined by 2.2%, Ethereum (ETH) dropped 8.8%, and Solana (SOL) fell 6.7%. Meanwhile, the NASDAQ index gained 2.2%, showing a divergence between digital assets and traditional tech equities.
The performance of the top 50 coins by market cap
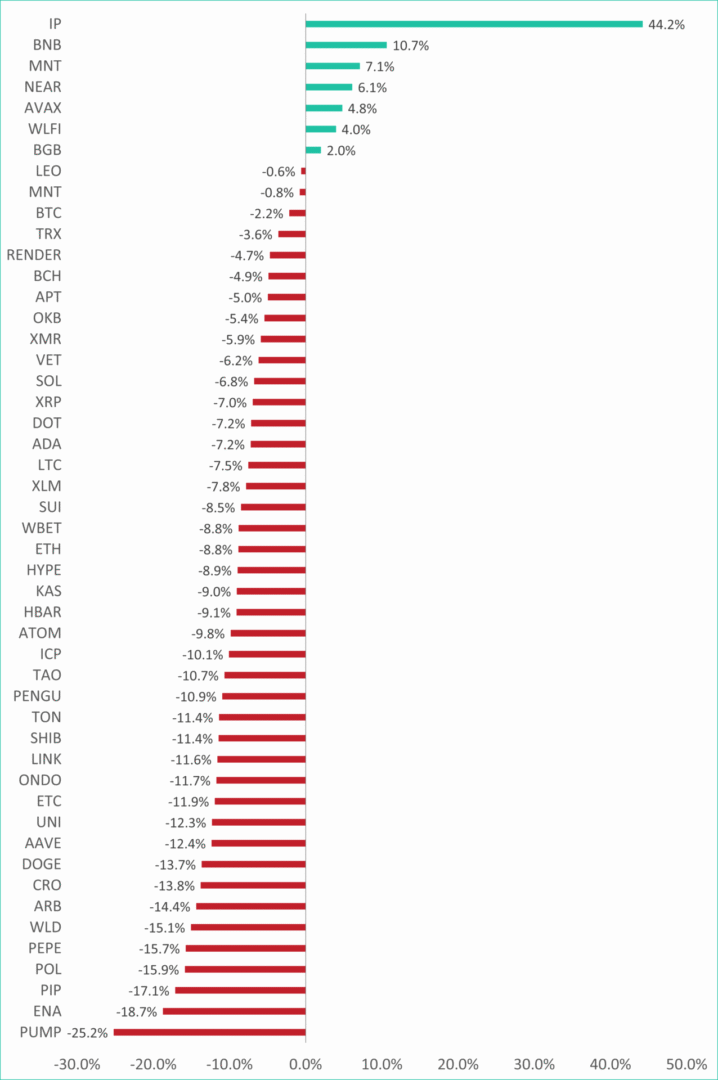 Top Gainers:
-
$IP +44.2%
-
$BNB +10.7%
-
$MNT +7.1%
Top Losers:
-
$PIP -17.1%
-
$ENA -18.7%
-
$PUMP -25.2%
What is the current market sentiment for digital assets and the overall market capitalization?
The digital asset market sentiment is “Neutral”, with a score of 47.00 on the CMC Crypto Fear & Greed Index. The total cryptocurrency market capitalization stands at $3.9 trillion. Bitcoin (BTC) maintains market dominance at 57.7%, while Ethereum (ETH) holds 13.0%.
Which cryptocurrencies have shown the strongest year-to-date (YTD) growth in 2025?
Since the start of 2025, Ethereum (ETH) has been the best performer with a +25.83% gain. Bitcoin (BTC) is up +20.55%, Solana (SOL) has increased +18.16%, and the NASDAQ is higher by +17.19% YTD. Despite last week’s correction, digital assets continue to outperform equities overall.
What does “Total Revenue” indicate for a cryptocurrency, and which coins were top performers in this metric?
“Total Revenue” represents the total fees paid by end-users to use a blockchain or protocol, reflecting both adoption and economic viability. In week 38, the top performers were Tron (TRX), PancakeSwap (CAKE), and Aave (AAVE).
What is “Total Value Locked (TVL)” and which coins had the highest TVL?
“Total Value Locked (TVL)” measures the total user deposits locked in a protocol’s smart contracts, indicating both trust in security and popularity. The leaders in TVL this week were Aave (AAVE), Lido (LDO), and EigenLayer (EIGEN).
How have the revenues for major cryptocurrencies like Ethereum, Bitcoin, and Solana been trending?
-
Ethereum (ETH): Revenues peaked above $35M in March 2024 but have stayed subdued, aside from a short July 2025 spike. Activity remains well below early 2024 levels.
-
Solana (SOL): Revenues surged in late 2024 and early 2025 due to heavy meme coin trading on pump.fun. As this activity cooled, revenues declined.
-
Bitcoin (BTC): Transaction fees and revenues remain low following the fading of inscription and BRC-20 activity, with little recent growth.
What were the key macroeconomic highlights and market predictions for the week?
The FOMC delivered a 0.25% rate cut, lowering the federal funds target range to 4.00% – 4.25%. Markets are now pricing in two additional 0.25% cuts in 2025: a 92% probability of another cut in October and a 79% probability of one in December. Broader macroeconomic indicators, including retail sales and manufacturing survey results, point to slowing economic activity, reinforcing expectations of easing policy.
📖 Read the full weekly market report here.
🎧 Listen to the weekly altFINS podcast.
0 Comments
Leave a comment