Relative Strength Index (RSI) Indicator Explained

Cryptocurrency trading is a dynamic and high-stakes endeavor, and having a robust strategy is vital for success. Among the many tools available to traders, the Relative Strength Index (RSI) stands out as a versatile indicator. In this article, we will explore the RSI indicator, understand its calculations, and uncover its significance in crypto trading. We will delve into strategies and tips for effectively utilizing the RSI to enhance your trading decisions. Additionally, we will quide you trough altFINS platform’s signals summary, crypto screener and market highlights section, where you can easily find RSI indicator.
Understanding RSI
The Relative Strength Index, commonly referred to as RSI, serves as a momentum indicator in cryptocurrency markets. This oscillator ranges between 0 and 100 and helps traders in determining the recent size of price changes. To calculate the RSI, you can use the following formula:
RSI = 100 – 100 / (1 + RS)
Where RS signifies the average gain of up periods during a specified timeframe divided by the average loss of down periods during the same timeframe. The RSI is particularly useful for identifying overbought conditions (RSI above 70) and oversold conditions (RSI below 30). Some traders opt for more stringent levels, such as 80/20, to reduce false signals.
Tips for Utilizing RSI in Crypto Trading
- Spot Divergences: Divergence analysis is a powerful technique where traders look for disparities between cryptocurrency prices and RSI readings. If the price moves in one direction while the RSI moves in the opposite direction, it can signal an impending trend reversal.
- Combine with Other Indicators: To maximize the effectiveness of the RSI, consider using it in conjunction with other technical indicators, such as moving averages, trendlines, and support/resistance levels. This comprehensive approach can provide more robust trading signals.
- Don’t Rely Solely on RSI: While the RSI is a valuable tool, it should not be your sole basis for trading decisions. Always consider the broader context, including market sentiment, news events, and fundamental analysis, before executing a trade.
Practical Application of RSI in Crypto Trading
Now, let’s explore specific scenarios where the RSI indicator can guide your crypto trading:
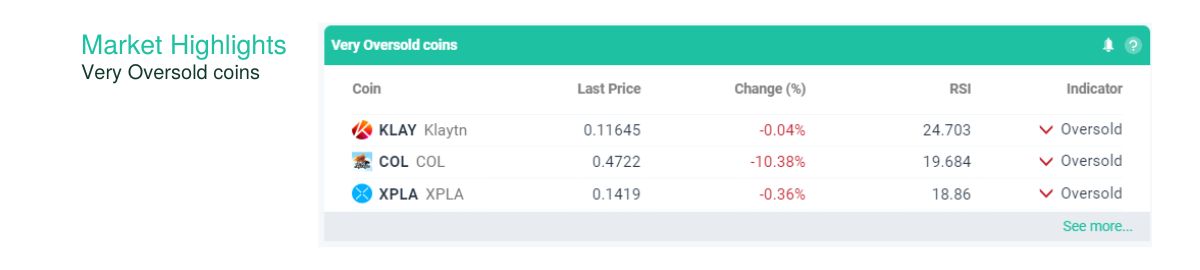
- Buying Oversold Cryptocurrencies: When you encounter a cryptocurrency with an RSI reading below 30, it suggests that the asset might be oversold. This often presents an opportunity to buy, as oversold assets are more likely to experience a price rebound.
- Selling Overbought Cryptocurrencies: Conversely, when a cryptocurrency’s RSI reading exceeds 70, it indicates overbought conditions. This might be an ideal time to consider selling your position, as overbought assets frequently undergo pullbacks.
- Identifying Trend Reversals: A crucial skill for crypto traders is recognizing potential trend reversals. If a cryptocurrency’s price trend diverges from the RSI direction (e.g., falling price with a rising RSI), it could foreshadow a forthcoming trend reversal.
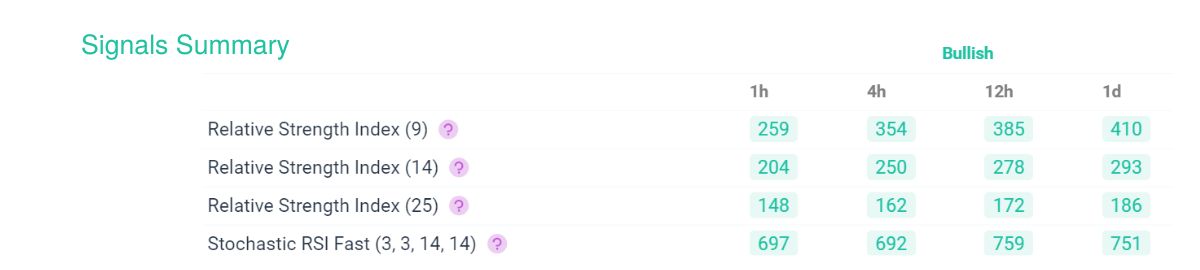
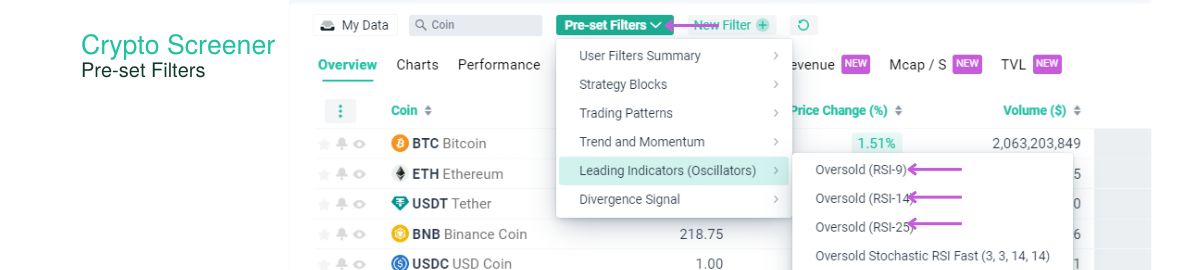
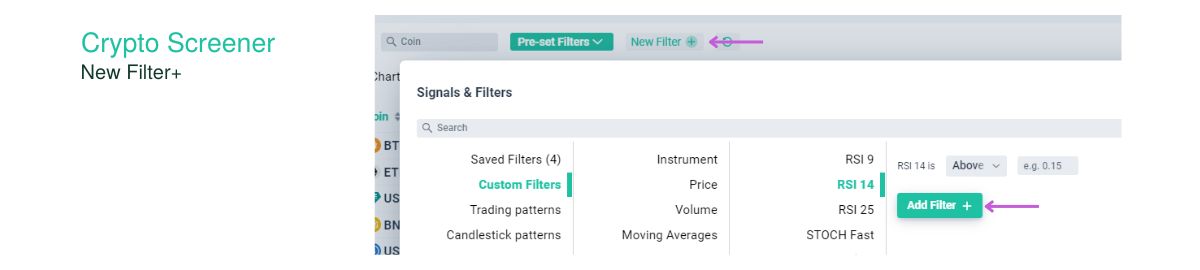
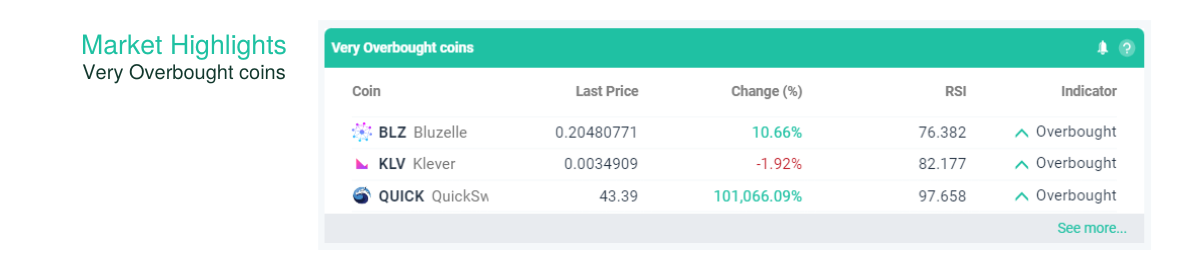
How To Identify Relative Strength Index (RSI) RSI on altFINS platform?
Explore Signals Summary, Crypto Screener or Market Highlights:
Conclusion
The Relative Strength Index (RSI) is an indispensable tool in the crypto trader’s toolkit. By understanding its calculations, learning to spot divergences, combining it with other indicators, and applying it in practical scenarios, you can significantly enhance your crypto trading strategy. Remember that while the RSI is a valuable ally, it is most effective when used in conjunction with a comprehensive analysis of market conditions. Crypto trading is an evolving landscape, and continuous learning is the key to mastering it.
0 Comments
Leave a comment