I see descending triangles, everywhere...ADA, EOS, DASH, XLM, VET
In the American supernatural psychological thriller The Sixth Sense (1999), Cole Sear is a boy who is able to see and talk to the dead. But everyone else thinks he’s just a psycho kid.
Cole Sear: I see dead people.
Dr. Malcolm Crowe: How often do you see them?
Cole Sear: All the time. They’re everywhere.
Well, we see descending triangles, everywhere.
And typically, that is not a good sign. Descending triangles are typically a bearish continuation pattern. In other words, they typically get resolved in a bearish breakdown. Sometimes, they can form a reversal pattern into an uptrend – see ADA example below.
A descending triangle is a bearish chart pattern that is created by drawing a trend line connecting a series of lower highs and a second horizontal trend line that connects a series of lows. Watch for a move below the lower support trend line because it suggests that the downward momentum is building and a breakdown is imminent. Once the breakdown occurs (on big volume), traders can enter into short positions.
In general, the price target for the chart pattern is equal to the entry price minus the vertical height between the two trend lines at the time of the breakdown. The upper trend line resistance also serves as a stop-loss level for traders to limit their potential losses.
More on patterns here.
So while many altcoins have pulled back 30%+ in September, beware of catching a falling knife…or a descending triangle that can stab you just as bad.
Let’s take a look at some examples:
DASH is clearly in a descending triangle pattern, formed by connecting the lower highs, and the support line. We’re approaching the end of this triangle….keep an eye on a breakout.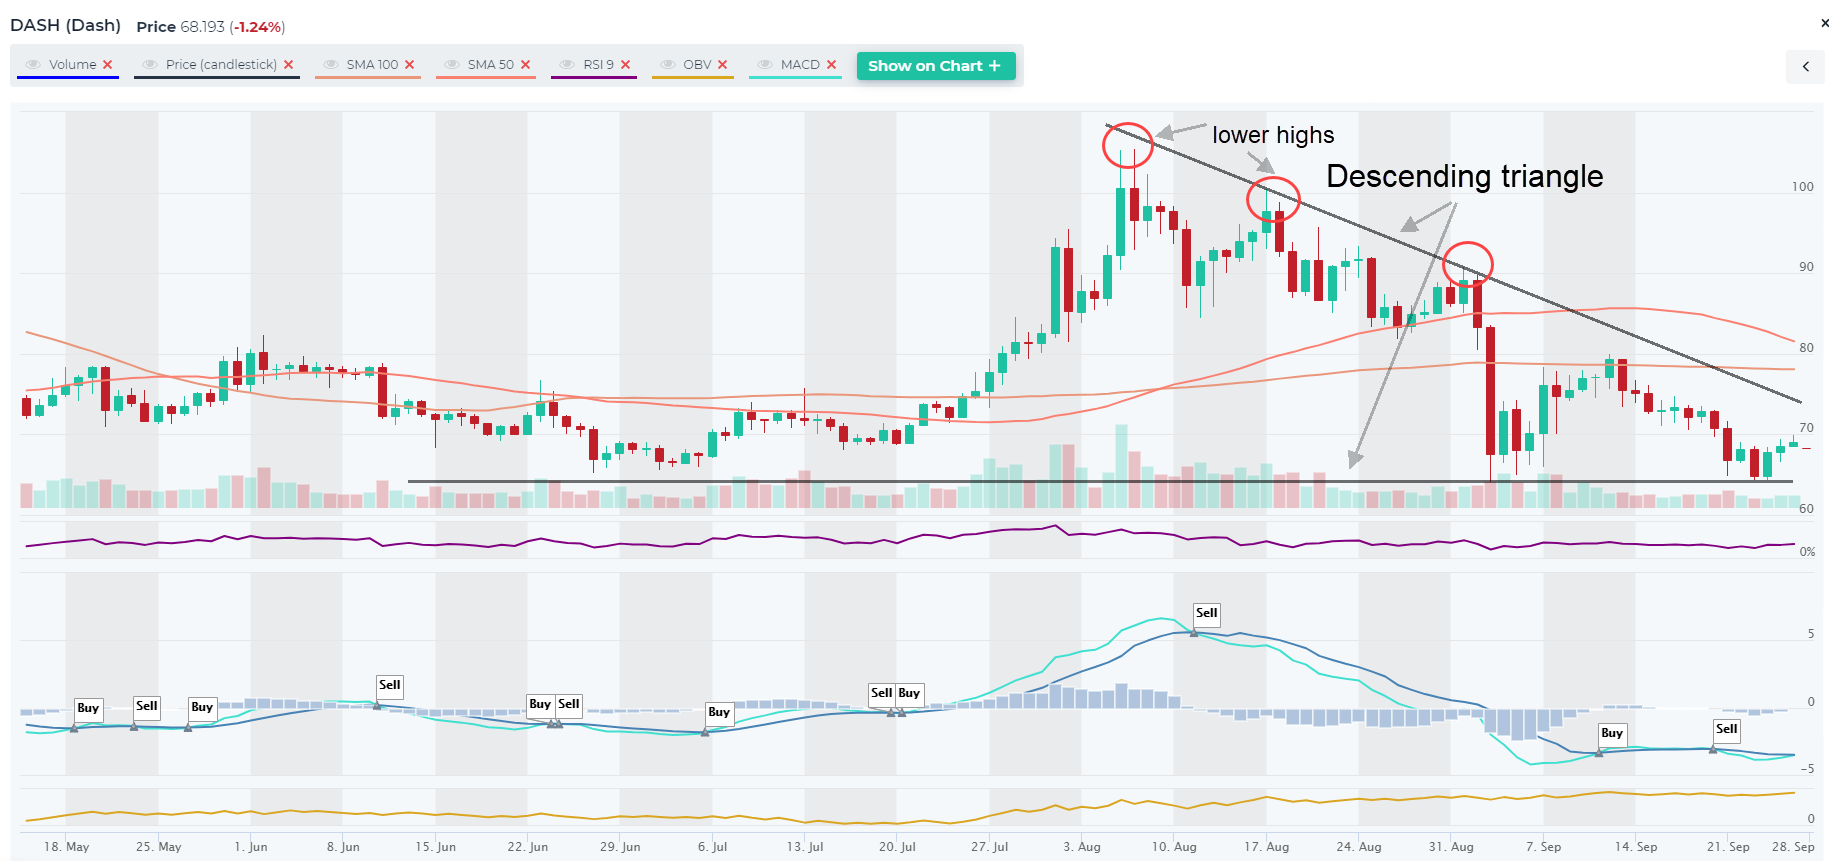
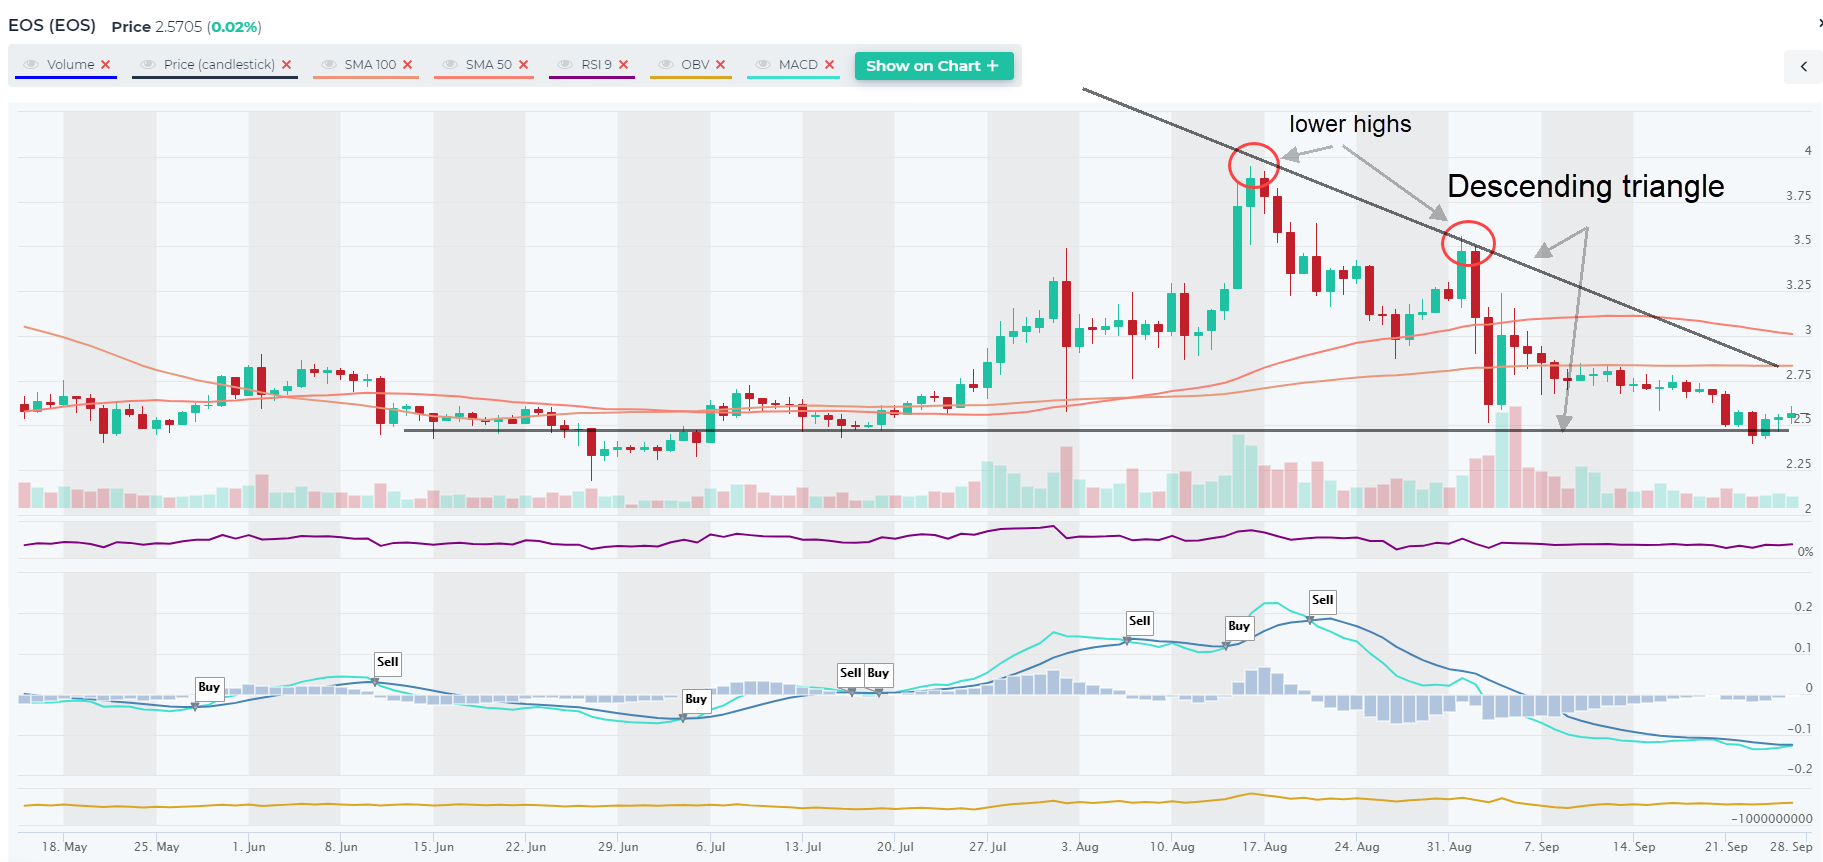
EOS is another example of a descending triangle, reaching its pinnacle.
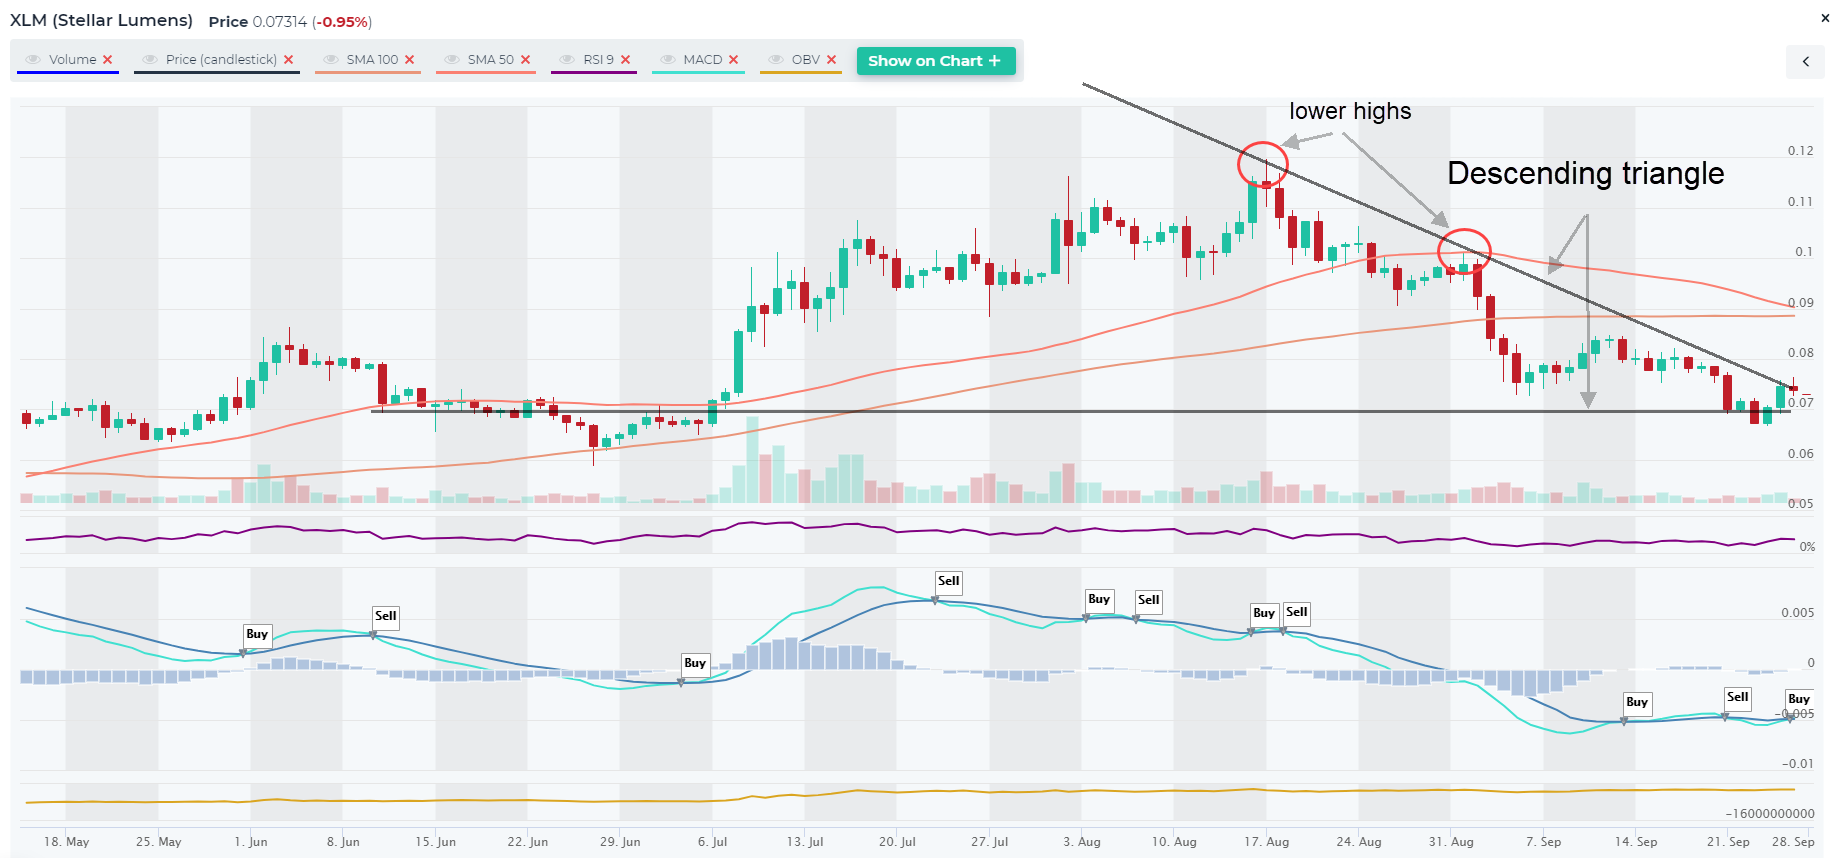
Stellar (XLM) is also at the precipice of a breakout.
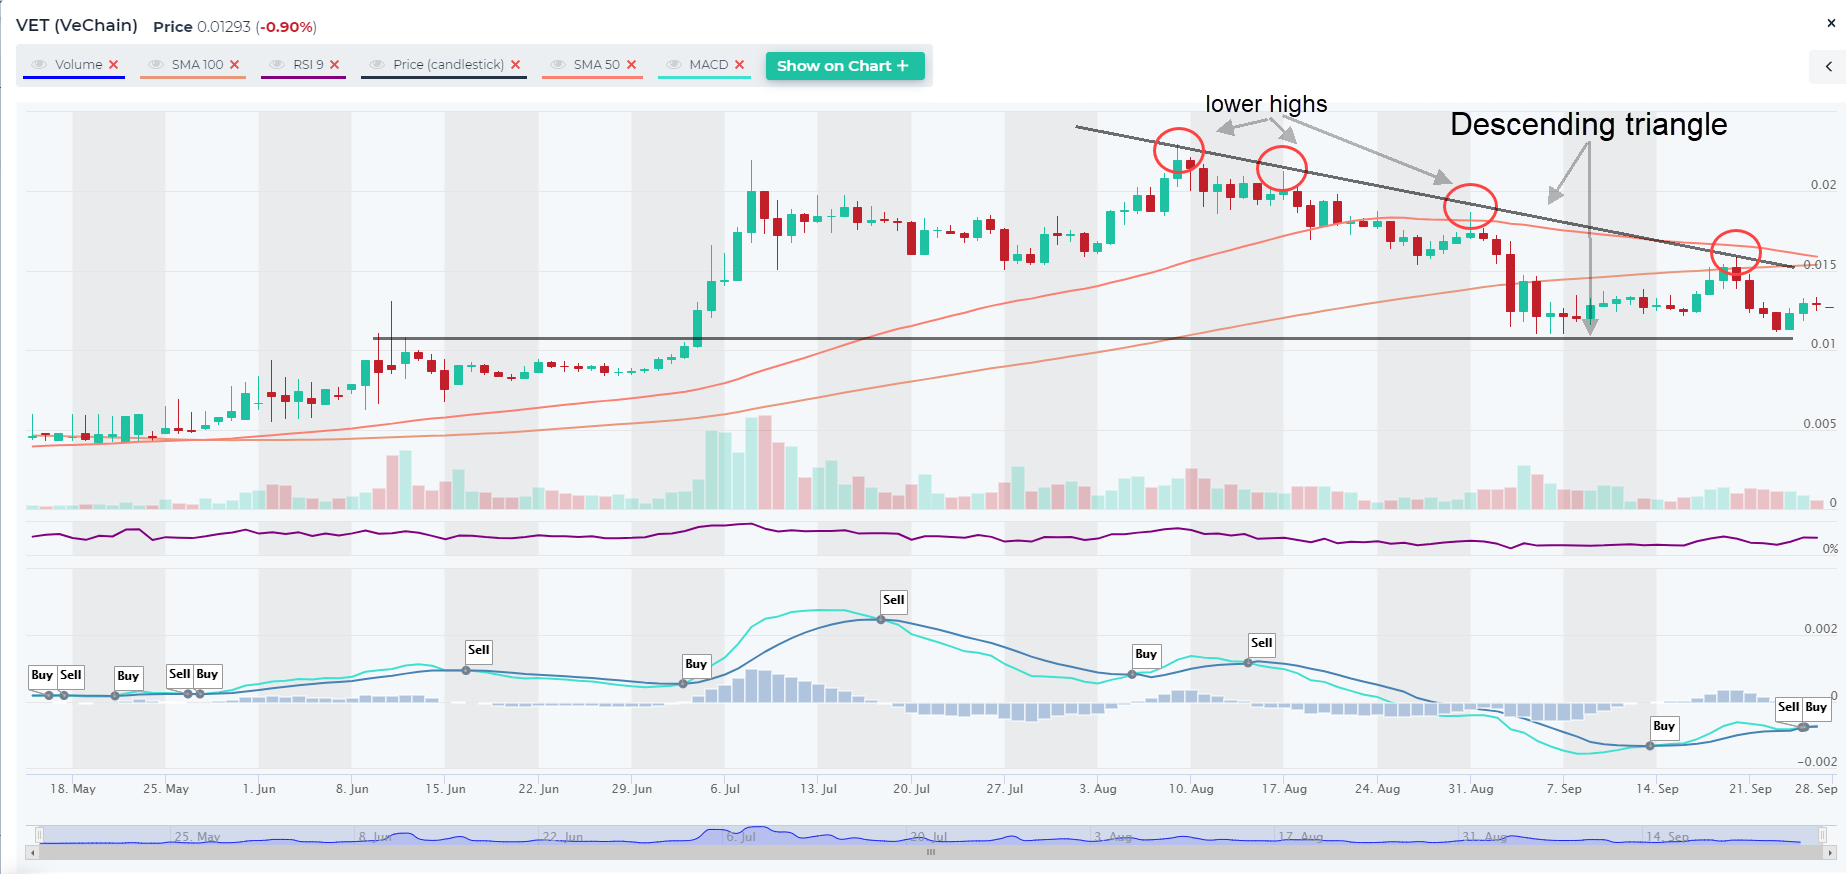
VeChain (VET) is also a good example of a descending triangle that could end ugly in the next few days.
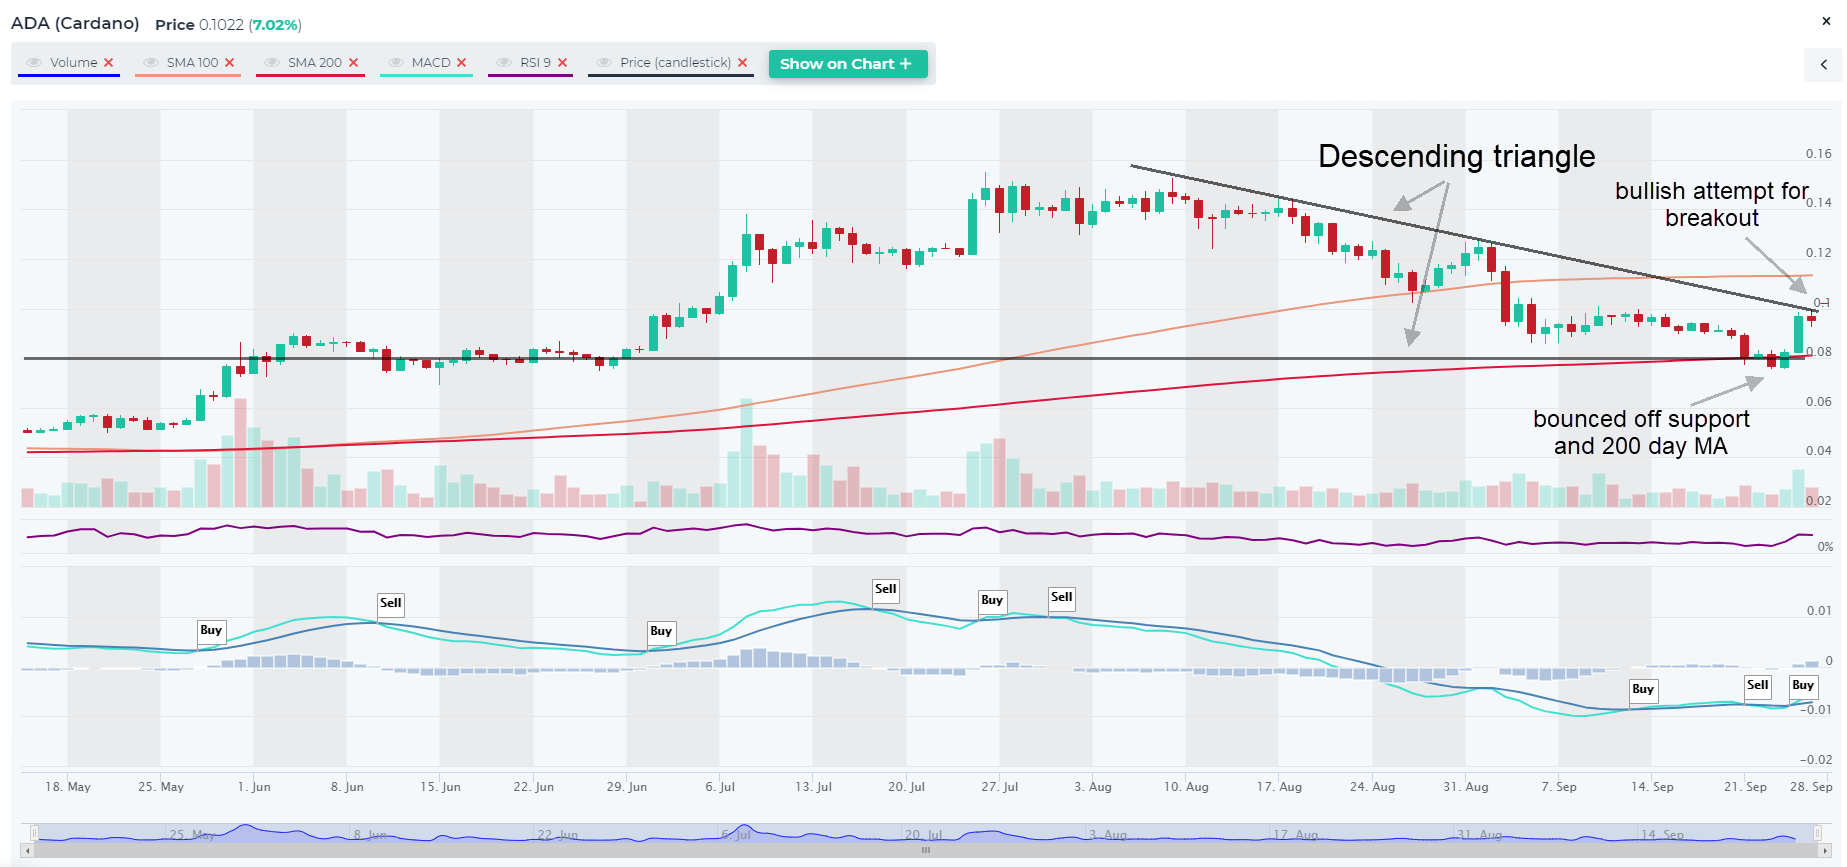
At times, descending triangles can form as a reversal pattern to an uptrend. The following chart shows Cardano (ADA) attempting to do just that as it’s breaking through the upper trendline as we speak. Today’s close could be a deal breaker. If it closes above the trendline and above the prior high from 13th of Sept, the odds will be that it’s a bullish reversal. MACD and RSI have also turned bullish.
Risk management – Stop Loss and trade size. In all of these setups, traders should use Stop Loss orders to manage their downside risk, in case the trade goes against us, as it often will. Trading is about probabilities and even though these setups have a high win rate, one must be prepared to minimize losses on the trades that go bust. If Stop Loss order types are not supported by they exchange, at least set up a price alert (see video). Also, trade size should be such that you never risk losing more than 2% of your total equity. Keeping the trade size small allows the trader to setup a wider Stop Loss, which gives the trade more room and time to complete with success. Setting Stop Loss levels too tight can often result in getting knocked out of a trade prematurely.
Disclaimer: This content is for informational purposes only, you should not construe any such information or other material as investment, financial, or other advice. There are risks associated with investing in cryptocurrencies. Loss of principal is possible.