Cryptocurrency Price Analysis - week 10 and YTD (2021)
Cryptocurrency Price Analysis – week 10 and YTD, 2021
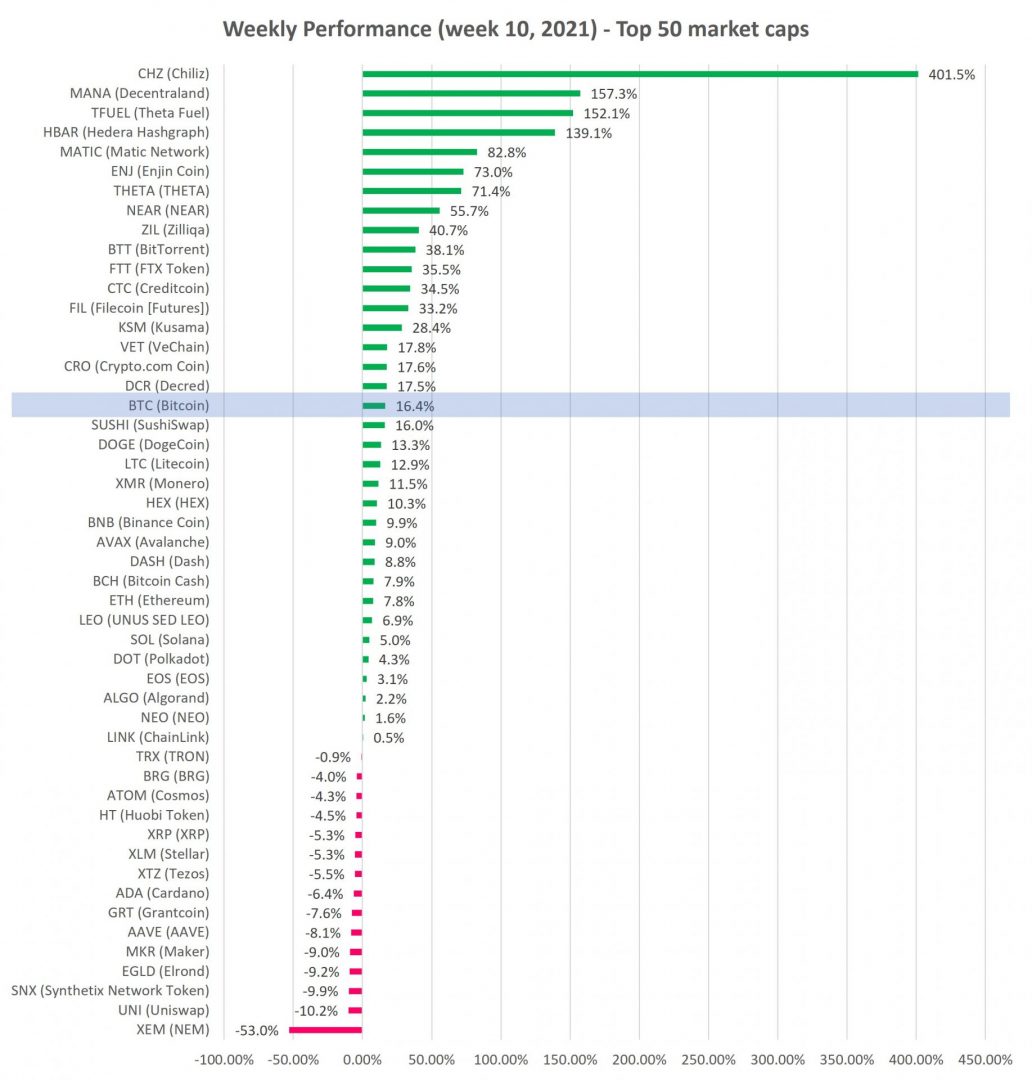
Last week, cryptocurrency prices continued their march higher, with most of top 50 coins by market cap ending the week in the green (see chart), coat tailing BTC’s rebound to ATH (~ $60K).
Crypto markets are likely to go sideways for a few weeks, consolidating massive gains from early 2021 period. Consolidation areas in an Uptrend often show up as Triangles (symmetrical, descending or ascending) or sideways channels.
When markets pull back, check our Signals Summary for pullback in Uptrend opportunities.
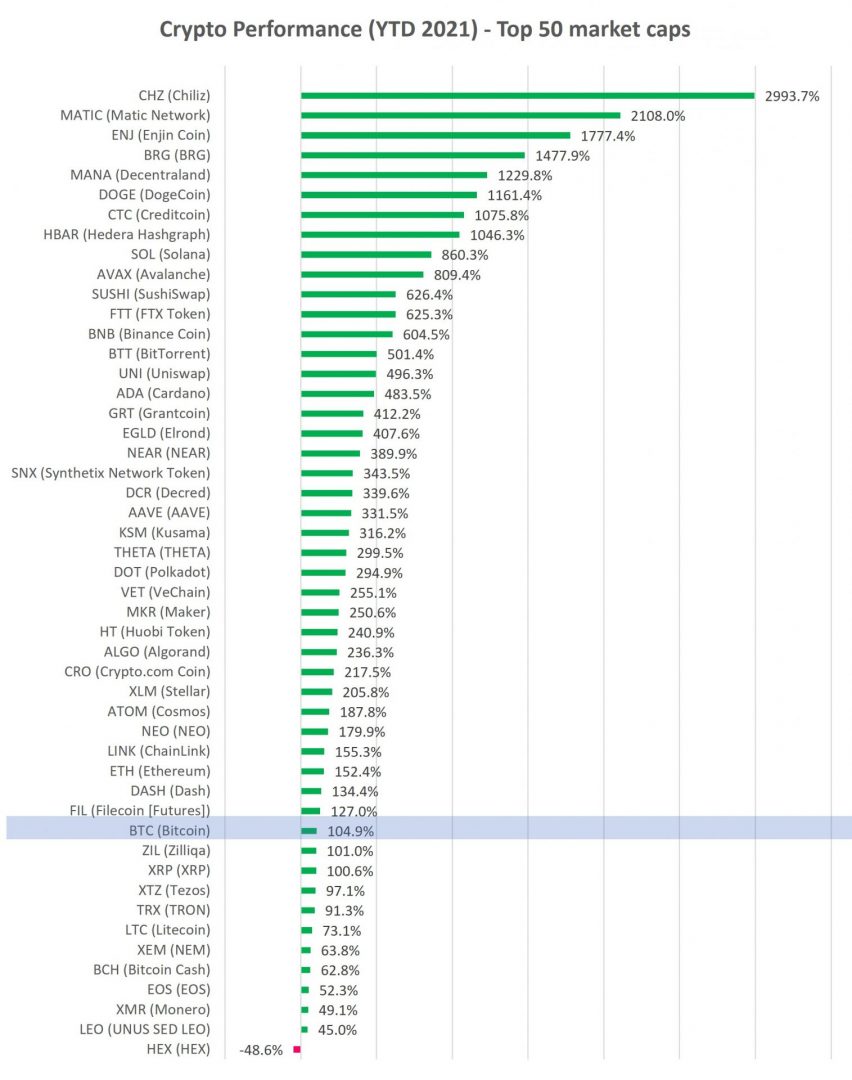
Bitcoin (BTC) and Ethereum (ETH) were up 16.4% and 7.8% (versus prior week’s 10.2% and 18.7%), respectively, recovering all of the loses and returning to their ATH.
Read our technical analysis of top coins under Curated Charts section.
Source: altFINS.com
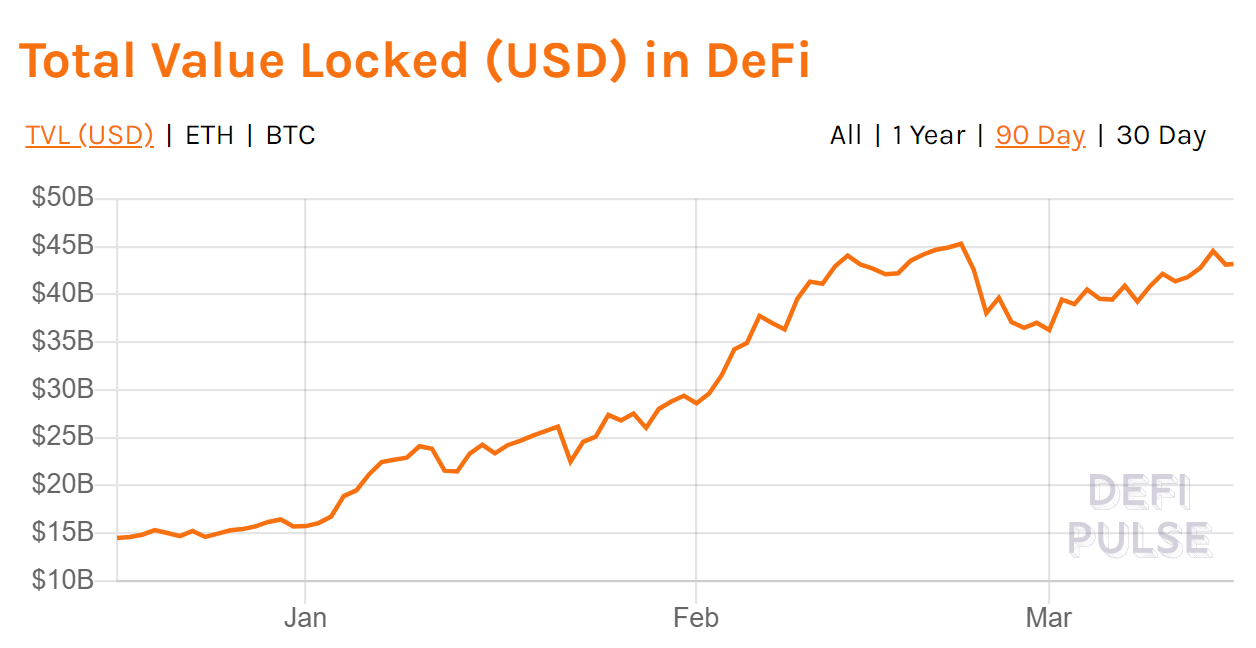
Decentralized Finance (DeFi) – Total Value Locked (TVL) increased by 12.4% last week to $43.1B, near its peak of $45.5B (Feb 2021) but is still up 175% YTD.
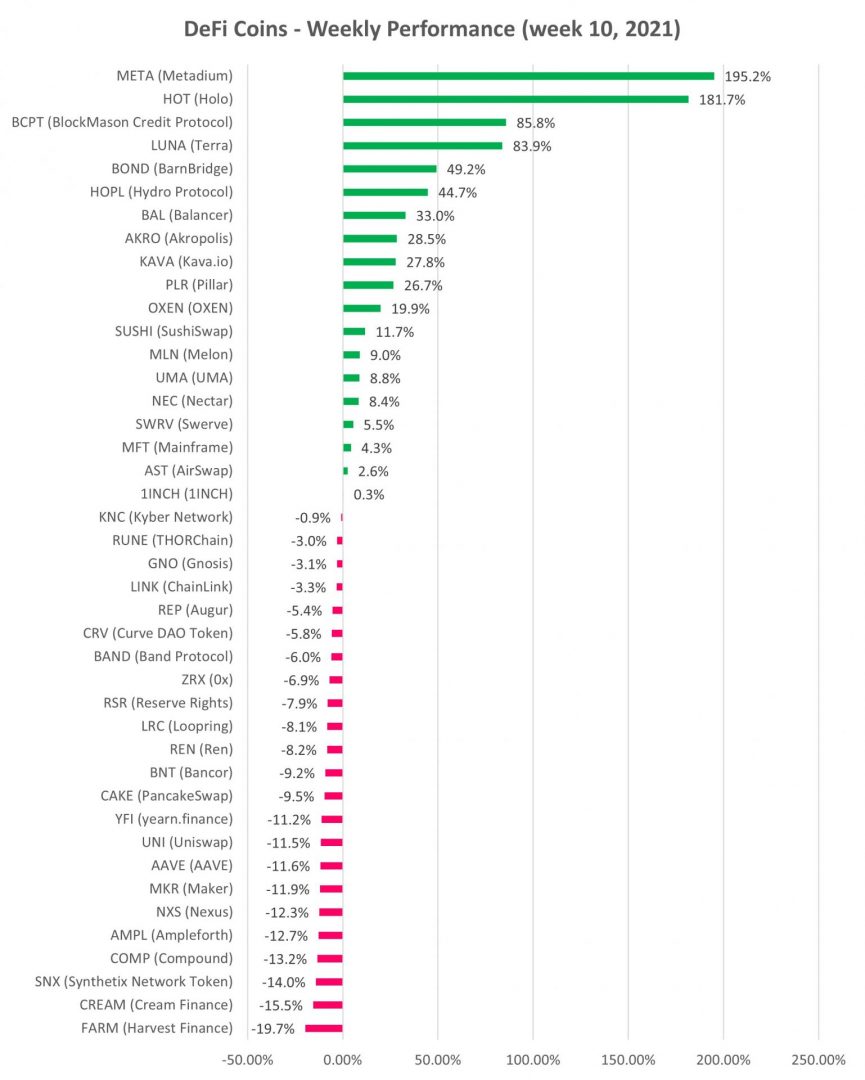
DeFi crypto trading prices were up modestly as total DeFi category market cap increased 2.5% last week and is up 303% YTD (i.e. ~ 4x).
Source: DeFiPulse
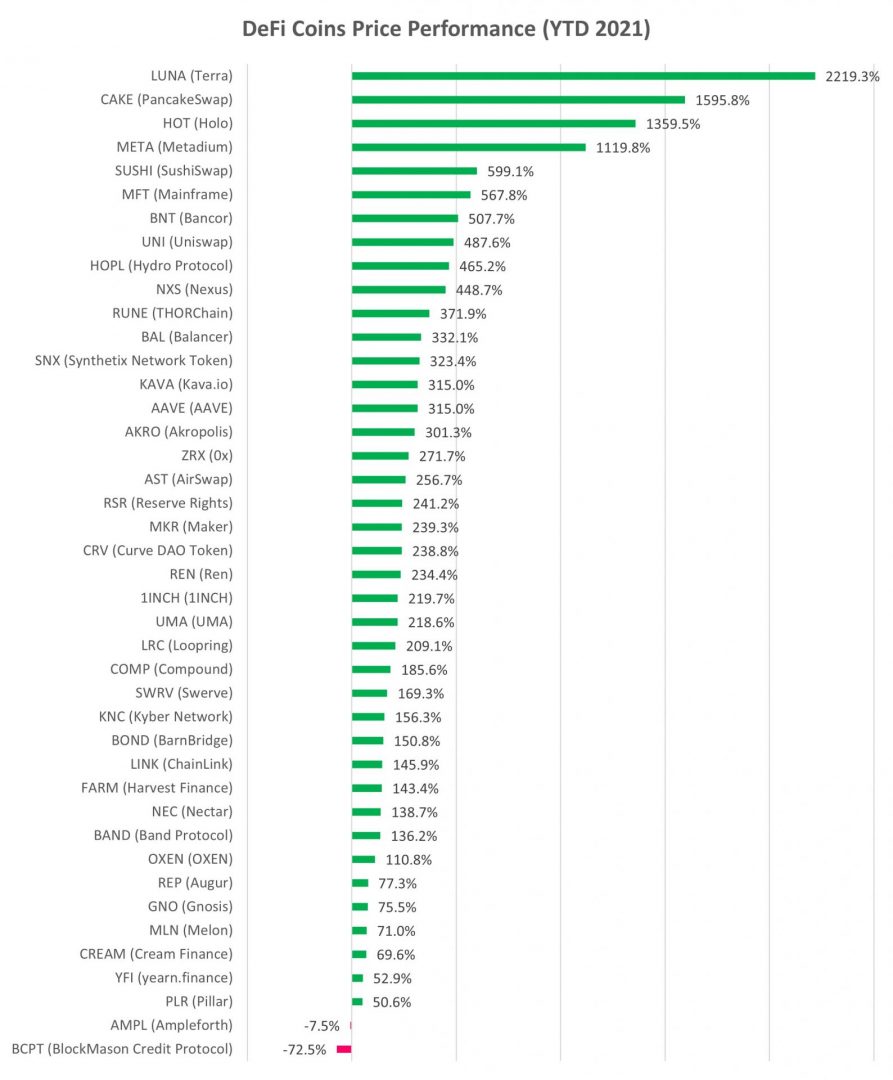 Source: altFINS.com
Check our unique automated chart pattern recognition for fresh trading ideas. Also, during market corrections, it’s always good to revisit coins in an Uptrend but with a pullback. Our Signals Summary has this and other pre-defined filters ready for action.
Subscribe to our newsletter to receive future blog updates in your inbox and make sure you add altfins.com to your email whitelist.
Disclaimer: This content is for informational purposes only, you should not construe any such information or other material as investment, financial, or other advice. There are risks associated with investing in cryptocurrencies. Loss of principal is possible.