Crypto Swing Trade Setups
Crypto Swing Trade Setups
Markets experienced a strong and much needed bounce yesterday, setting up some solid crypto swing trades.
Swing trading attempts to capture the momentum swings in any trend (up or down). It’s not day trading but it’s more aggressive and frequent than Trend trading.
Trends for most coins are currently mixed at best, busted up, unclear, as we noted in yesterday’s blog. Perhaps the roaring uptrend is over and this will become truly a trader’s market, particularly a Swing trader’s market.
While Trend traders try to catch a trend and ride it, Swing traders are looking to enter on momentum upswing and exit when momentum loses steam.
Prices tend to swing up and down, even when they trend. Notice the up and down swings in the ALGO chart below.
One of the best momentum swing indicator is MACD. altFINS shows Bullish (Buy) and Bearish (Sell) MACD crossovers in the charts:
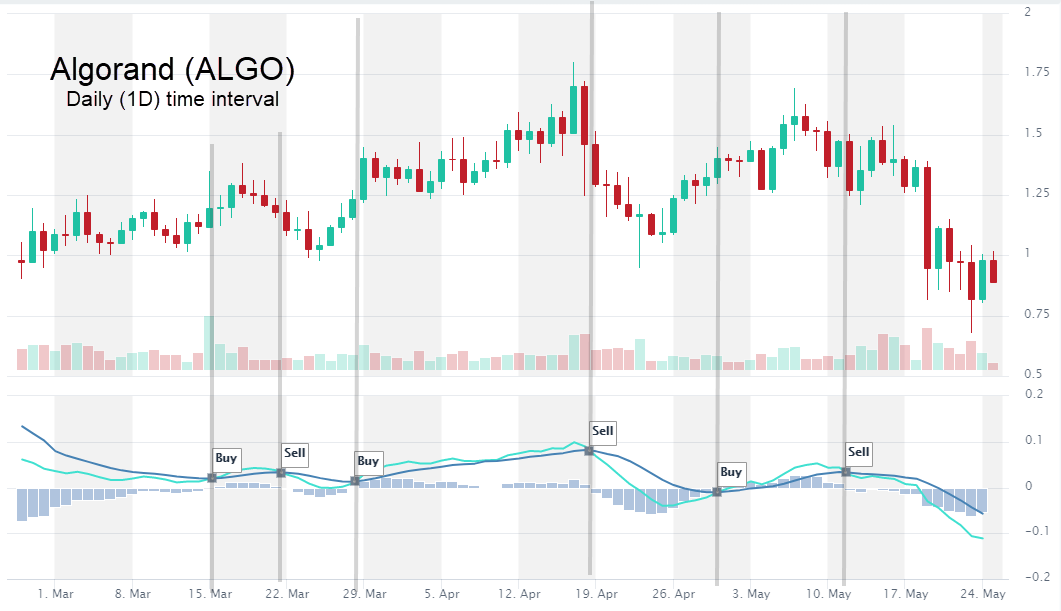
MACD is not perfect. There will be times when it totally whipsaws (frequent changes in Buy/Sell signals) and loses money. But in general, it’s a great momentum indicator that can be used by Swing and Trend traders alike.
It will not pick the bottoms or the tops, but it helps avoid big loses and helps enter on established momentum.
Watch a video tutorial on how to create a MACD crossover signal for a specific coin (ADA example – 2nd video on the list).
Read more on using MACD for trading.
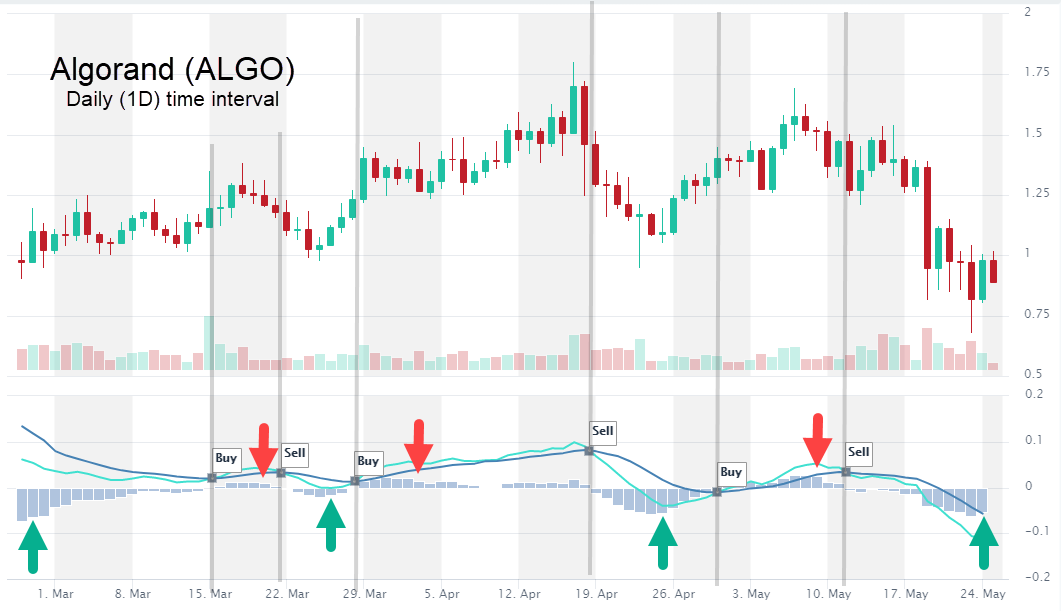
Early MACD signal: Histogram bars. Aggressive Swing traders can try to anticipate MACD Buy/Sell signals using MACD Histogram bars.
When the slope of the MACD Histogram changes, traders should take notice. When MACD Histogram peaks and begins to decline (blue bars), that’s a potential sell signal to a trader and it would occur sooner than the “Sell” Signal Line crossover (see Bitcoin chart below). And when MACD Histogram troughs and begins to rise (blue bars), that’s a potential buy signal.
In the ALGO chart below, notice how the change in the slope (red and green arrows) would give traders an earlier trade signal than a MACD Signal Line crossover (grey vertical lines).
That slight difference in timing could make a huge difference in profits!
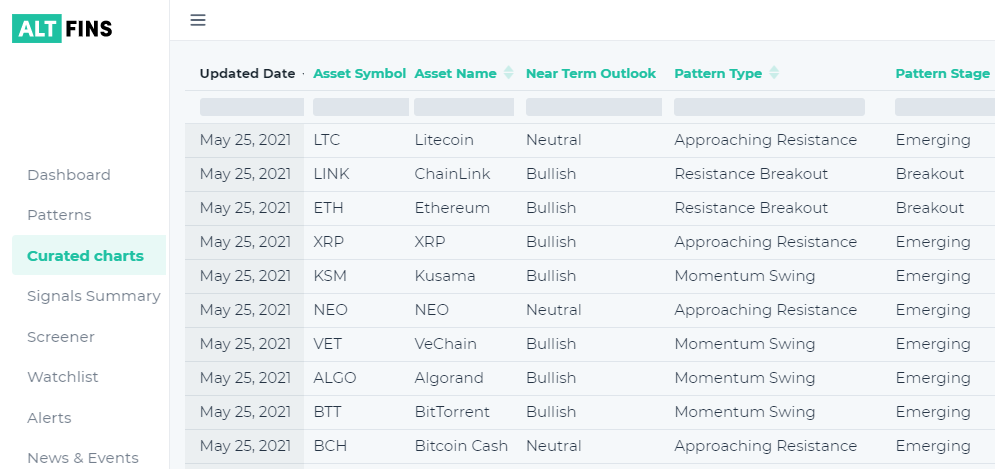
Following yesterday’s bounce, we see many coins with MACD Histogram inflecting to bullish. See table below for “Momentum Swing” (KSM, VET, ALGO, BTT).
It could be early and more patient traders could instead wait for a full-fledged MACD Buy / Sell crossover signal. But for more aggressive Swing traders, the change in the Histogram slope could be an early clue.
Here are the latest curated charts updates:
Check our unique automated chart pattern recognition for fresh trading ideas. Also, during market corrections, it’s always good to revisit coins in an Uptrend but with a pullback. Our Signals Summary has this and other pre-defined filters ready for action.
Download altFINS Mobile App
Follow us on:
✅ Telegram: https://t.me/altfinsofficialchat
✅ Twitter: https://twitter.com/AltfinsA
✅ Discord: https://t.co/uBvlTWgRgP
✅ Facebook: https://www.facebook.com/altFINS
✅ YouTube: https://t.co/QCvKBODSKH
✅ Reddit: https://www.reddit.com/user/altFINS_official
✅ Instagram: https://www.instagram.com/altfins_altcoins/
✅ LinkedIn: https://www.linkedin.com/company/altfins
Disclaimer: This content is for informational purposes only, you should not construe any such information or other material as investment, financial, or other advice. There are risks associated with investing in cryptocurrencies. Loss of principal is possible.