Catching the Dip: The 200-SMA Pullback Strategy

In crypto, “buying the dip” is a common mantra, but doing it without a plan is just guesswork. One of the most reliable ways to find high-probability entries is by identifying pullbacks in an uptrend near the 200-day Simple Moving Average (SMA).
This strategy focuses on assets that are structurally strong but temporarily “on sale.” Here is why this setup works and how you can find these opportunities in seconds using altFINS.
Why This Strategy Works
The 200-day SMA is often called the “institutional line in the sand.” Large investors and market makers use it to define the long-term trend. When a price is above this line, the asset is in a “bull market” phase.
Because so many traders watch the 200 SMA, it often acts as a “self-fulfilling” support level where buying pressure naturally increases.
Prices that rally too far above their average eventually need to “retest” that average. A pullback to the 200 SMA represents a return to a “fair” long-term value.
Low Risk, High Reward: By buying near the 200 SMA during an uptrend, you can place a tight stop-loss just below the moving average, giving you a very attractive risk-to-reward ratio.
Why Screen for This Specific Setup?
Manual searching is impossible when there are thousands of altcoins. By using a Crypto Screener or AI Copilot with these four specific criteria, you filter out the noise and focus only on the highest-quality setups:
- Price between 100% and 105% of 200 SMA: This ensures the asset is sitting right on top of its “floor,” not hovering in no-man’s land.
- Medium-term Uptrend: This confirms that despite the recent dip, the overall market structure remains bullish.
- Down 5% in the Last Week: This identifies the “dip.” We want assets that have recently corrected, creating a discounted entry point.
- Market Cap > $5M: This filters out “rug pulls” and micro-cap coins that lack the liquidity to respect technical levels like the 200 SMA.
This is a live market scan for “ pullback in uptrend and near 200 SMA support”.
Example: “Buy the Dip” technical analysis strategy for Gnosis (GNO) on the altFINS platform, focusing on a price pullback toward a critical support level.
GNO Strategy Analysis
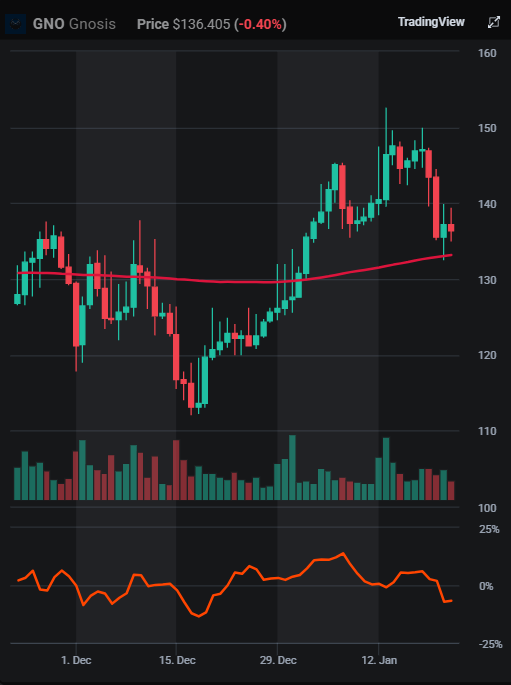
Price and 200 SMA: The candlesticks show price movements, while the smooth red line is the 200-day Simple Moving Average (SMA). Trading above this line generally confirms a long-term uptrend.
The Pullback: In mid-January, GNO experienced a sharp price drop (the “dip”) following a period of growth. The price has returned to sit just above the 200 SMA.
Pullback in Uptrend and Near 200 SMA Support
This “Buy the Dip” strategy focuses on identifying cryptocurrencies that maintain a strong long-term structure but have experienced a temporary short-term correction. By screening for assets in a medium-term uptrend that have dropped at least 5% in the last week, you filter for healthy retracements rather than fundamental trend reversals.
The core of the strategy is the 200-day Simple Moving Average (SMA), a critical institutional support level; assets trading just 100% to 105% above this line are considered to be at a low-risk “institutional floor” where a price bounce is statistically likely.
Screening with these specific criteria on altFINS allows traders to avoid chasing overextended rallies and instead enter positions with a superior risk-to-reward ratio, often placing tight stop-losses just 2–3% below the 200 SMA to protect capital.


0 Comments
Leave a comment