BTC, ETH: Ascending Triangle Breakouts! How to trade this chart pattern?

Ascending Triangle is a bullish pattern with about 70% win rate (see table below for historical pattern win rate stats).
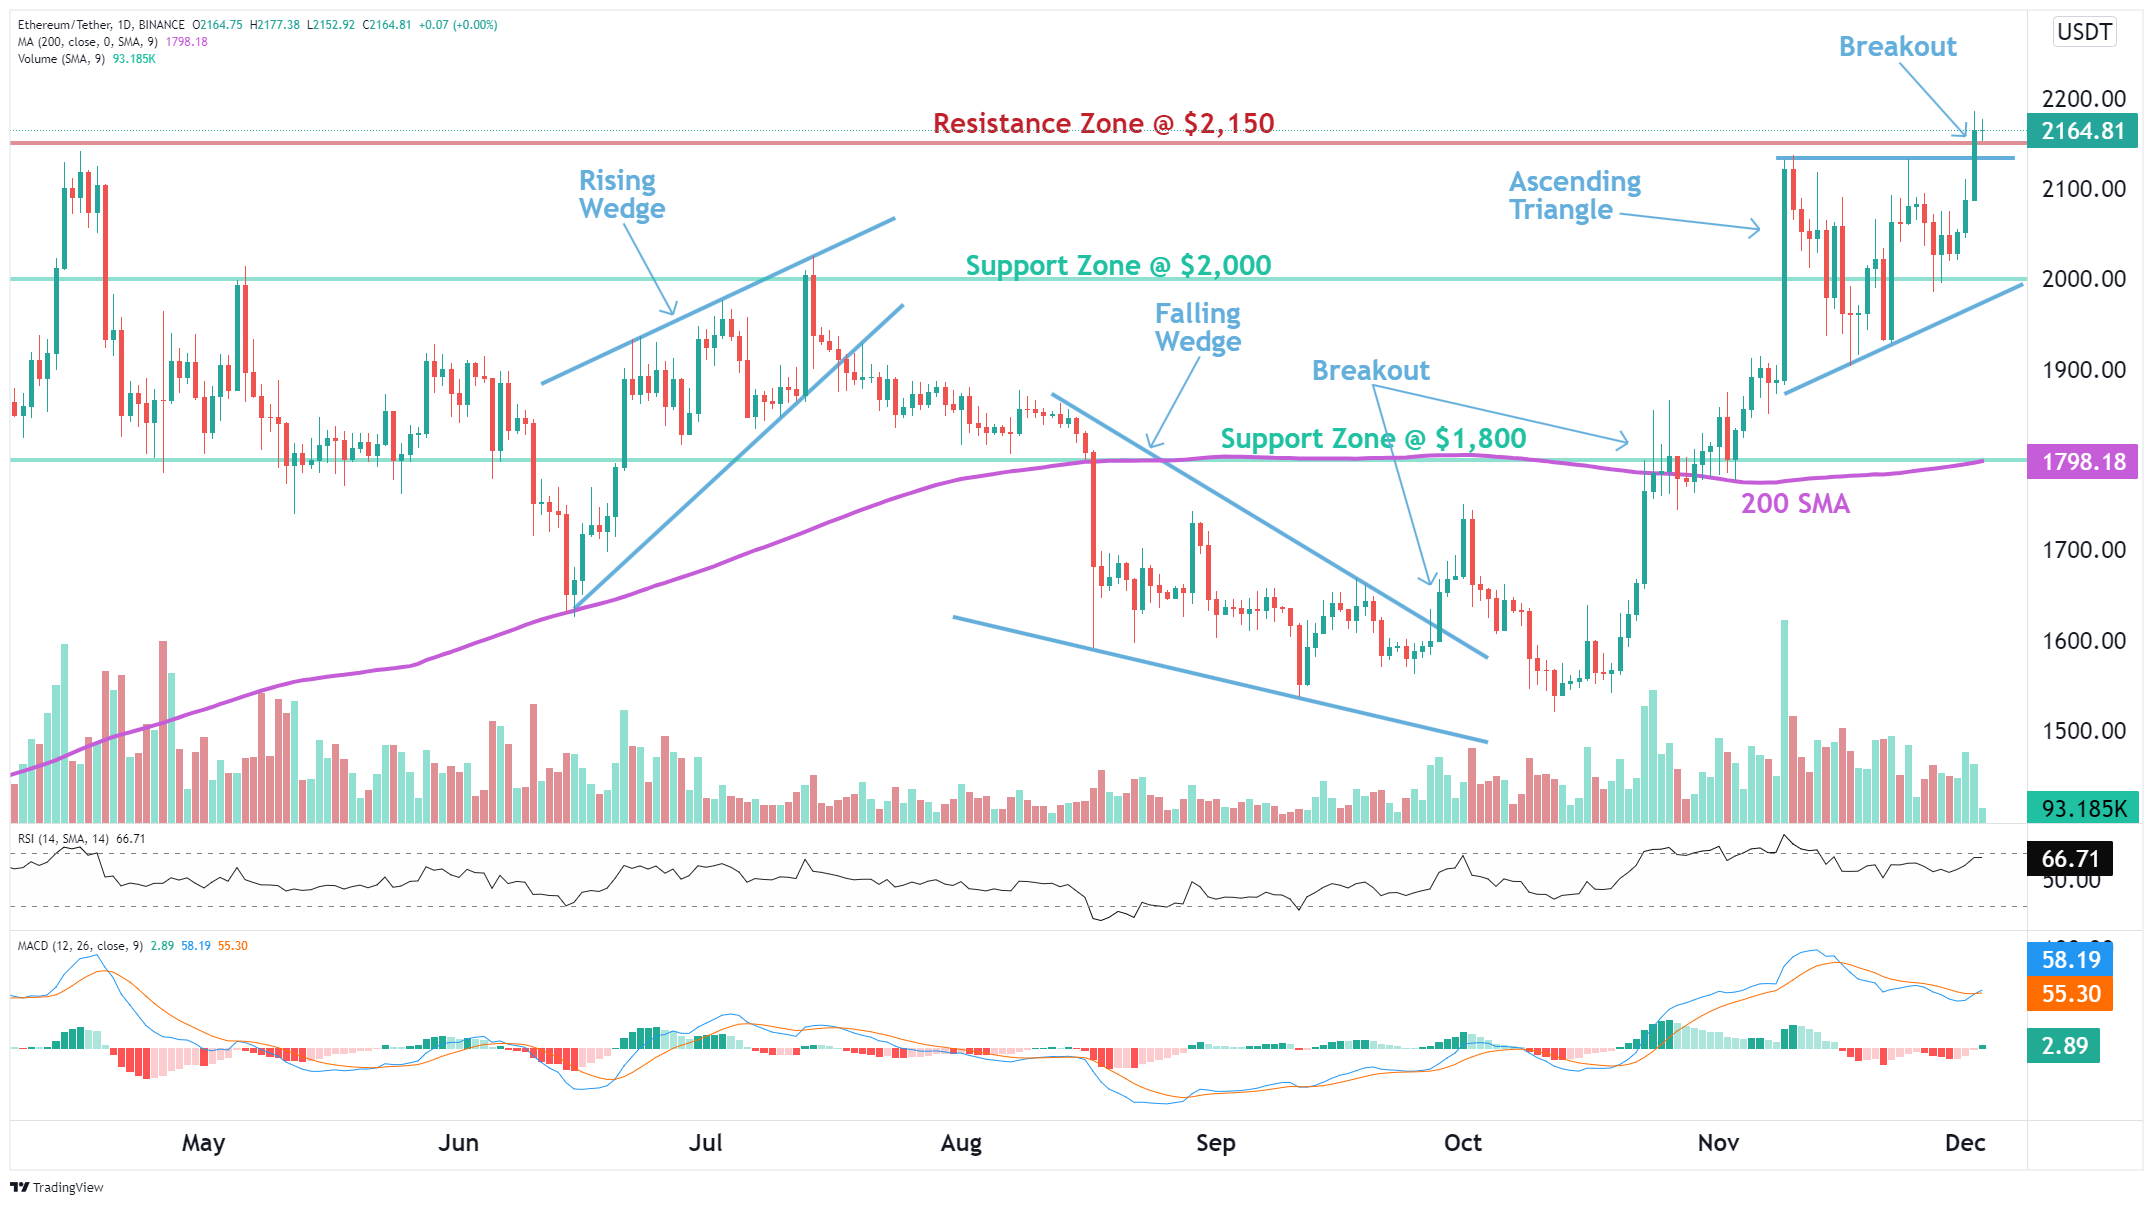
Bitcoin (BTC) and Ethereum (ETH) have both recently broken out of Ascending Triangle patterns.
BTC is up 5% since then and ETH could swing to $2,400 for a 10% gain.
Chart Patterns Historical Win Rates
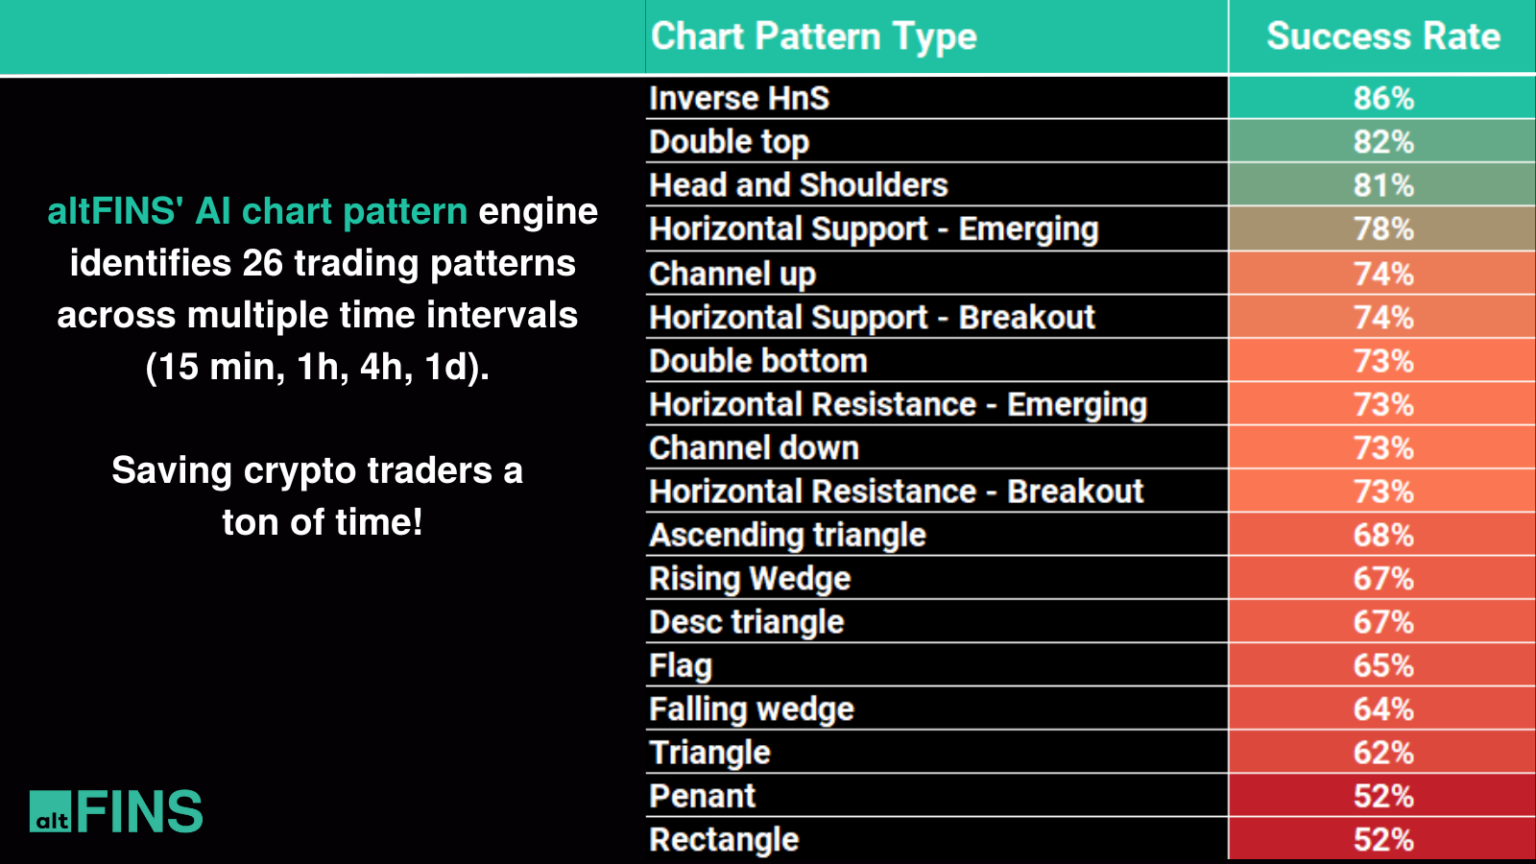
You can find hundreds of such pattern trade setups every week in our Patterns section across four time intervals: 15M, 1H, 4H, and 1D. Only on altFINS!
Also, our Technical Analyses section features trade setups on top 60 altcoins.
These are easy ways to find trading ideas every day even as a beginner trader.
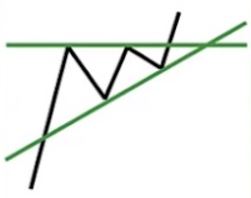
Ascending Triangle Breakout
Ethereum (ETH) Ascending Triangle Breakout!
altFINS platform automatically identifies 16 chart patterns such as Channels, Triangles, and Wedges.
You can find these and others in our Patterns section as well as Signals Summary section.
Don’t ever miss out on these trading opportunities; download our mobile app (iPhone, Android) to find the latest chart patterns.
Here are more resources:
0 Comments
Leave a comment