3 Crypto Trading Strategies That Work in a Bear Market (2026)

The crypto market is deep in bear territory. Bitcoin is down ~47% from its all-time high. The Fear & Greed Index touched 11 in March, a level only seen during the most extreme capitulation events in crypto history. Most trend-following strategies have been stopped out repeatedly.
But certain strategies don’t just survive bear markets, they’re specifically designed for them. We researched which approaches are producing the best risk-adjusted returns in the current conditions, then mapped each one to the exact tools on the altFINS platform — complete with live trade setups firing right now.
| BTC Price ~$72,014 ▼43% from ATH |
Fear & Greed Neautral |
BTC Dominance 59% |
Market Cap $2.53T |
Here are the three strategies worth your attention — and the live opportunities on altFINS to act on today.
Strategy 01
Swing Trade Support & Resistance (Range Trading)
| Best For Sideways Markets |
Time Horizon Days to Weeks |
Risk Level Low–Medium |
When prices are trapped in ranges, and right now, most coins are, the winning move is buying near support and selling near resistance. This is the #1 recommended strategy across multiple 2026 research reports for the current consolidation phase. While trend followers get chopped up, range traders profit from the repetition.
Why It Works Right Now
Most coins are range-bound. BTC oscillates in the $66K–$75K range. Altcoins are forming sideways channels with predictable bounces at support and rejections at resistance. No strong directional trend means range traders profit while everyone else gets stopped out.
altFINS Tools for This Strategy
Approaching Support Signal Sideways Channel Pattern Curated Analyst Trade Setups
🔍 Live Opportunity: XRP — Sideways Channel ($1.30 – $1.50)
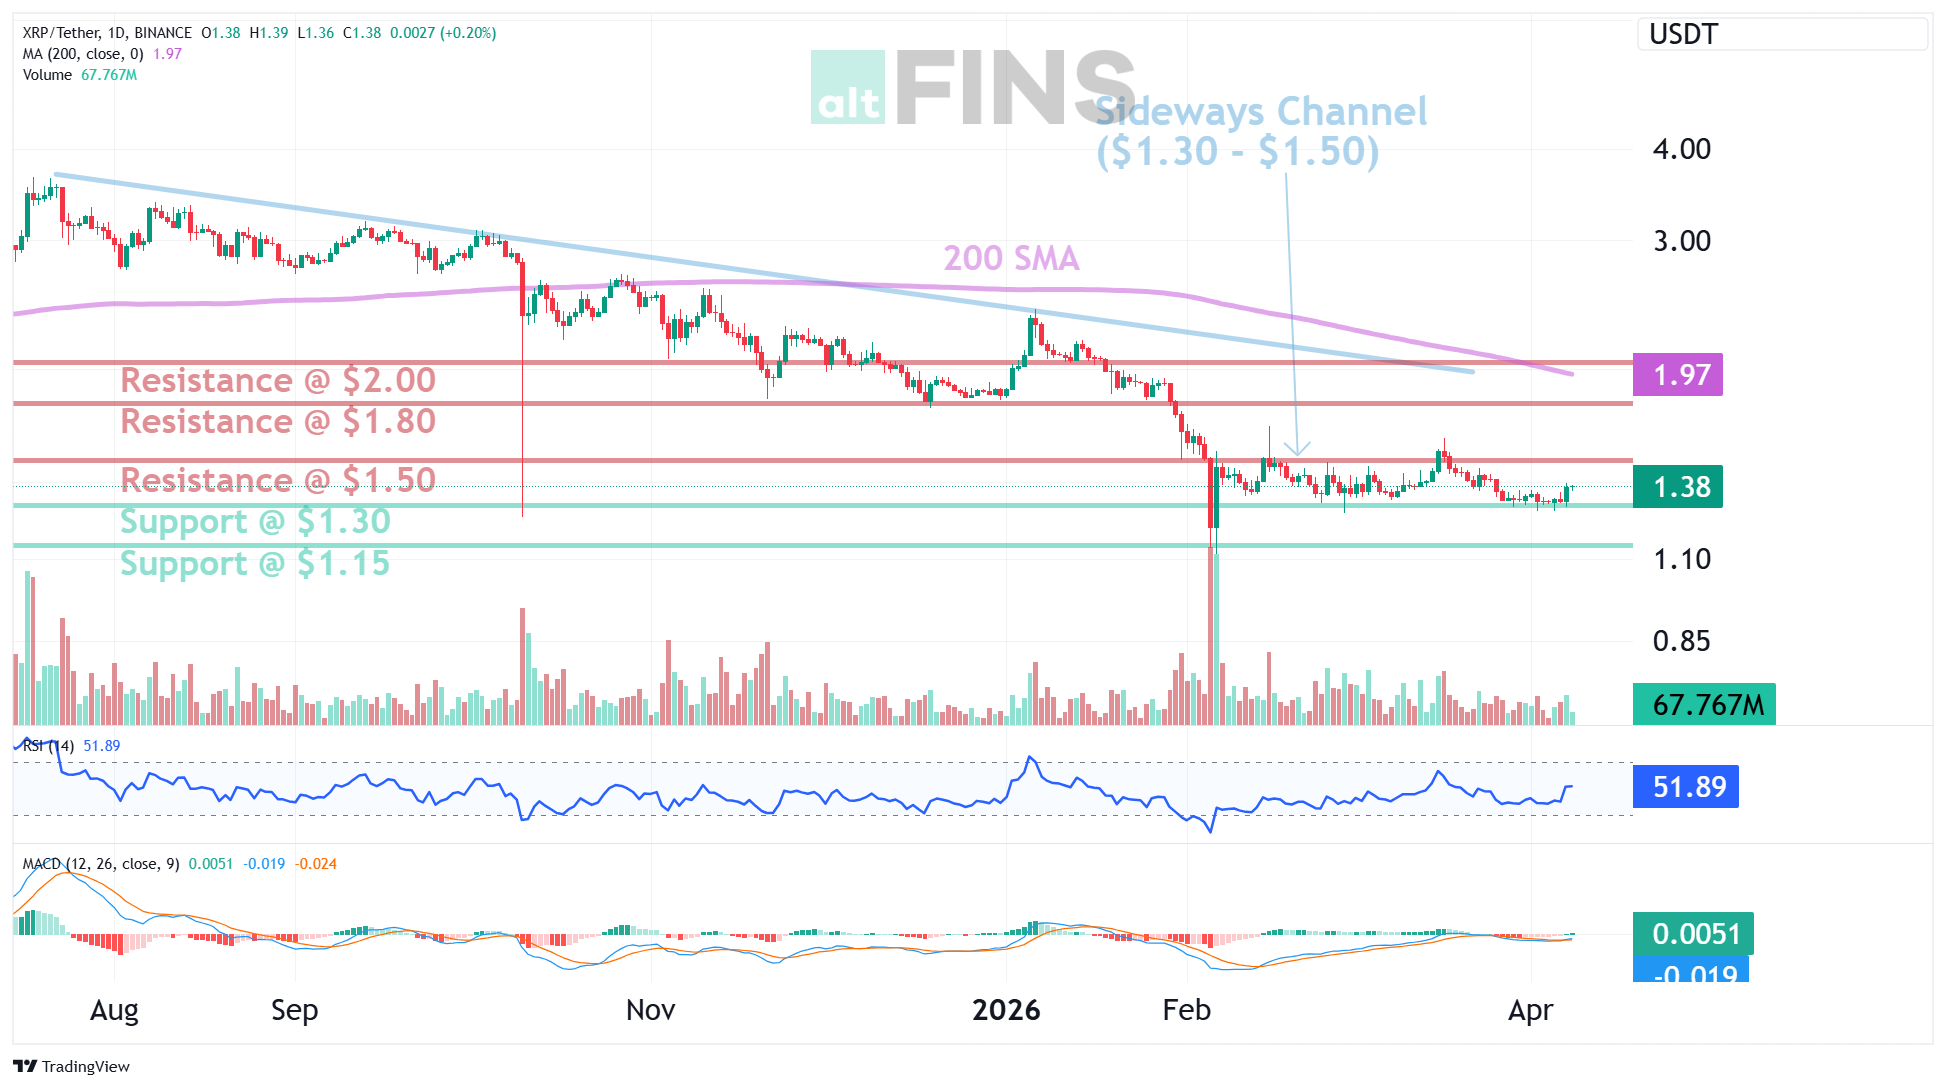
Trade setup: XRP is consolidating in a Sideways Channel between $1.30 and $1.50. If it breaks above $1.50 resistance, it could continue its recovery and revisit $1.80 next (+20%). If it breaks below $1.30 support, it could resume its Downtrend to $1.15. Swing traders can trade the range — buy near $1.30 support, sell near $1.50 resistance.
| Trend | Short-term Down, Medium-term Strong Down |
| Momentum | Bullish (MACD crossed above Signal Line) |
| Support | $1.30, then $1.15 |
| Resistance | $1.50, then $1.80 |
→ Find more Sideways Channel setups on altFINS
🔍 Live Opportunity: HBAR — Approaching support ($0.105 Resistance)
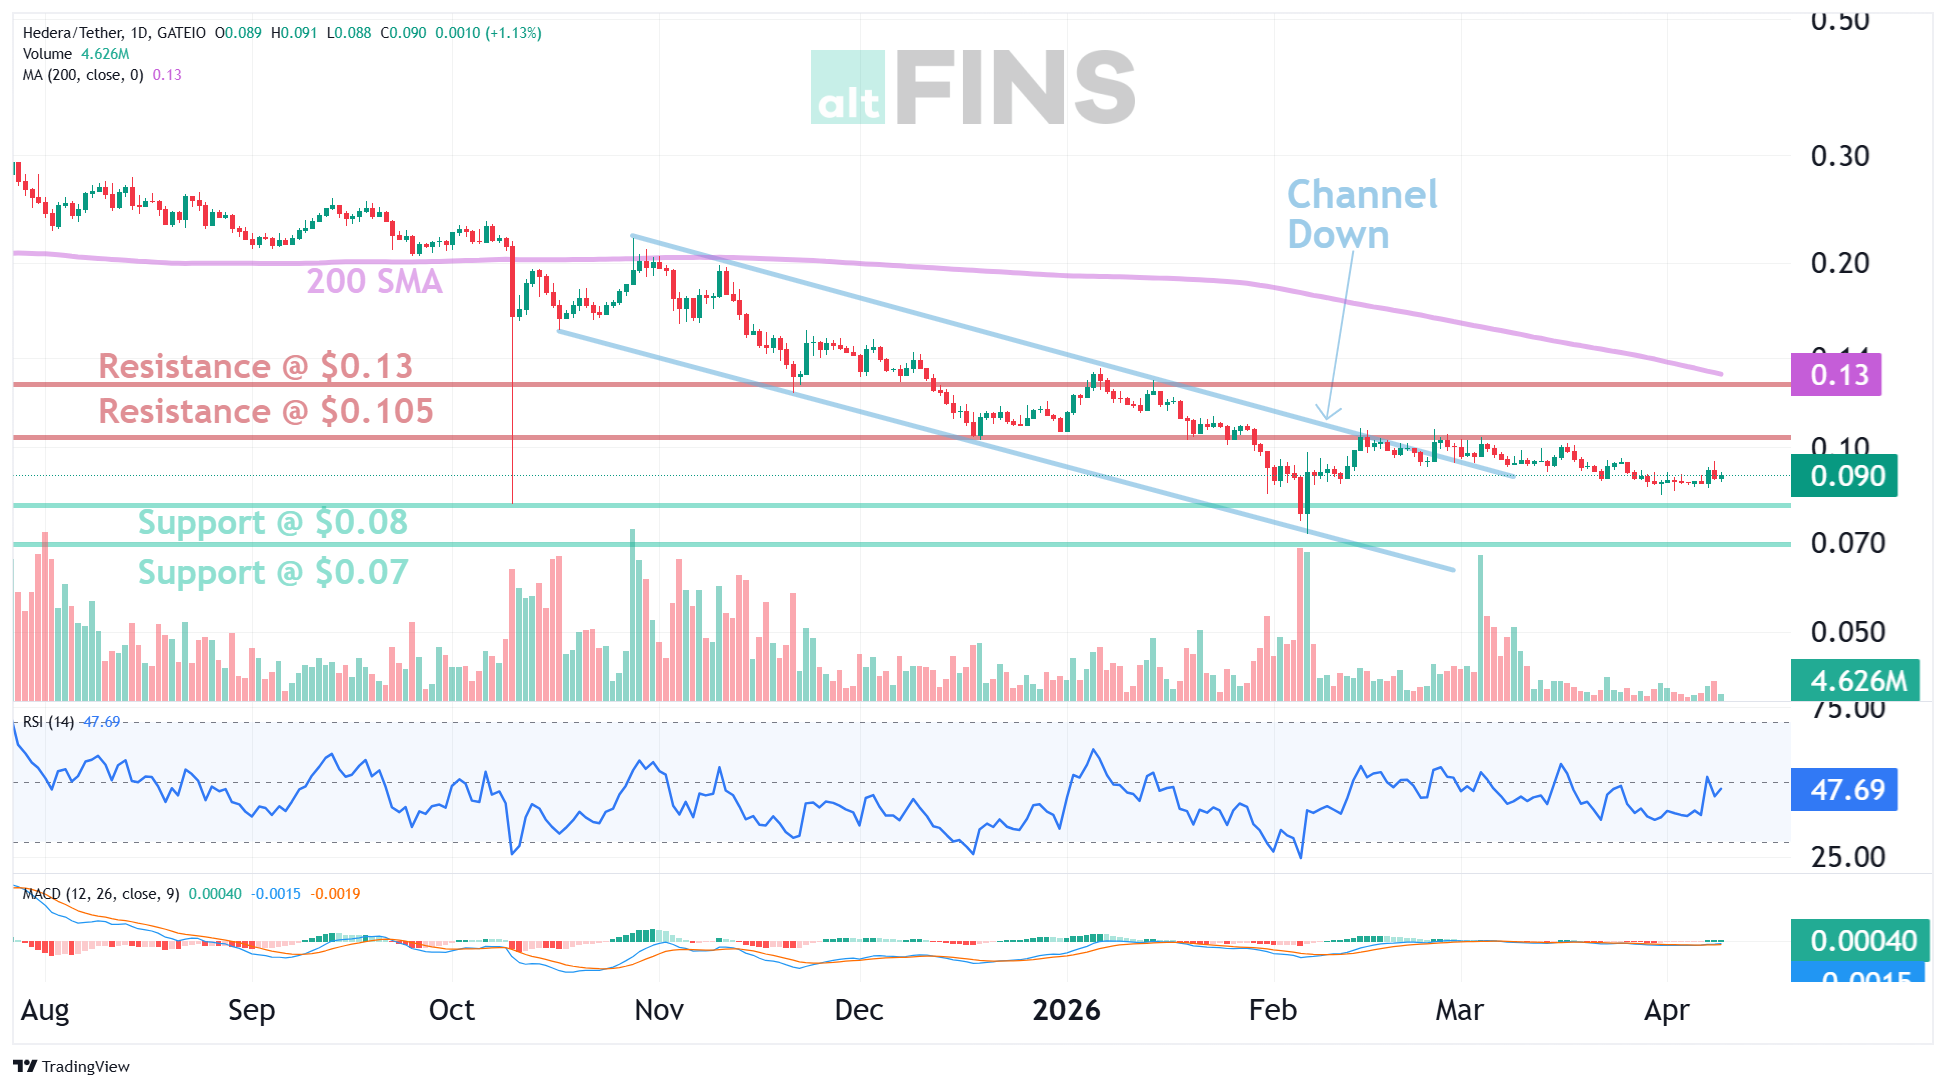
Trade setup: HBAR had a bullish breakout from a Channel Down pattern. We wait for confirmation: break above $0.105 resistance. If so, that could signal a bullish trend reversal with +20% upside potential to $0.13 resistance. Stop Loss at $0.092. This is a riskier setup because it’s a trend reversal, not continuation — it’s against the overall downtrend.
| Trend | Short-term Strong Down, Medium-term Strong Down |
| Support | $0.08, then $0.07 |
| Resistance | $0.105, then $0.13 |
| Upside Target | +20% to $0.13 |
Strategy 02
Chart Pattern Breakout Trading
| Best For Catching Trend Shifts |
Profit Potential +7% to +16% |
Risk Level Medium–High |
Bear markets create extended consolidation patterns, long triangles, falling wedges, descending channels. These patterns compress energy like a spring. When they break, moves are fast and decisive because sellers are exhausted. The altFINS chart pattern scanner detects these across thousands of coins automatically.
Why It Works Right Now
Bear markets create compressed patterns that eventually must resolve. The breakouts that survive in a bear market tend to be real, not the fake-outs common during euphoria. altFINS’s pattern scanner monitors5 00+ coins across multiple timeframes to find these automatically.
altFINS Tools for This Strategy
Chart Pattern Scanner (Daily) Pattern Breakout Signal Feed Breakout in Uptrend Filter
🔍 Live Opportunity: FET — Resistance Breakout Above $0.23 (Bullish Outlook)
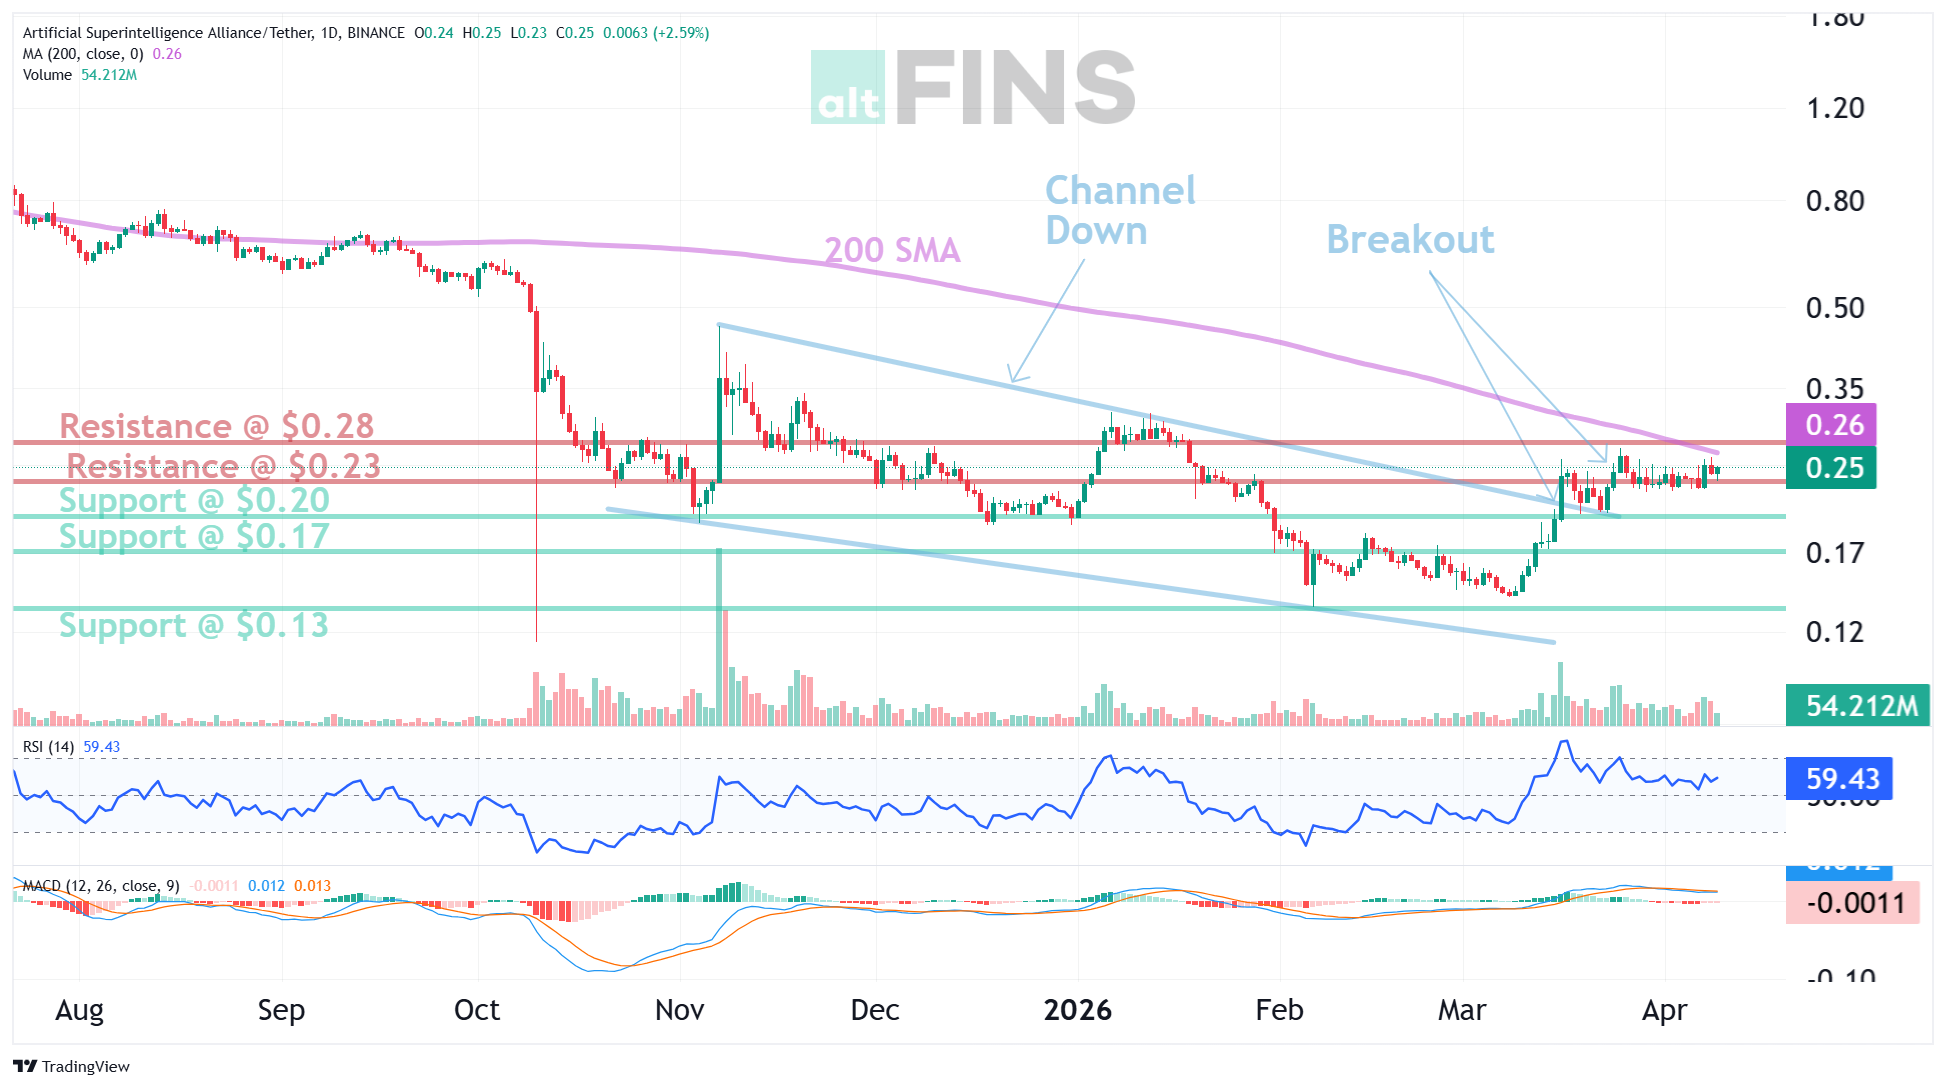
Trade setup: Trends are reversing to Uptrend. FET has broken out of the Channel Down and broke above $0.23 resistance. Price could revisit $0.28–$0.30 next. Short-term trend is Strong Up, medium-term trend is Up. MACD Histogram bars are rising, suggesting momentum could be nearing an upswing.
| Trend | Short-term Strong Up, Medium-term Up ✅ |
| Outlook | Bullish |
| Support | $0.20, then $0.17 |
| Resistance / Target | $0.28 – $0.30 |
🔍 Live Opportunity: ETH — Resistance Breakout Above $2,100
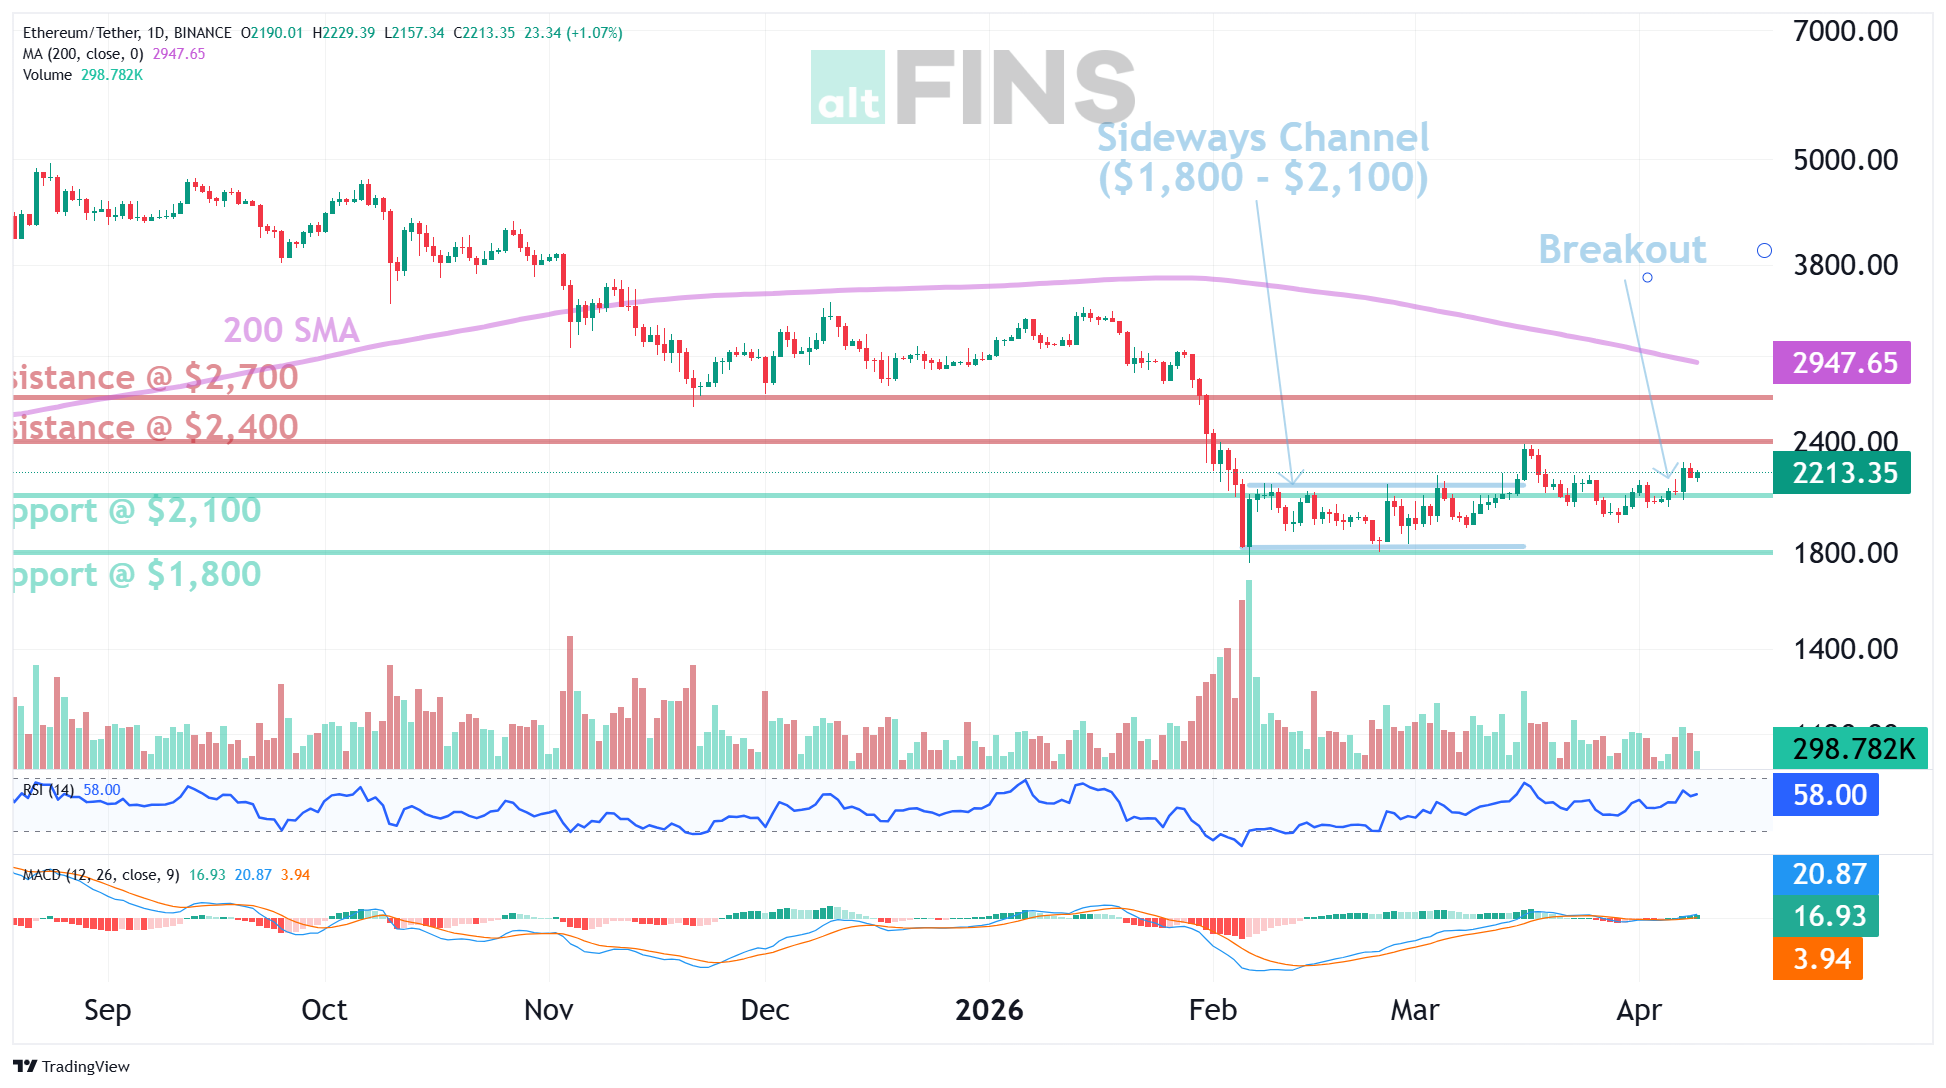
Trade setup: Price continues to trade sideways, which is an improvement from prior Downtrend. Near-term, price has broken above $2,100 support and could revisit $2,400 next. Short-term trend is Up. This is a significant signal for the second-largest cryptocurrency by market cap.
| Trend | Short-term Up, Medium-term Neutral |
| Support | $2,100, then $1,800 |
| Resistance / Target | $2,400, then $2,700 |
→ Find more Chart Pattern Breakouts on altFINS
More Breakouts Detected This Week
| Coin | Pattern | Profit Potential |
| BAL (Balancer) | Triangle Breakout | +16.0% |
| SOSO (SoSoValue) | Triangle Breakout | +9.1% |
| HSK (HashKey) | Triangle Breakout | +7.4% |
| ATH (Aethir) | Channel Up Breakout | +8.0% |
→ Find more AI Chart Patterns on altFINS
Strategy 03
Oversold Bounce & RSI Divergence
| Best For Contrarian Trades |
Key Indicator RSI Below 25 |
Risk Level Medium |
This is the contrarian play. When the Fear & Greed Index fear and coins drop to RSI below 25 (very oversold), statistics show these produce sharp 10–30% relief rallies even within a broader bear trend. The altFINS platform flags these in real time through the signal feed.
Why It Works Right Now
The market is drowning in fear. The Fear & Greed Index hit 21 in March. When RSI drops below 25, coins are at statistically extreme levels, historically producing sharp relief rallies. For higher-conviction setups, look for RSI divergence (price makes new low, RSI makes higher low) which signals selling momentum is fading.
altFINS Tools for This Strategy
Very Oversold (RSI < 25) Signal RSI Divergence Scanner Approaching Support Overlay
🔍 Live Opportunity: HYPE — Rising wedge Buy Zone $33–$35 (Bullish Outlook)
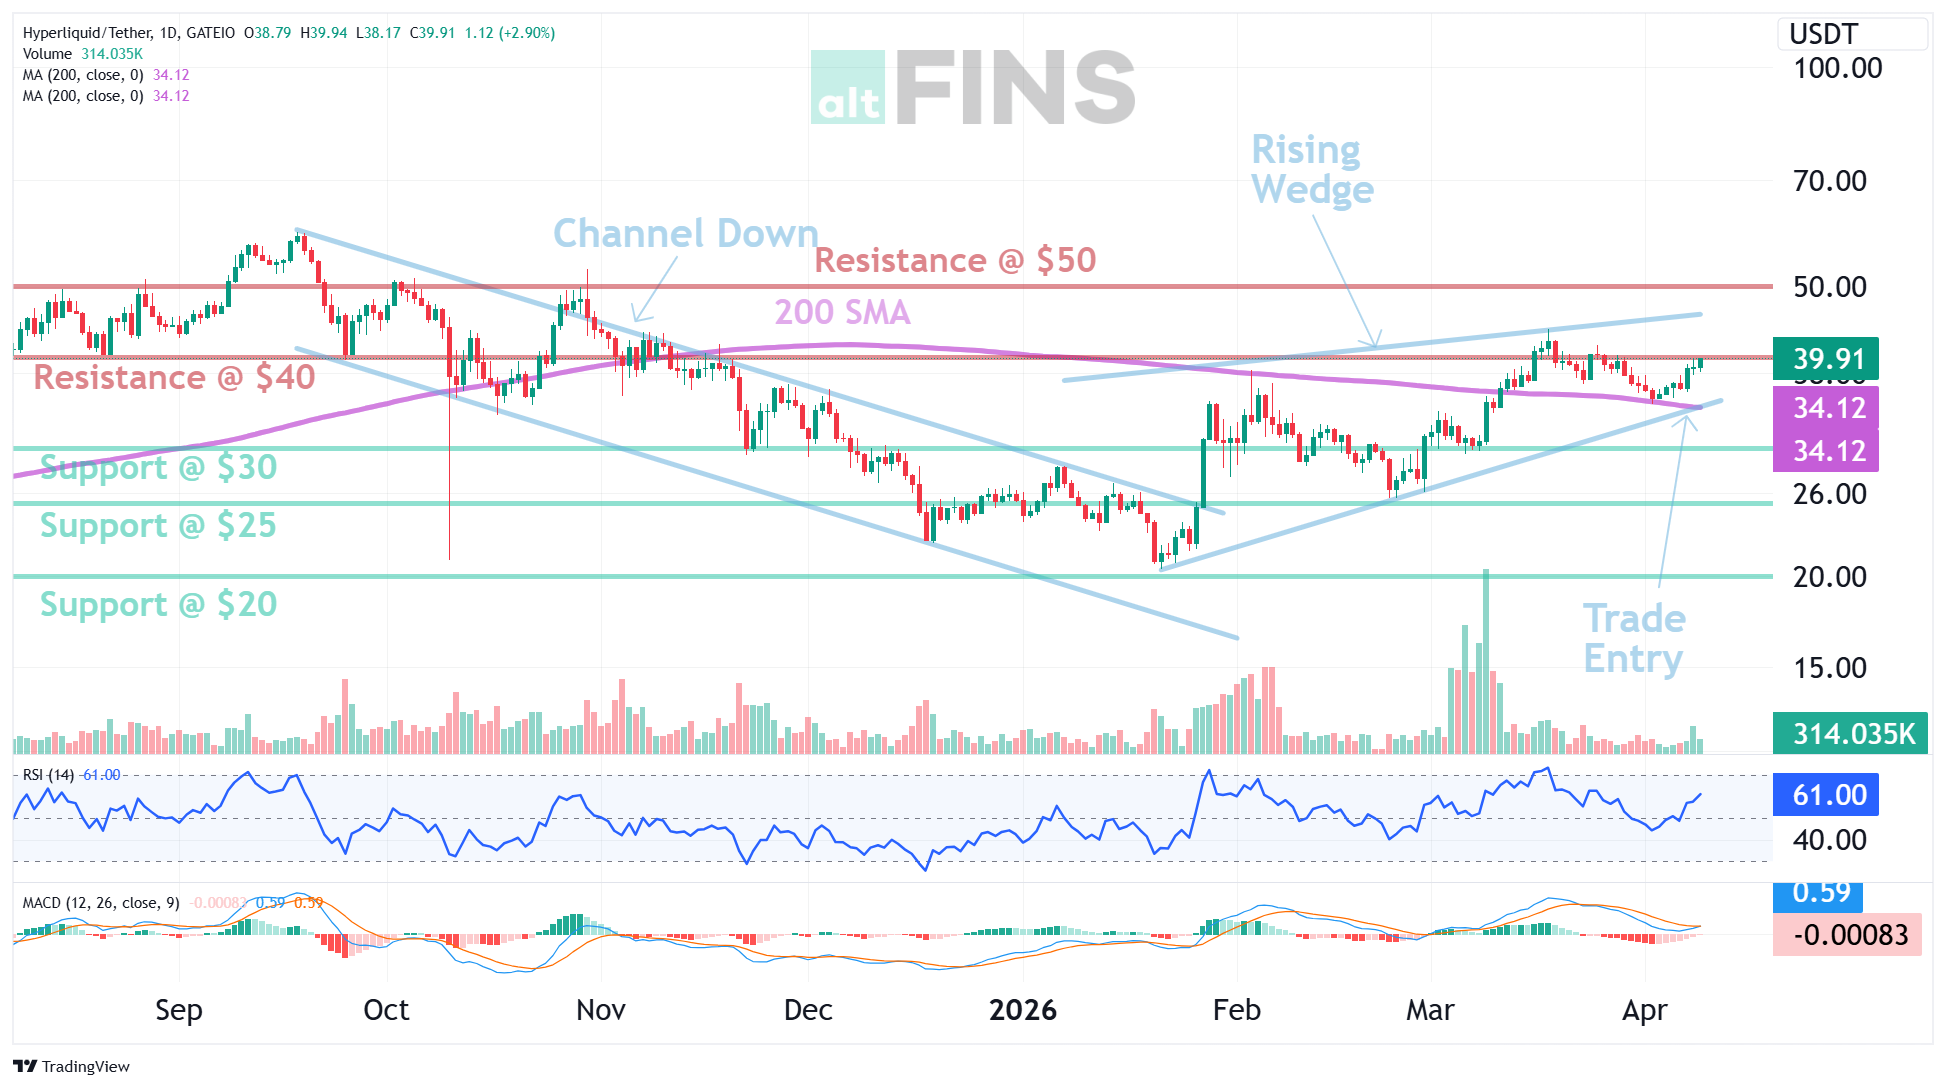
Trade setup: HYPE broke above the 200 SMA, signaling resumption of Uptrend. It’s trading in a Rising Wedge pattern. We’d be buyers in the $33–$35 zone — near the wedge trendline and 200 SMA support. Upside potential to $40 (PT1) or $50 (PT2). Stop Loss at $28. Excitement is building around their launch of prediction markets and increased volumes on Gold, Silver and other RWAs. This is one of the highest revenue-producing blockchain projects.
| Trend | Short-term Strong Up, Medium-term Up ✅ |
| Outlook | Bullish |
| Buy Zone | $33 – $35 |
| Targets | $40 (PT1), $50 (PT2) |
| Stop Loss | $28 |
🔍 Live Opportunity: ICP — RSI Momentum + MACD Crossover (Bull/Bear Scenario)
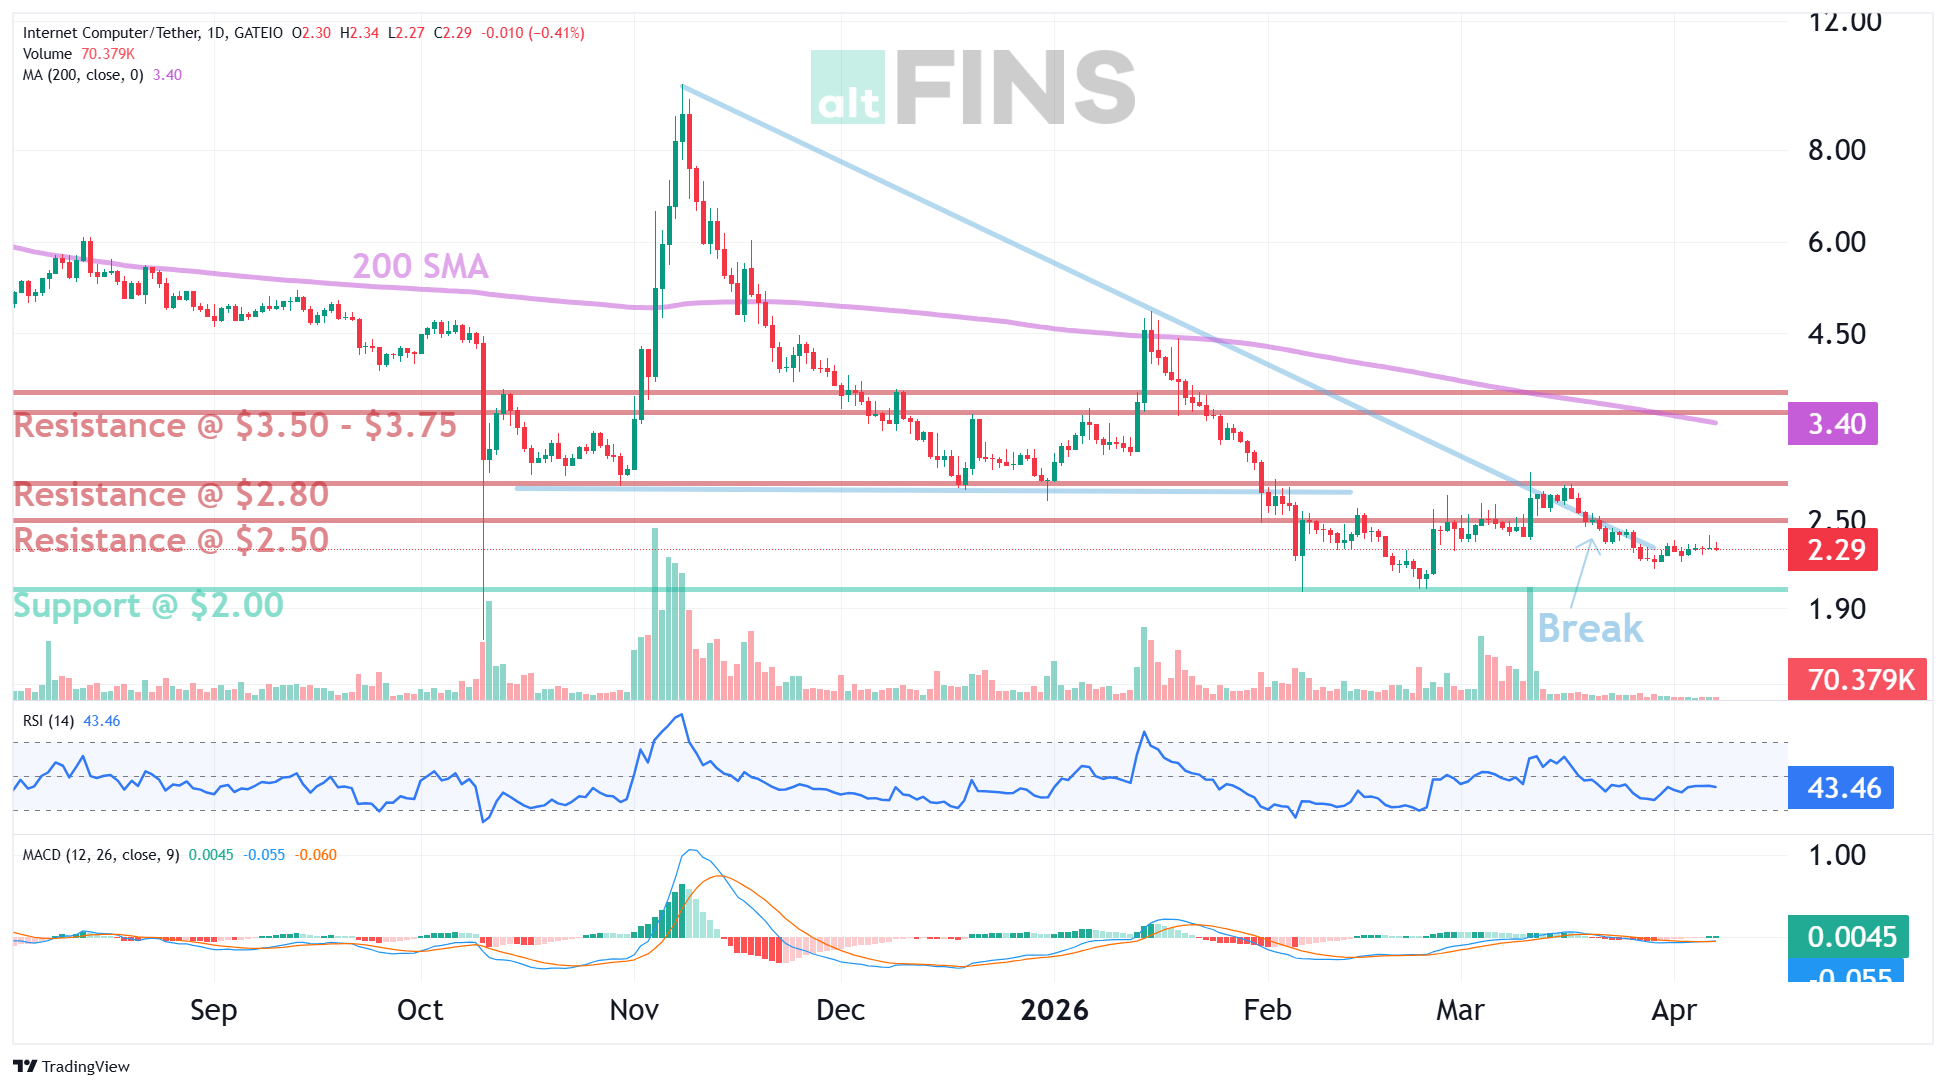
Trade setup: 🐂 Bull case — RSI momentum + MACD crossover initiating, price holding $2.50. If it reclaims $2.80 on volume, next target is $3.50–$3.75 (200 SMA confluence). That’s a ~40% move. 🐻 Bear case — $2.50 fails, price slides to $2.00. Below $2.00 gets ugly with no obvious floor until ~$1.50.
| Trend | Short-term Neutral, Medium-term Strong Down |
| Support | $2.00 |
| Resistance | $2.80, then $3.50 |
| Bull Target | ~40% to $3.50–$3.75 |
→ Find more Oversold Bounce setups on altFINS
Very Oversold Signals Firing Today (RSI < 25)
| Coin | Market Cap | Price Change |
| WAN (Wanchain) | $12.1M | ▼ 15.7% |
| DRIFT | $17.8M | ▼ 8.4% |
| AMP | $76.0M | ▼ 0.2% |
| KLV (Klever) | $9.5M | ▼ 2.7% |
Putting It All Together
These three strategies are specifically suited to the market we’re in right now, a bear phase defined by range-bound consolidation, extreme fear, and occasional sharp breakouts:
✅ Range trade sideways channels (XRP, HBAR) for steady, repeatable gains at defined support/resistance levels.
✅ Catch chart pattern breakouts (FET, ETH, BAL) from extended consolidation — moves in bear markets tend to be decisive.
✅ Buy deeply oversold bounces (HYPE pullback, ICP at support) when RSI drops below 25 at key levels.
What makes altFINS uniquely valuable here is automation. The platform scans over 2,000 coins across multiple timeframes, detecting these signals in real time. The curated analyst setups add professional context with exact entry levels, stop-losses, and targets.
Bear markets don’t last forever. Long-term holders now control roughly 80% of Bitcoin supply, approaching the 85% level historically seen at bottoms. When recovery comes, traders who stayed active with disciplined strategies will be best positioned.
Trade setups shown are based on altFINS platform data as of April 9, 2026. altFINS experts update 50+ charts every day.
Upgrade and get access to trade setups!
Start scanning for these signals today
altFINS signal feed, chart pattern scanner, and curated trade setups, everything you need for bear market strategies.
Disclaimer: This article is for informational purposes only and does not constitute financial advice. Cryptocurrency trading carries significant risk. Always do your own research and never invest more than you can afford to lose. Past performance does not guarantee future results.
0 Comments
Leave a comment