Bitcoin Still in Accumulation Phase of This Cycle; More Upside Ahead
It’s important for traders using technical analysis to identify big picture trends.
In crypto, the big picture is dictated by Bitcoin and that’s why we keep track of alternative data indicators used to analyze Bitcoin usage, adoption and valuation cycles. See our prior analyses here and here.
Yan Liberman, Co-Founder of Delphi Digital joined CoinDesk to build on previous analysis using UTXO (unspent transaction output) data to evaluate Bitcoin (BTC) cycles.
We summarize his presentation in the following charts. The conclusion is that the structure of the market seems very similar to early 2016, with accumulation being the main agenda of hodlers. This suggests that we are heading into exciting times, as the accumulation phase accelerates into a strong bull market. And this conclusion for Bitcoin also bodes well for altcoins.
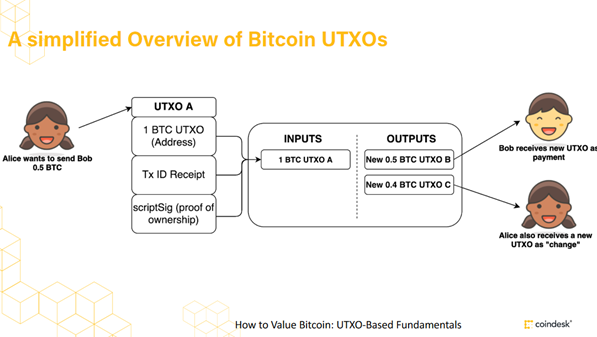
Bitcoins exist independently, not recorded in a particular account that belongs to an individual, but rather that individual’s access to them is controlled by private key. Private key enables the bitcoin to be sent into a transaction. When you send bitcoin, your entire balance (UTXO) gets sent out and the residual (change) is sent back. Each transaction creates new UTXO.
1. UTXO Hodl Waves
Since each output transaction has a timestamp, we can aggregate outputs for entire supply and slice it into age groups. This way we can track the distribution of the supply and see when was the last time a particular Bitcoin moved.
In following chart, green line represents Bitcoin which did not move for at least 1 year. This indicator bottomed in 2018 and it’s been steadily increasing since. It is now around the same level (~63%) as in 2016, which marked the beginning of an uptrend and a wild bull market in 2017.
We can also see that the proportion of Bitcoin that is held for 3-5 years is still below the previous peak in 2017. This suggests that the best may be yet ahead of us and we are still in accumulation phase.
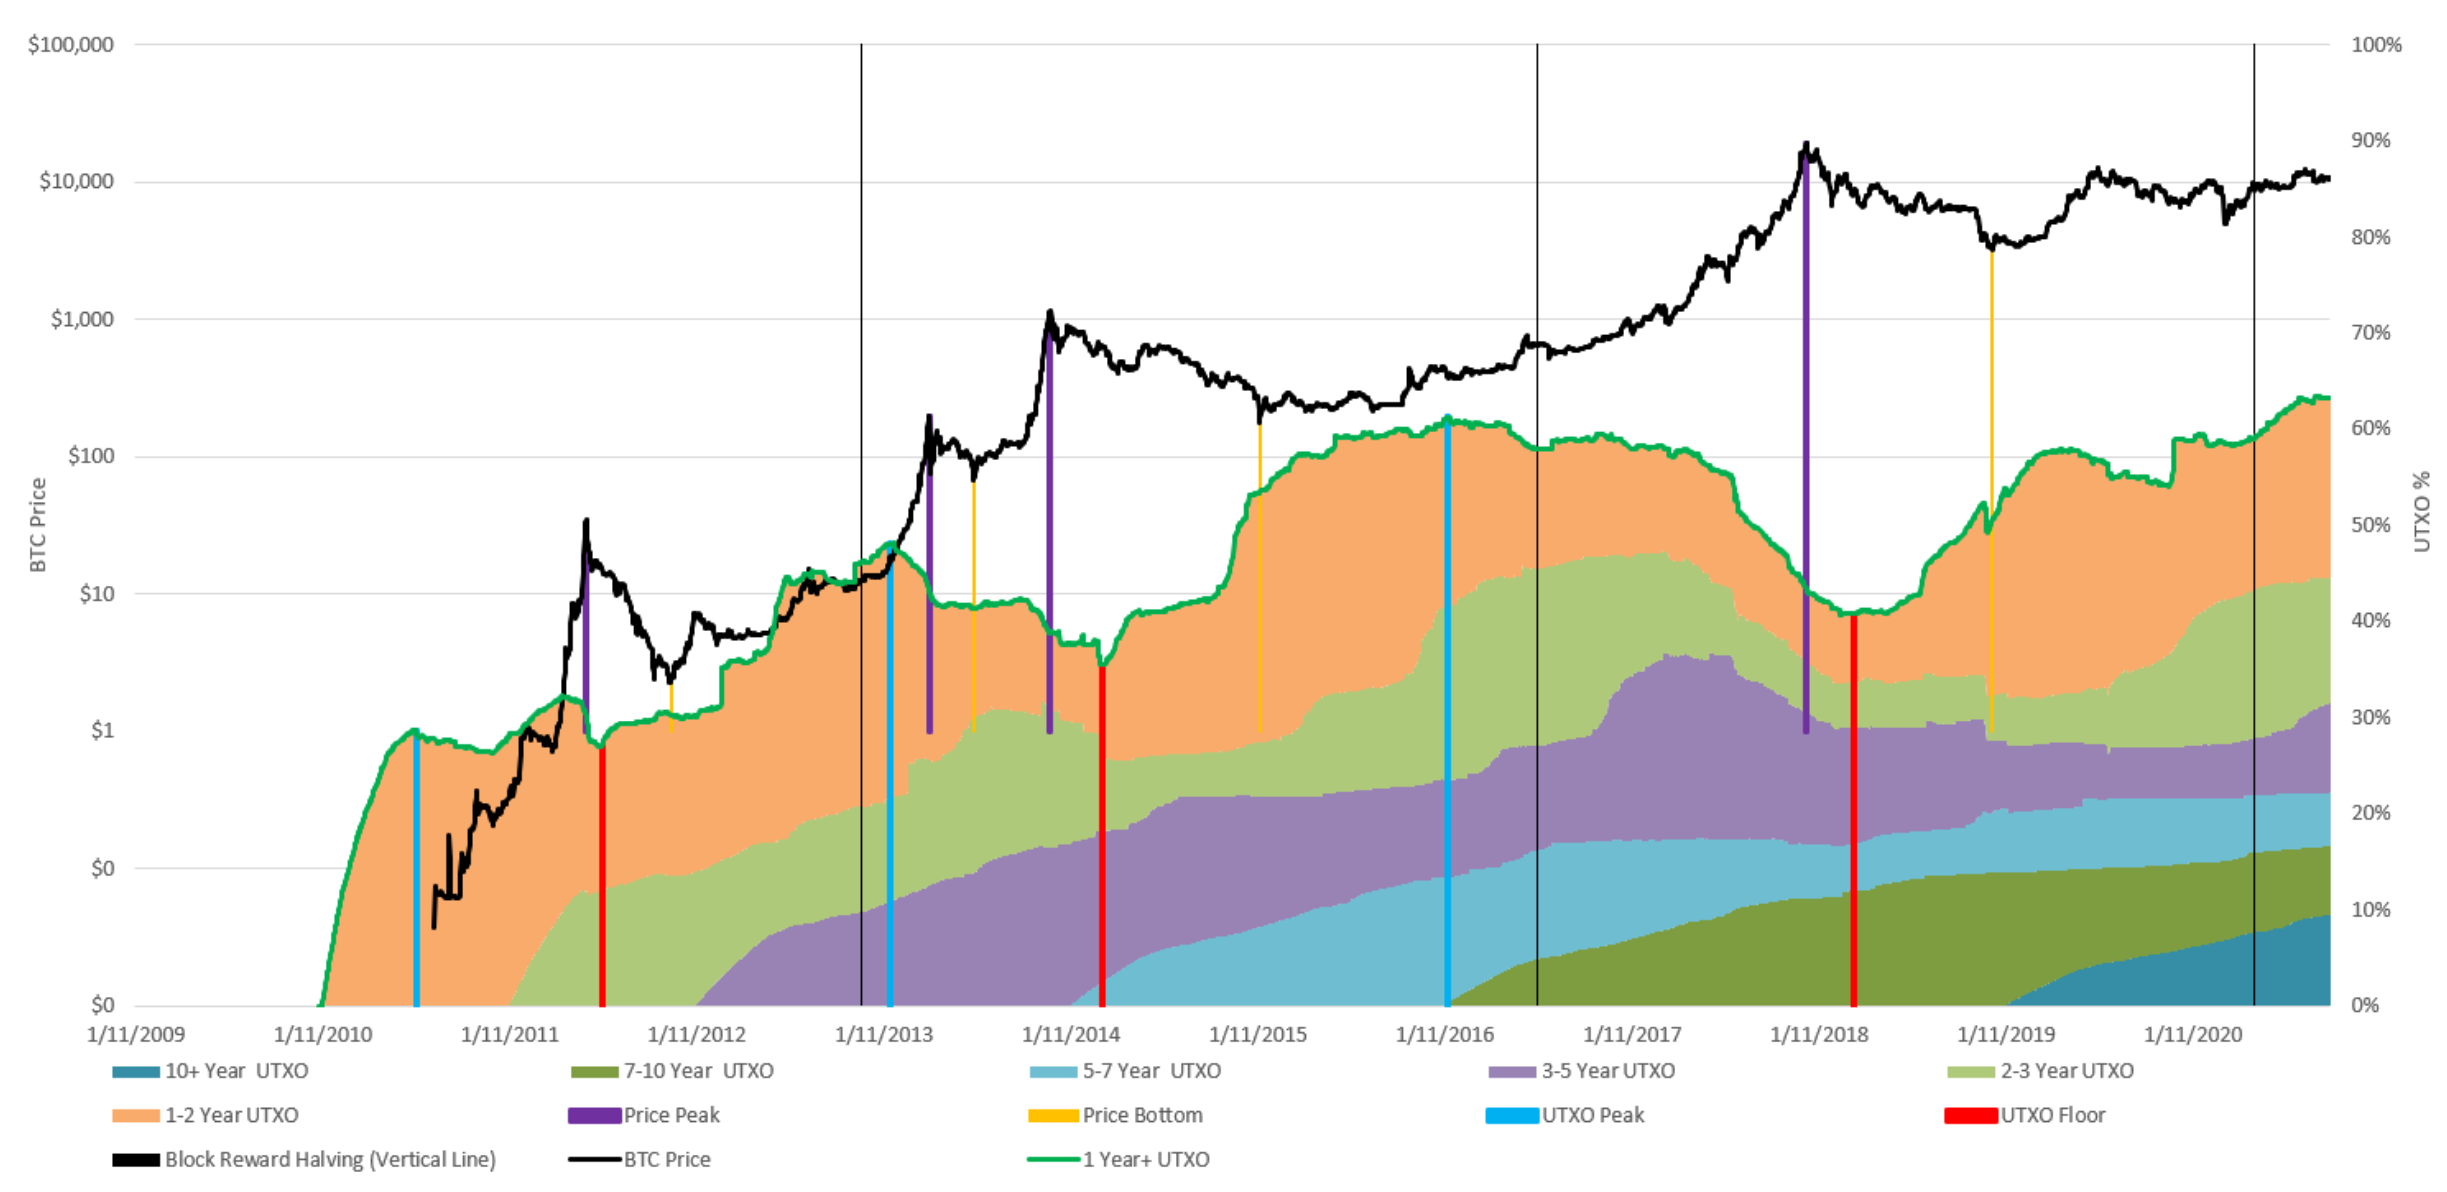
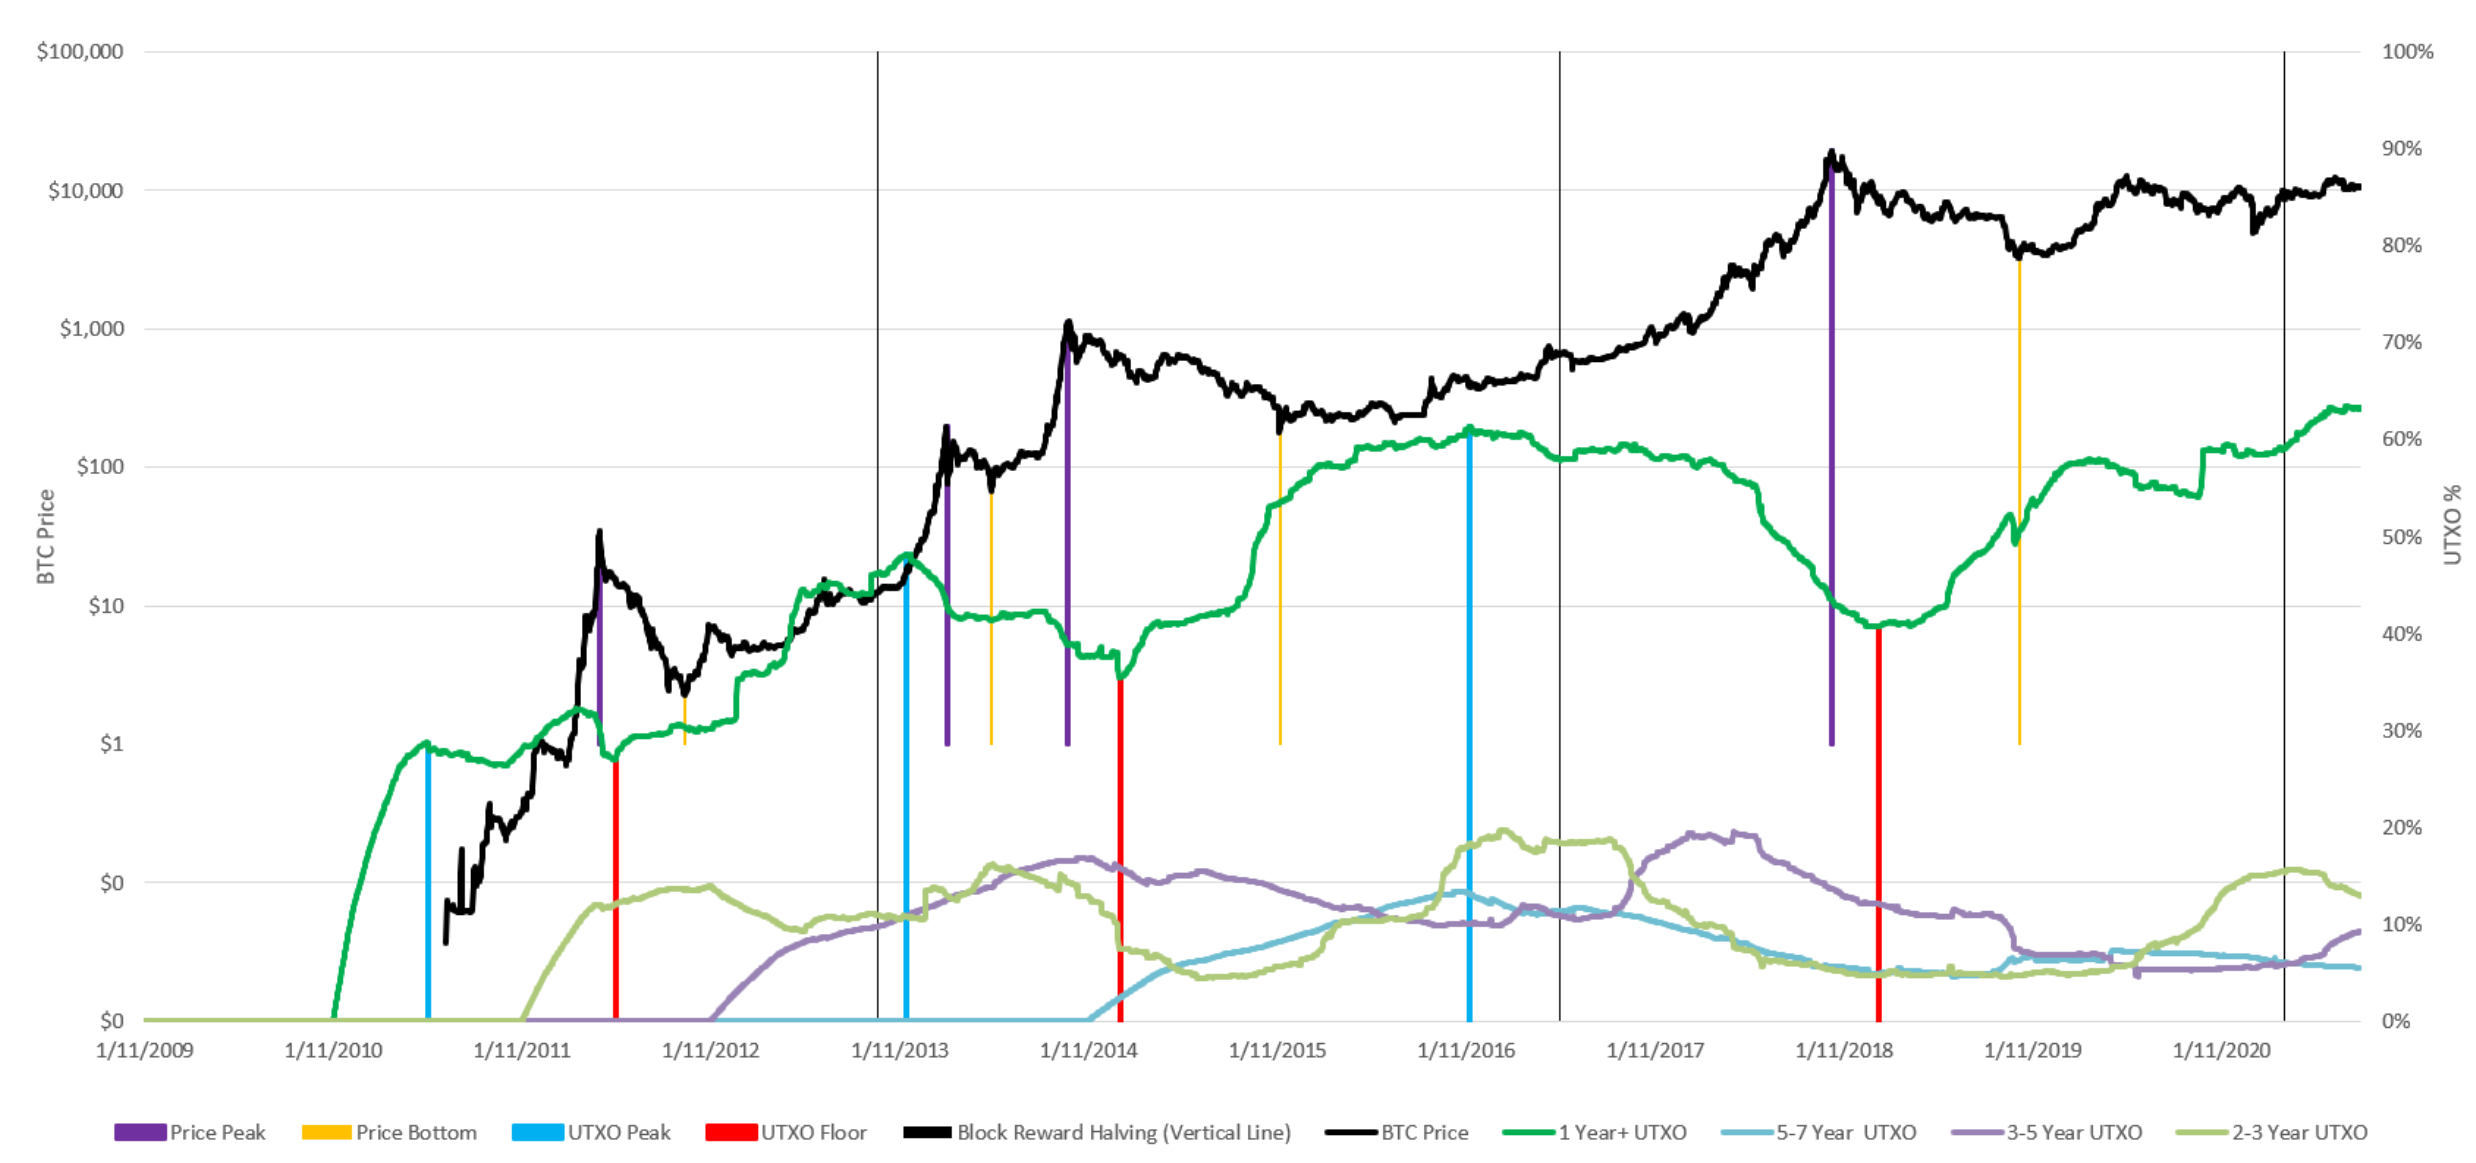
2. Hodl Age Bands
When analyzing Bitcoin age bands, one has to understand how Bitcoins move in these age bands. Either coins move to higher age band or back to the beginning. Tracking the change in age bands indicates what kind of hodlers are selling and how much supply they have left to sell. When we look at the data now, they all point to strong accumulation:
- 63.2% supply unmoved in at least 1Y (ATH)
- 44.5% of supply unmoved in at least 2Y (high since June 2017)
- 31.5% of supply unmoved in at least 3Y (high since Nov 2017)
- 22.2% of supply unmoved in at least 5Y (ATH)
Judging based on hodl bands, we’re structurally similar to where we were in the first half 2016.
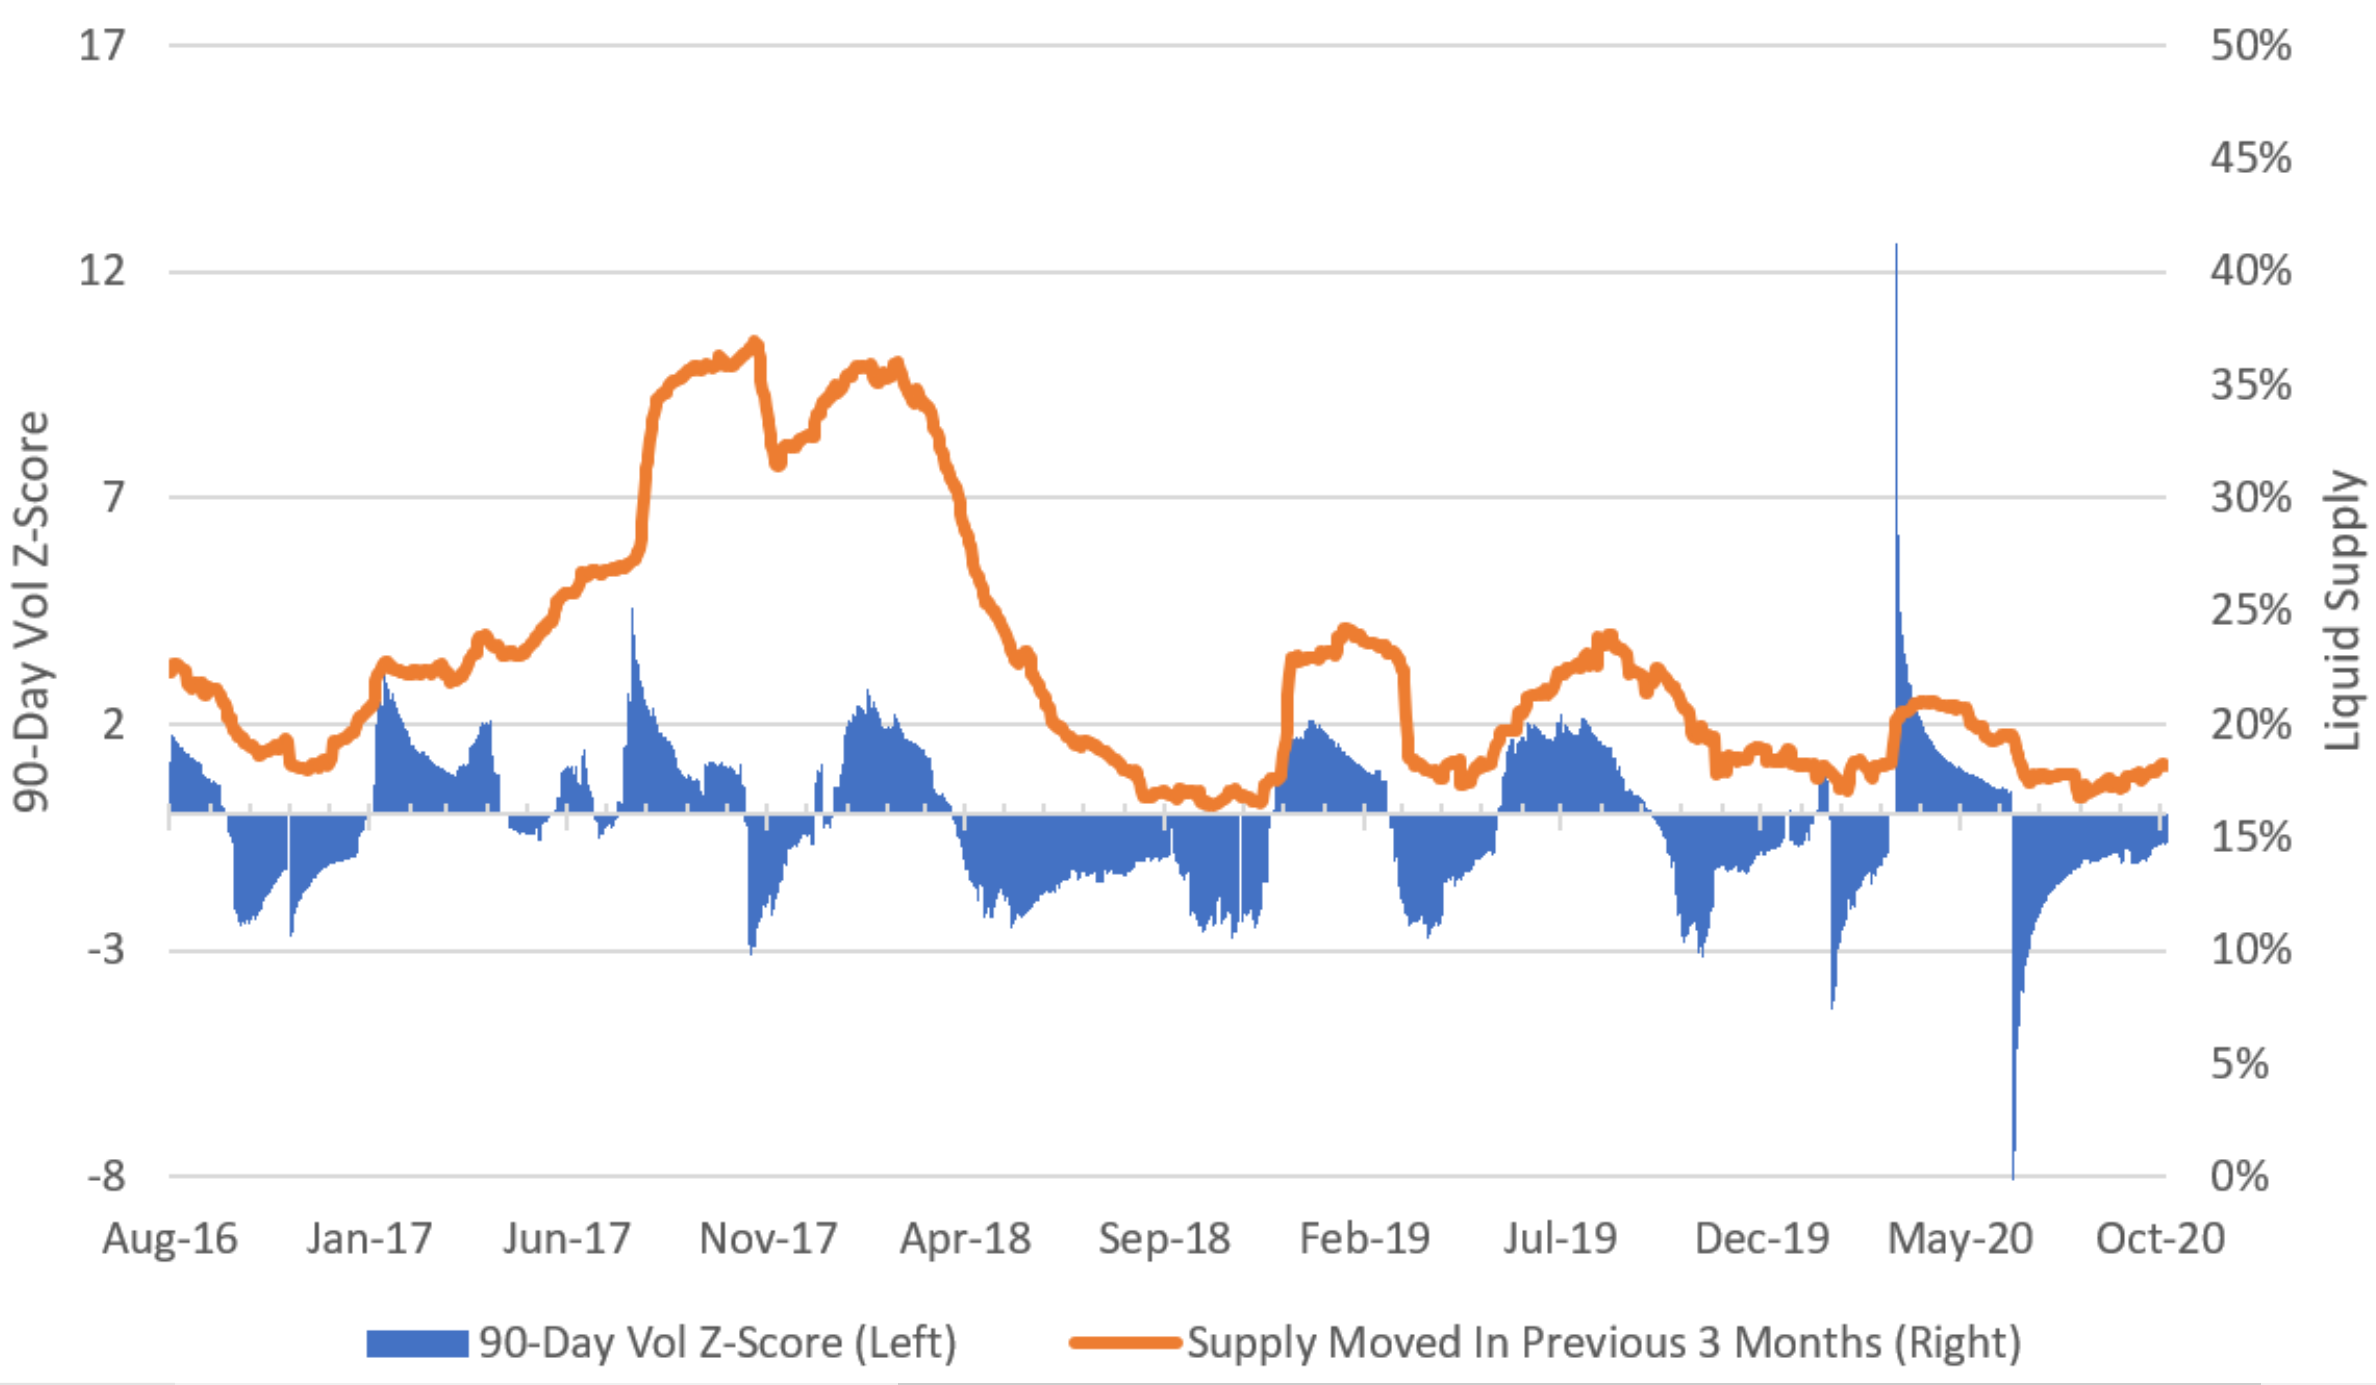
3. Liquid Supply
An interesting way to analyze shift in hodlers is to look at Bitcoin’s liquid supply (supply moved in previous 3 months) and compare it to trailing price volatility.
Typically, increases in Bitcoin price volatility (blue area in chart) drive spikes in liquid supply (orange line) as investors sell their Bitcoins to take profits.
However, since 2017, periods of price increase have driven smaller and smaller spikes in liquid supply. Hodlers are accumulating and Bitcoins is in stronger and stronger hands. Even the huge shock in March 2020 due to COVID19 pandemic did not make that many coins move.
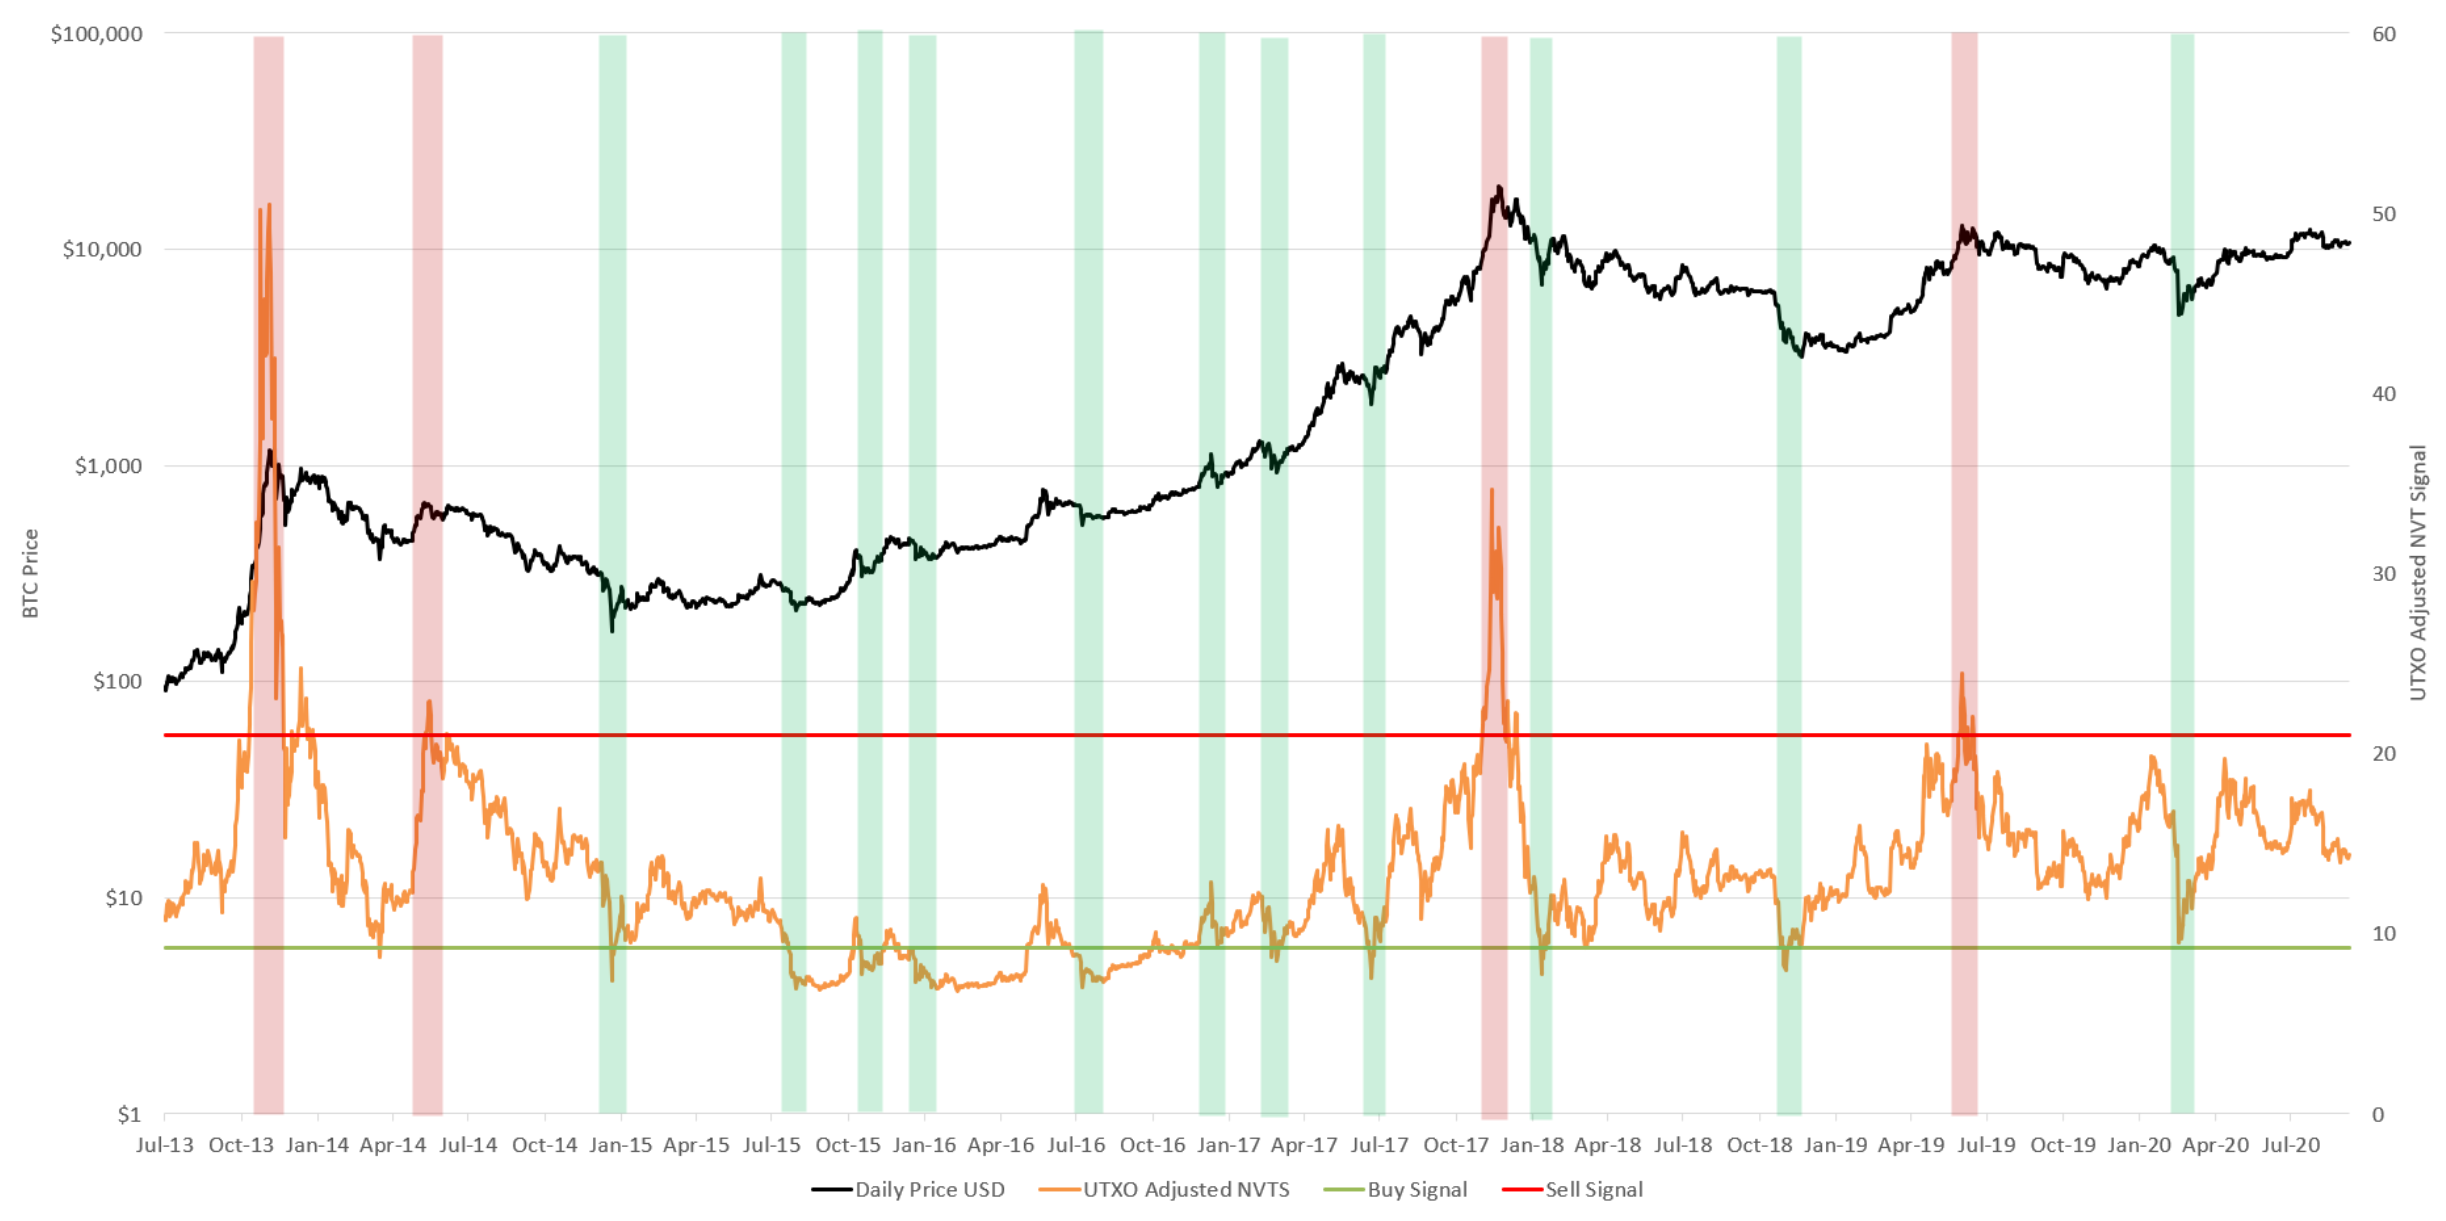
4. UTXO adjusted NVTS (aka Price / Earnings ratio)
The following chart shows UTXO adjusted NVTS (orange line – Network Value to Transaction Ratio Signal), which is similar in theory to price to earnings ratio in stocks. NVT is calculated simply as Market cap / On-chain Volume. Indicator is currently at 14, or in the middle of its historical range, which suggests that Bitcoin is not over-valued.
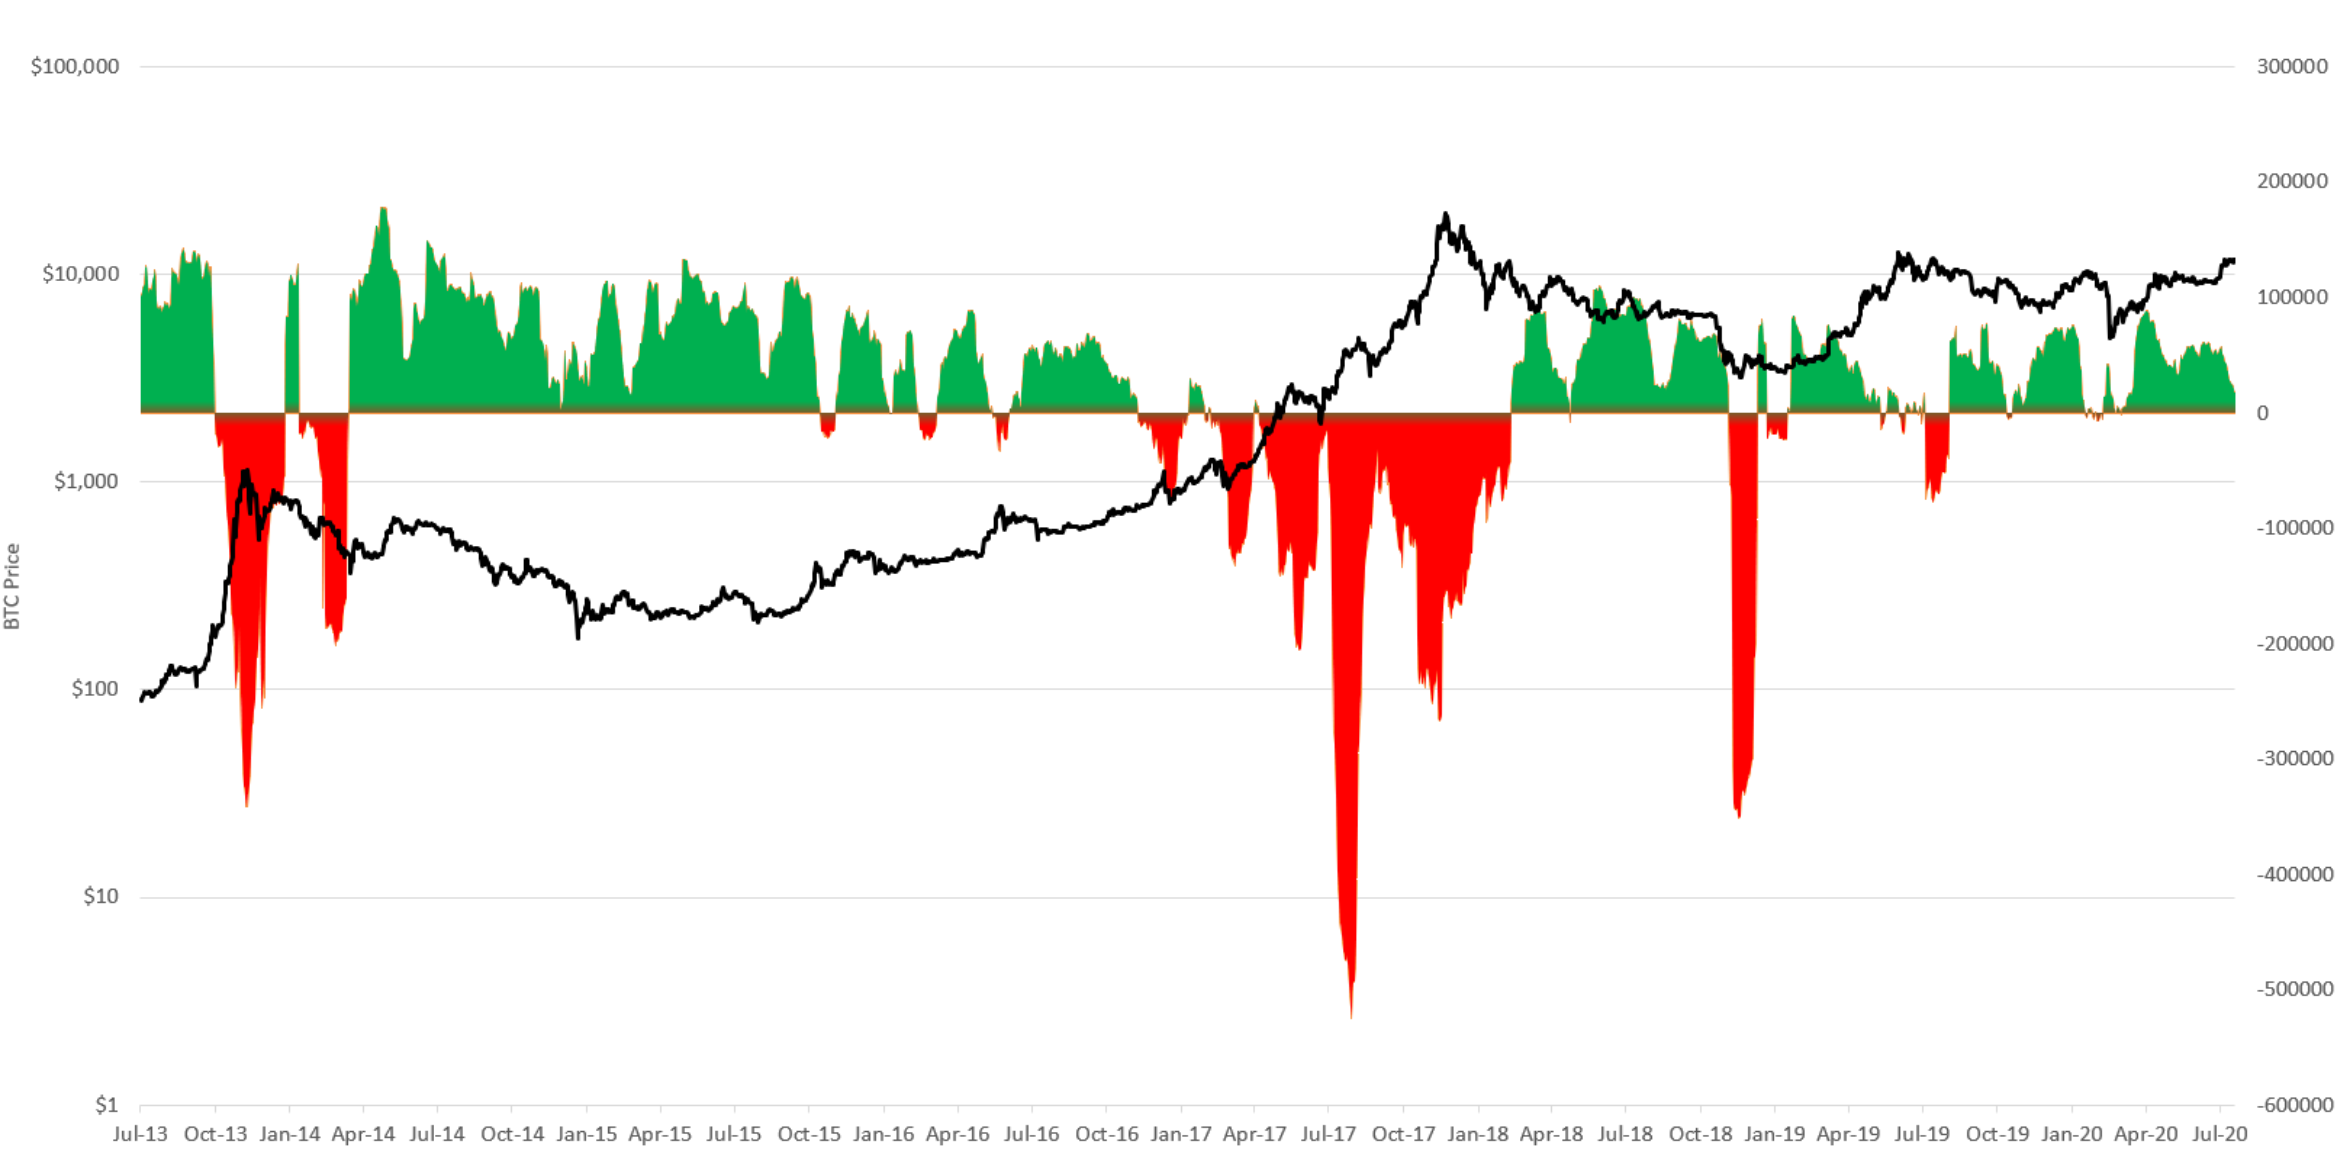
5. Hodler Net Position
The last chart shows Hodler Net position change. It shows “liveliness” of the Bitcoin network, which is the ratio of the sum of Bitcoin’s days destroyed to sum of Bitcoin’s days created.
Bitcoin’s days destroyed is an alternative way to measure the economic activity on Bitcoin network because total transaction volume per day may not be appropriate due to the possibility of parties repeatedly sending each other the same coin. Bitcoin’s days destroyed gives more weight to coins that haven’t been spent in a while. Basically you multiply the amount of each transaction by the number of days those coins are being dormant.
Bitcoin’s days created is the opposite of Bitcoin’s days destroyed.
This indicator shows that longer-term hodlers usually cash out as Bull market commences, as they are sitting on huge unrealized gains, but during bearish and neutral markets we see accumulation. According to this indicator we are currently in accumulation phase.