Bitcoin (BTC) breakout boosts altcoins
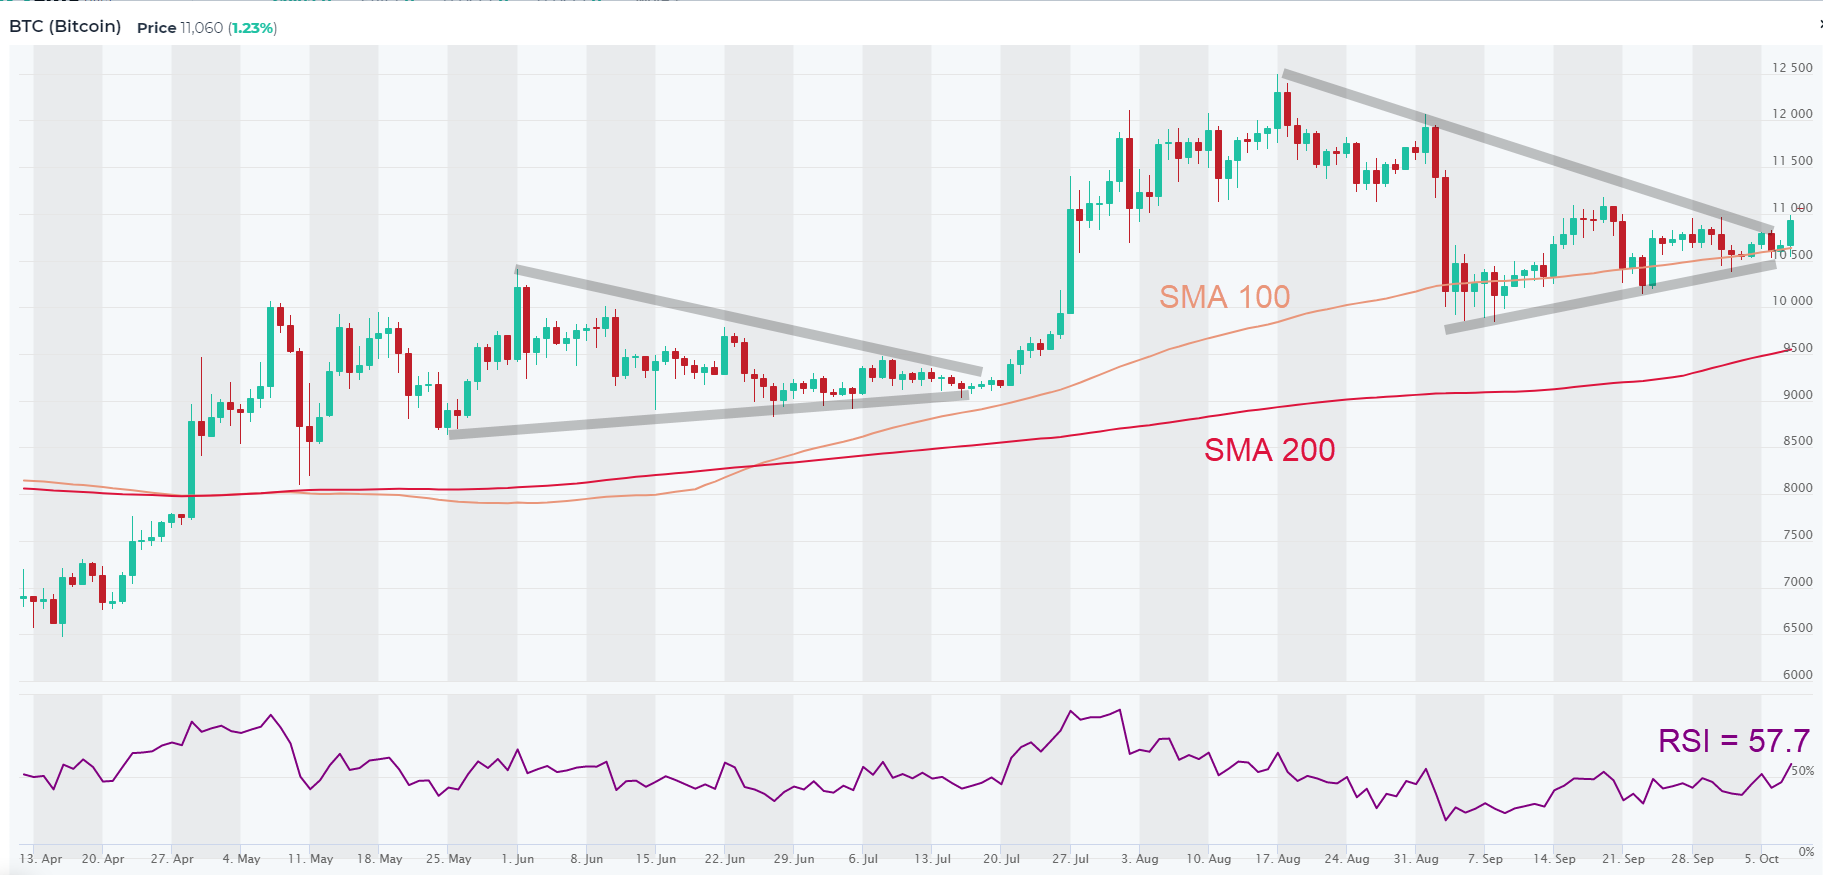
Trading at around $11,100, Bitcoin is attempting to break out of its $10K-11K range and out of a symetrical triangle (see chart below and recent post).
Today we’re highlighting additional key on-chain metrics that bode well for Bitcoin’s price. And when Bitcoin rises, altcoins rise with it, and at higher speeds.
This is a follow up to our previous piece on Bitcoin fundamentals from Oct 4.
This week, Philip Gradwell, chief economist at Chainalysis joined with CoinDesk to talk about number of Bitcoin addresses and the clues they can provide.
1. Addresses are the most foundational data, but are often misunderstood.
Bitcoin addresses are similar to bank accounts, but with the difference that you can have as many Bitcoin addresses as you like. There are ~714 million addresses generated to date, but that’s not the same as ~714 million people holding Bitcoin, since many people and entities have multiple addresses.
In the chart below, we can see monthly growth rate of Bitcoin addresses. We can see that New entities count is much smaller than new addresses.
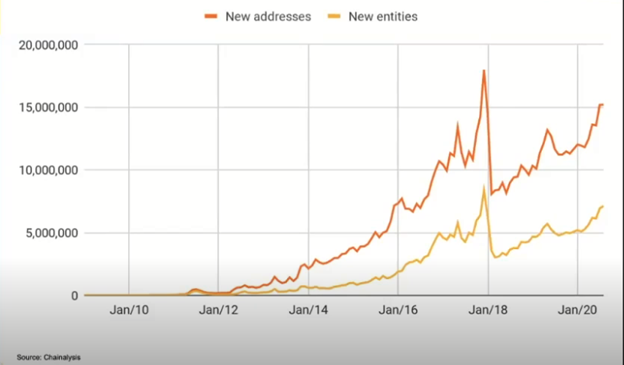
In order to understand, if the network is gaining adoption, we need to map addresses to entities based on their transaction behavior. This way we can attempt to calculate number of businesses and people that are actually behind the network. Recently it’s a bullish sign that monthly growth rate of addresses has picked up, though still shy of 2017 levels.
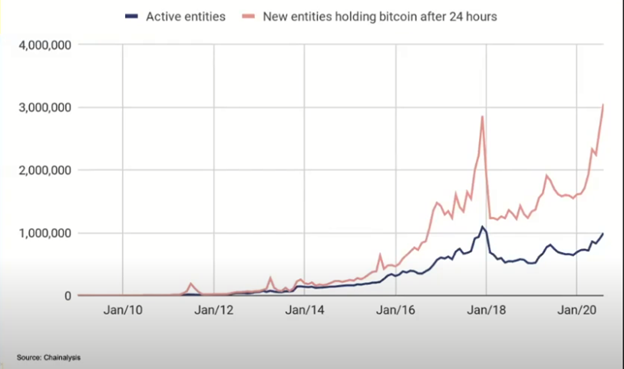
2. Active Entities. This shows how many entities are active each month, which means they had a positive balance at the start and at the end of the month and made a transaction.
According to this chart, the activity of the network is almost back at the 2017 level, however, we need to be aware of few biases. First (bullish) is that this analytic does not include hodlers, because they probably do not make transaction every month. Other (bearish) is that the more time passes, the easier it gets to map addresses due to access to more and better data, so clusters can be broken down into smaller clusters and we operate under assumption there are more users, where in fact, we can better map the addresses to entities behind them.
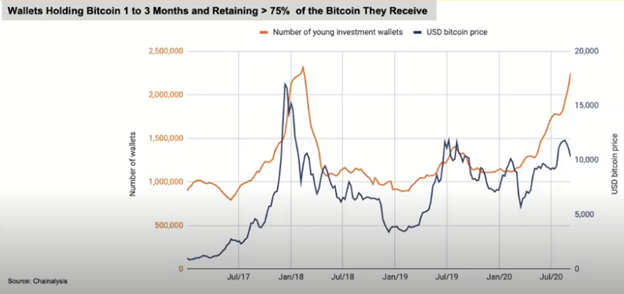
3. Longer-term investors. Here we can see these wallets by filtering based on holding Bitcoin for 1 to 3 months and retaining > 75% of the Bitcoin they receive. Here we can see that we are almost back at 2017 levels, which is bullish!
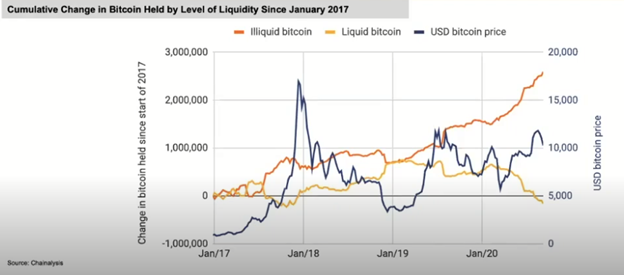
4. Illiquid bitcoin and liquid Bitcoin. Liquid Bitcoins are shifted around between wallets and exchanges, so they are part of the supply available to be sold or bought. We observe that Liquid Bitcoins (yellow line) are decreasing, which means fewer bitcoins available to be sold or bought, which makes the price movements of greater magnitude.
The number of illiquid bitcoin is steadily increasing, indicating investors want to hold this asset for long-term.
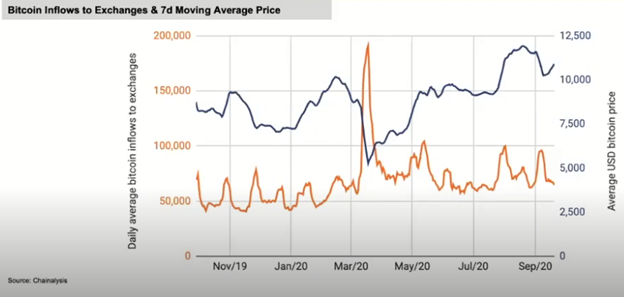
5. Bitcoin Inflows into exchanges. There was a huge spike in March 2020 due to COVID-19 pandemic, but since then the level has fallen off, though is still a bit elevated, when compared to 2019, which means that more Bitcoins are held in exchanges.
This does not necessarily mean higher possible sell pressure, but due to increased risk financial markets in general, people want to be prepared to act quickly.
In conclusion, Bitcoin addresses is a very important metric for evaluating adoption, but one needs to be careful of using raw number of Bitcoin addresses, because this needs to be adjusted in order to compute actual number of people and businesses that are behind these addresses. Nevertheless, recent trends in key metrics paint a rather bullish picture!